
- Oracle JRockit
- Oracle JRockit
- Credits
- Foreword
- About the Authors
- Acknowledgement
- About the Reviewers
- Preface
- 1. Getting Started
- 2. Adaptive Code Generation
- Platform independence
- The Java Virtual Machine
- Code generation strategies
- Adaptive code generation
- Inside the JIT compiler
- The JRockit code pipeline
- Controlling code generation in JRockit
- Summary
- 3. Adaptive Memory Management
- The concept of automatic memory management
- Fundamental heap management
- Garbage collection algorithms
- Speeding it up and making it scale
- Near-real-time garbage collection
- The Java memory API
- Pitfalls and false optimizations
- Controlling JRockit memory management
- Summary
- 4. Threads and Synchronization
- Fundamental concepts
- Java API
- Implementing threads and synchronization in Java
- Optimizing threads and synchronization
- Pitfalls and false optimizations
- JRockit flags
- Summary
- 5. Benchmarking and Tuning
- Reasons for benchmarking
- What to think of when creating a benchmark
- Deciding what to measure
- Industry-standard benchmarks
- The dangers of benchmarking
- Tuning
- Common bottlenecks and how to avoid them
- Wait/notify and fat locks
- Summary
- 6. JRockit Mission Control
- Background
- Mission Control overview
- The Experimental Update Site
- Debugging JRockit Mission Control
- Summary
- 7. The Management Console
- 8. The Runtime Analyzer
- 9. The Flight Recorder
- 10. The Memory Leak Detector
- 11. JRCMD
- Introduction
- Overriding SIGQUIT
- Limitations of JRCMD
- JRCMD command reference
- check_flightrecording (R28)
- checkjrarecording (R27)
- command_line
- dump_flightrecording (R28)
- heap_diagnostics (R28)
- hprofdump (R28)
- kill_management_server
- list_vmflags (R28)
- lockprofile_print
- lockprofile_reset
- memleakserver
- oom_diagnostics (R27)
- print_class_summary
- print_codegen_list
- print_memusage (R27)
- print_memusage (R28)
- print_object_summary
- print_properties
- print_threads
- print_utf8pool
- print_vm_state
- run_optfile (R27)
- run_optfile (R28)
- runfinalization
- runsystemgc
- set_vmflag (R28)
- start_flightrecording (R28)
- start_management_server
- startjrarecording (R27)
- stop_flightrecording (R28)
- timestamp
- verbosity
- version
- Summary
- 12. Using the JRockit Management APIs
- 13. JRockit Virtual Edition
- A. Bibliography
- B. Glossary
- Abstract syntax tree
- Access file
- Adaptive code generation
- Adaptive memory management
- Agent
- Ahead-of-time compilation
- Allocation profiling
- AST
- Atomic instructions
- Automatic memory management
- Balloon driver
- Basic block
- Benchmark driver
- Biased locking
- Bytecode
- Bytecode interpretation
- Call profiling
- Card
- Card Table
- CAS
- Class block
- Class garbage collection
- Client-side template
- Cloud
- Code generation queue
- Color
- Compaction
- Compare and swap
- Compressed references
- Concurrent garbage collection
- Conservative garbage collection
- Constant pool
- Continuous JRA
- Control flow graph
- CPU profiling
- Critical section
- Dead code
- Deadlock
- Deadlock detection
- Design mode
- Deterministic garbage collection
- Diagnostic command
- Double-checked locking
- Driver
- Editor
- Escape analysis
- Event
- Event attribute
- Event field
- Event settings
- Event type
- Exact garbage collection
- Exact profiling
- Extension point
- Fairness
- Fat lock
- Fragmentation
- Free list
- Full virtualization
- GC heuristic
- GC pause ratio
- GC strategy
- Generation
- Generational garbage collection
- Graph coloring
- Graph fusion
- Green threads
- Guard page
- Guest
- Hard real-time
- Hardware prefetching
- Heap
- HIR
- Hosted hypervisor
- Hypervisor
- Inlining
- Intermediate representation
- Internal pointer
- IR
- Invocation counters
- Java bytecode
- Java Memory Model
- JFR
- JIT compilation
- JMAPI
- JMX
- JMXMAPI
- JRA
- JRCMD
- JRMC
- JRockit
- JRockit Flight Recorder
- JRockit Memory Leak Detector
- JRockit Mission Control
- JRockit Runtime Analyzer
- JSR
- JSR-133
- JSR-174
- JSR-292
- JVM Browser
- Keystore
- Lane
- Large pages
- Latency
- Latency threshold
- Lazy unlocking
- LIR
- Livelock
- Livemap
- Live object
- Live set
- Live Set + Fragmentation
- Lock deflation
- Lock fusion
- Lock inflation
- Lock pairing
- Lock token
- Lock word
- Mark and sweep
- Master password
- MBean
- MBean server
- MD5
- Memleak
- Memory Model
- Method garbage collection
- Micro benchmark
- MIR
- Mixed mode interpretation
- Monitor
- Name mangling
- Native code
- Native hypervisor
- Native memory
- Native threads
- Non-contiguous heaps
- NxM threads
- NUMA
- Nursery
- Obfuscation
- Object header
- Object pooling
- Old space
- On-stack replacement
- Operative set
- Optimization queue
- Out of the box behavior
- Overprovisioning
- OS threads
- Page protection
- Parallel garbage collection
- Paravirtualization
- Password file
- PDE
- Perspective
- Phantom References
- Prefetching
- Producer
- Promotion
- RCP
- Read barrier
- Real-time
- Recording agent
- Recording engine
- Recursive lock
- Reference compression
- Reference counting
- Reference decompression
- Register allocation
- Relational key
- Rich client platform
- Role
- Rollforwarding
- Root set
- Run mode
- Safepoint
- Samples
- Sample-based profiling
- Semaphore
- Server-side template
- Soft real-time
- Soft references
- Software prefetching
- Spilling
- Spinlock
- SSA form
- Static compilation
- Stop and copy
- Stopping the world
- Strong references
- SWT
- Synthetic attribute
- Tab group
- Tab group toolbar
- Thin lock
- Thread local allocation
- Thread local area
- Thread local heap
- Thread pooling
- Thread sampling
- Throughput
- TLA
- Tracing garbage collection
- Trampoline
- Trigger action
- Trigger condition
- Trigger constraint
- Trigger rule
- Truststore
- Virtualization
- Virtual machine image
- Volatile fields
- Warm up round
- Weak reference
- Write barrier
- Young space
The last major feature in Memleak to be discussed in this book, is the ability to turn on allocation tracing for any given type. To, for instance, find out where the Leak$DemoObjects are being allocated in our previous example, simply right click on the type and then click on Trace Allocations. The example has been tailored to do allocations in the vicinity of the code that causes the actual leak (note that this is normally not the case).
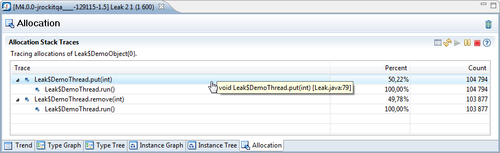
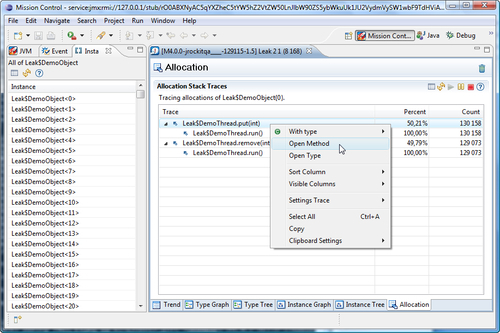
As can be readily seen from the screenshot, we are invoking put more often than remove. If we are running Memleak from inside Eclipse, we can jump directly to the corresponding line in the Leak class by right clicking on the stack frame and then clicking on Open Method from the context menu.
Allocation traces can only be enabled for one type (class) at a time.
-
No Comment