

148 OLPS: A TOOLBOX FOR ONLINE PORTFOLIO SELECTION
Figure A.1 Starting the Trading Manager.
Analyser button will start a new window, in which the user can run a single algorithm
and analyze its performance relative to the basic benchmarks. The Experimenter but-
ton is used for selecting multiple algorithms and comparing their performances. The
Configuration button is used to add or delete algorithms and datasets that can be used
by the toolbox.
A.2.1.2 Algorithm Analyser
On pressing the Algorithm Analyser button, a new window opens that will be used
for running and analyzing an algorithm. Figure A.2 depicts the Algorithm Analyser
running the Online Moving Average Reversion on the S&P500 dataset. There are
drop-down menus for selecting the algorithm and the dataset. The input parame-
ter fields will dynamically change depending on the inputs the algorithm requires
(default parameters have been provided). When a particular dataset is selected, some
preliminary performance details of the algorithm are displayed. There are three types
of preliminary results displayed. Basic Benchmarks displays the cumulative returns
for four simple algorithms—Uniform Buy and Hold, Uniform Constant Rebalanced
Portfolio, Best Stock in hindsight, and Best Constant Rebalanced Portfolio (BCRP).
For more details on these algorithms, refer to Section A.3. The Returns Distribution
shows the annualized mean return and standard deviation of each asset in the dataset.
The All Assets option shows the performance graph of cumulative returns of all the
assets in the dataset.
T&F Cat #K23731 — K23731_A001 — page 148 — 9/28/2015 — 20:46

FRAMEWORK AND INTERFACES 149
Figure A.2 Various components of the Algorithm Analyser.
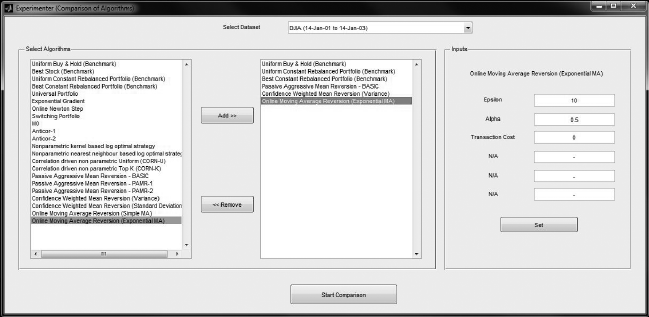
A.2.1.3 Experimenter
When devising trading strategies, we usually want to compare the performance of
these strategies relative to each other. For this purpose, we provide the Experimenter.
On pressing the Experimenter button, a new window opens that will offer us the plat-
form for comparing different strategies. First, the dataset is selected. From the list of
algorithms, a subset can be selected to be executed. Among the selected algorithms,
the input parameters have to be provided and saved (default values are already there).
Figure A.3 gives an example of comparing six strategies on the MSCI World Index
dataset. The six algorithms being compared are Uniform Buy & Hold, Uniform Con-
stant Rebalanced Portfolio, Best Constant Rebalanced Portfolio, Passive–Aggressive
Mean Reversion, Confidence Weighted Mean Reversion, and Online Moving Average
Reversion.
A.2.1.4 Results Manager
After hitting the Start button in the AlgorithmAnalyser or Experimenter, the execution
starts. In the Algorithm Analyzer, a progress bar indicates the execution of a single
algorithm. In the case of the Experimenter, there are two progress bars. One indicates
the number of algorithms executed (along with which algorithm is being executed
currently) and the other shows the status of completion of that individual algorithm.
T&F Cat #K23731 — K23731_A001 — page 149 — 9/28/2015 — 20:46
150 OLPS: A TOOLBOX FOR ONLINE PORTFOLIO SELECTION
Figure A.3 Various components of the Experimenter.
When the execution is over, the Results Manager shows all the basic performance
metrics of the algorithms. Since we have two different managers—one for analyzing a
single algorithm and one for comparing multiple algorithms—we made two different
Results Managers.
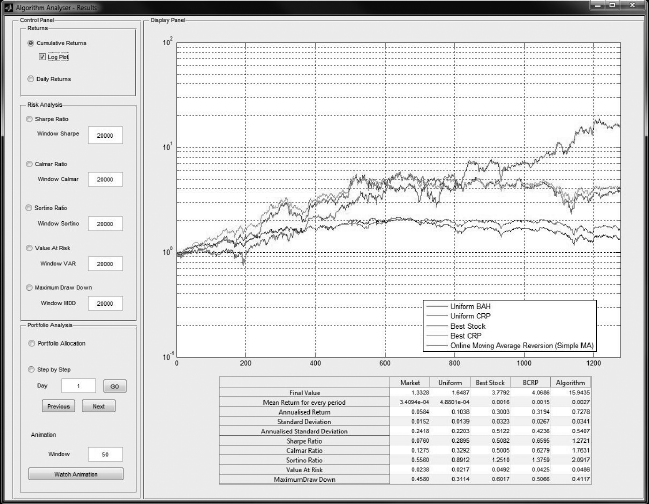
Results Manager 1 The first Results Manager for the Algorithm Analyzer is shown
in Figure A.4. The table in the window quantifies the results of the algorithm as
compared to the basic benchmarks. The numbers from this table can directly be
copied and pasted. There is a large graph space that displays the information on a
particular attribute selected in the left column.
Returns It contains information about the daily performance of the algorithm.
The user can choose to view the cumulative returns and the daily returns. The option
of a log (base 10) plot is provided for easier visualization when the difference in
performance of the algorithm and the benchmarks is significantly high.
Risk Analysis There are five metrics to evaluate the risk and risk-adjusted returns
of the algorithm. They are the Sharpe Ratio, Calmar Ratio, Sortino Ratio, Value at
Risk, and Maximum Draw down.An input box called Window is provided next to each
metric. The purpose of the window is to analyze the consistency of the algorithm,
instead of just the final result. For example, entering 252 in the Sharpe Ratio Window
will plot a graph of the Sharpe Ratio of the algorithm for time period t −252 to t, for
all t. When the window size is large such that t is less than the window size, then the
computation starts from t = 1. The risk metrics are assumed to be zero for the first
50 time periods. This has been done to avoid extreme values due to lack of data in
the initial periods.
Portfolio Analysis The Portfolio Allocation shows the distribution of wealth
allocated to each asset by the algorithm. The Step by Step helps us look at the port-
folio allocation for any particular given day. Lastly, we have a portfolio Animation
that accepts an input called Window. Visualizing portfolio changes based on daily
frequency can be overwhelming and difficult to interpret, especially when the daily
T&F Cat #K23731 — K23731_A001 — page 150 — 9/28/2015 — 20:46
FRAMEWORK AND INTERFACES 151
Figure A.4 Results Manager for Algorithm Analyser.
portfolio changes are significant. Instead, we allow the user to choose a moving aver-
age portfolio of the last Window number of days. This results in a smoother change
of the portfolio allocation.
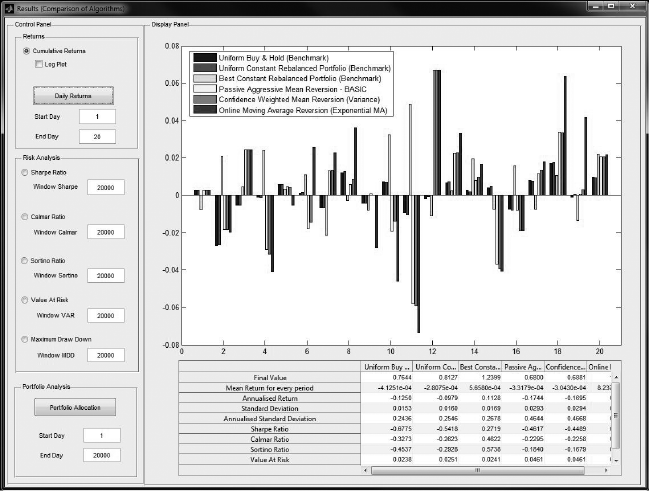
Result Manager 2 The second Results Manager is very similar to the first manager,
except that it is designed for the Experimenter. The table in the window quantifies
the performance of the algorithms relative to each other. Like the first manager, this
manager also has three sections. A preview of this manager can be seen in Figure A.5.
Returns The daily returns across the entire time period of the dataset for all the
algorithms can be overwhelming to view. A time period can be selected, and the daily
performance of the algorithms is displayed for only that time period.
Risk Analysis This section is almost identical to that of the first Results Manager.
The only difference is that here the metrics are evaluated for every algorithm and
displayed together.
Portfolio Analysis This shows the distribution of portfolio allocation for all the
algorithms.
A.2.1.5 Configuration Manager
Here, we describe how to add or delete new algorithms and datasets via the
Configuration Manager, as shown in Figure A.6.
T&F Cat #K23731 — K23731_A001 — page 151 — 9/28/2015 — 20:46
152 OLPS: A TOOLBOX FOR ONLINE PORTFOLIO SELECTION
Figure A.5 Results Manager for Experimenter.
New Strategy A template (“template.m”) has been provided in the Strategy folder
that is based on the general framework for OLPS (as described in Algorithm A.1).
The user should enter his code to learn the new portfolio within the specified region
of the loop. Without any changes to the code, the template will behave as a Uniform
Constant Rebalanced Portfolio strategy, owing to the fact that we start with a uniform
portfolio and never update it. All new strategies coded must remain in the Strategy
folder. Once the files are created in the folders, the configuration should be changed
using the Configuration Manager GUI, which controls the loading of algorithms and
datasets into the Trading Manager.
New Dataset A dataset is in the form of price relative vectors of various assets. The
t-th row represents the price relative of all the assets at time t. The user just has to
save the new price relative matrix in the Data folder. Data of different frequencies
can be used as well. All the datasets provided in the toolbox are of daily frequency.
Once the files are created in the folders, the configuration should be changed using the
Configuration Manager GUI, which controls the loading of algorithms and datasets
into the Trading Manager.
Configuration The configuration determines the algorithms and datasets being used
in the toolbox. Within the config folder, there is a file called config. This is the active
configuration, which means the toolbox uses this file to determine which algorithms
and datasets would be preloaded. There is another file config_default, which is the
T&F Cat #K23731 — K23731_A001 — page 152 — 9/28/2015 — 20:46
..................Content has been hidden....................
You can't read the all page of ebook, please click here login for view all page.