
Chapter 2. Agility and the Progression of Analytics
In this chapter, you’ll learn more about how analytics has evolved to support greater business agility at scale. Rodney Heisterberg and Alakh Verma, in their 2014 book Creating Business Agility, defined business agility as “innovation via collaboration to be able to anticipate challenges and opportunities before they occur.”1 To Heisterberg and Verma, “intelligent collaboration through automated business processes has the ability to alter the course of any important business activity.” As an organization adopts more sophisticated analytics, it unlocks this type of smart collaboration. In particular, an organization’s static and historically focused descriptive analytics become augmented with dynamic, insightful, and real-time predictive analytics.
The Elements of an Analytics Strategy
An organization’s analytics strategy is how its people, processes, tools, and data work together to collect, store, and analyze data.
With the first element, we’ll explore where, when, and how people engage with data and analytics. As previously discussed, intelligent collaboration is critical to business agility, so we’ll take a look at how different strategies stack up.
Any discussion about data in the modern organization doesn’t go far without reference to the data scientist, which in an infamous 2012 Harvard Business Review article was described as the “sexiest job of the 21st century.”2 But there are many critical roles needed to foster a successful analytics strategy, including but not limited to chief data officers, data analysts, data engineers, and line of business leaders.
Processes refers to how analytics are produced, consumed, and maintained. A more modern approach to analytics is intended to support greater business agility at scale. This requires faster data preparation from a wider variety of sources, rapid prototyping and analytics model building, and cross-team collaboration processes.
Tools, or technologies, are the raw programs and applications used to prepare for and perform analyses, such as the provisioning, flow, and automation of tasks and resources. As an analytics strategy matures, the technologies used to implement it tend to move from monolithic structures to composable microservices.
The last element is data, or the “new oil,” as British mathematician Clive Humby famously proclaimed.3 Debate has swirled ever since on how sound the analogy is; regardless, it’s true that without some raw data input, analytics isn’t possible. A modern analytics architecture supports a growing volume and variety of data sources, which may include data from data warehouses and data lakes—streaming data, relational databases, graph databases, unstructured or semi-structured data, text data, and images.
With these four elements in mind, let’s compare the analytics approaches of the past with those of today. Once you see the progression, you’ll be ready to understand the role of converged analytics. That will be the focus of Chapter 3.
Analytics Past
This refers to an era of analytics starting in the 1990s and running through the mid-2000s. During this phase, organizations were able to consolidate mostly transactional data into a unified system, often a data warehouse, which limited end users’ ability to interact directly with the data due to technical and governance requirements.
People
In Chapter 1 you learned about the traditional approaches to modeling in the insurance industry: generally, IT professionals were needed to kick off any data-based work by extracting data from a centralized, difficult-to-use source. This process could take multiple days, and the number of query requests could easy exceed the IT team’s ability to fulfill those requests—and the opportune time for new insights.
If some change was needed to data collection or storage methods, it could easily take IT months to perform. The data analysis and modeling work could take nearly as long. Rank-and-file domain experts did have some access to data, through so-called self-service business intelligence (BI) features. However, due to the same speed and accessibility issues that technical professionals faced, it was often difficult for domain experts like line of business leaders to truly lead with data for decision making.
Processes
As noted, IT professionals spent long periods of time gathering requirements for analytics projects before they could build or deploy solutions. The team meticulously catalogued sources of data used across the organization, from financial or point-of-sale systems to frequently used external datasets. As part of the warehousing process, it was decided which of these data sources to store and how to store them.
Once deployed, data passed into the warehouse through an extract-transform-load process (ETL), where the data was copied from these various sources, cleaned and reshaped into the defined structure of the data warehouse, then inserted into production. In other words, data went through rigorous cleaning and preprocessing before use.
To reach this data, users needed to write time-consuming ad hoc queries. Alternatively, particular data segments or summaries that were frequently requested by business users could be delivered via scheduled automation to reports, dashboards, and scorecards. Figure 2-1 depicts what a typical early analytics pipeline would look like to deliver data through ETL jobs to reports and scorecards.

Figure 2-1. An early analytics pipeline
Tools
Data warehouses implemented some new technologies relative to the traditional relational database model. Importantly, the data warehouse separated data into fact tables, where measurements were stored, and dimension tables, which contained descriptive attributes. Business users interacted with the data via reporting software to view static data summaries. These tended to rely on overnight batch jobs to update.
In a more sophisticated architecture, analysts could take advantage of online analytical processing (OLAP) cubes. Usually relying on a star schema, OLAP let users query the data across dimensions during interactive sessions. For example, they could “slice and dice” or “roll up and drill down” on the data.
By this point, end users had some autonomy in how they looked at and acted upon the data. Automated processes to inform business activities through data were also put into place, such as alerts when inventory or sales dropped below some threshold. Basic what-if analyses also helped business users evaluate decisions and plan for the future.
That said, given the limited sources of data from the data warehouse, there were limited ways to customize and work with the data. While reporting and basic analytics were automated, end users operated largely without the assistance of models developed by statisticians. Although business intelligence and operations research seek to create value from data, too often these complementary tools were siloed.
Data
During this period, data tended to be transactional, or related to sales and purchases. Take a point-of-sales (POS) system, for example. Each time a sale is made, information about what was sold, possibly to whom, is recorded in the POS system. Those records can be compiled into tables and ultimately processed into a data warehouse.
Under this process, data is gathered from prespecified sources at prespecified times, such as a nightly POS extract. Not all data made its way to the data warehouse, especially in the earlier days of analytics—either because it was judged unimportant, or because it was not prioritized.
Analytics Past and Business Agility
As discussed previously, the relatively rigid nature of the data warehouse made changes to the collection and dissemination of data difficult. Subsequently, business agility was limited. Business users could get historic data about the business through static reports (descriptive analytics). Through OLAP cubes, they could possibly even dig into the data to parse out cause and effect (diagnostic analytics). But without more immediate access to broader data, it was difficult to advance to predictive analytics, or the ability to ask: “What is going to happen?”
Analytics Present
Starting in the late 2000s, organizations were forced to rethink how they used analytics, in no small part due to the explosion of data during this time. This was the era of “Big Data” and its infamous “3 V’s”: volume, velocity, and variety.4 As organizations shifted their approach during this period, they unlocked diagnostic analytics, or the capability to answer “Why did it happen?” Let’s step through how the four elements of analytics worked together to achieve it.
People
It’s no coincidence that around the same time as Big Data emerged, so did the role of the data scientist. Compared with earlier roles like researcher or statistician, the data scientist blends quantitative and domain expertise with a greater degree of computational thinking. These skills became necessary both to handle the greater variety and volume of data sources and to update and deploy data and analytics models without the assistance of IT professionals.
Whereas IT in the past sought to meticulously catalog and structure data to enter into a data warehouse, they no longer needed to always clean the data before collecting it; these analytics teams could focus on ease of use and speed to governed access.
With these new workflows and organization structures in place, domain leaders are better able to lead with data: both via self-service BI tools and from frequent collaboration with data analysts, data scientists, and other data specialists.
Processes
As opposed to earlier analytics strategies, IT professionals now seek to collect data as is from any possible source of value. This data can be in a variety of formats, so few predefined rules or relationships are established for ingestion. Depending on the data size, data is processed in batch over discrete time periods, or in streams and events near real time. Because data cleaning is the last step, this process is sometimes referred to as extract-load-transform (ELT), as opposed to the ETL of earlier architectures. For data scientists and other technical professionals, faster access to more and more dynamic data better enables the rapid development of training sets of data for machine learning models. The ELT process allows for the construction of machine learning models, where computers are able to improve performance as more data is passed to them.
As more data is collected and put into production, the importance of a data governance process typically grows, describing who has authority over data and how that data should be used. Similar approaches are necessary to audit how models are put into production and how they work.
Tools
In 2011, James Dixon, then chief technology officer of Pentaho, coined the term data lake as the architecture needed to support the next level of analytics maturity.5 Dixon argued that because of the inherently rigid structures of data warehouses, getting value from the increasing volume and variety of data associated with Big Data was difficult. A data lake, “a repository of data stored in its natural/raw format,” was a better approach. In particular, this arrangement wasn’t suited to operate or capitalize on the expanding volume and variety of Big Data.
The data lake is often powered by cloud computing for the benefits of reliability, redundancy, and scalability. Dominant cloud service providers include Amazon Web Services (AWS), Microsoft Azure, and Google Cloud Platform (GCP). Open source technologies like Hadoop and Spark are used to process and store massive datasets using parallel computing and distributed storage. Because this data is often unstructured, it may be stored in graph, document, or other nonrelational databases.
With the increasing volume and velocity of data, and the use of data lakes along with data warehouses to enable data-driven decisions, businesses needed better ways to scale and share business intelligence. One such path was through interactive, immersive exploration and visualization of the data, as pioneered with Spotfire. Other paths were through visual reports and dashboards, as used by not just Spotfire, but by Jaspersoft, Power BI, WebFOCUS, and many others. As BI tools matured, self-service capabilities and automation for end users also matured.
Figure 2-2 depicts what a typical contemporary analytics pipeline looks like to serve various data sources through various architectures to BI tools and dashboards.
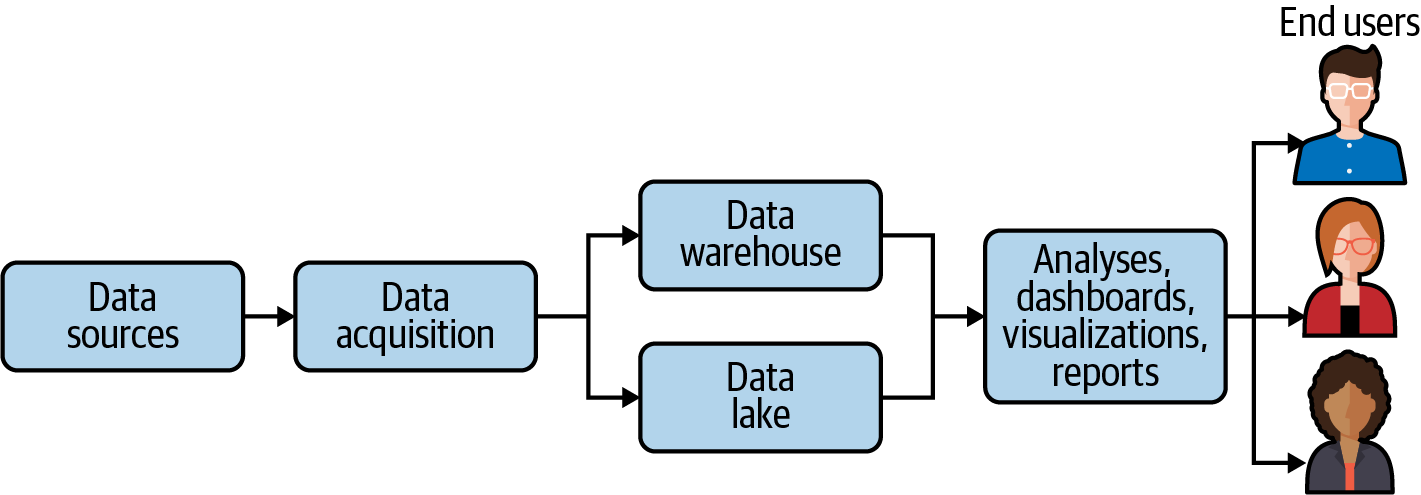
Figure 2-2. A contemporary analytics pipeline
Data
Contemporary analytics expands the variety of data available and used: both structured tables and unstructured sources like natural language and images are available. On account of stream processing, refreshes of this data are available in minutes or even less. In particular, the data lake can accommodate real-time events such as IoT sensor readings, GPS signals, and online transactions as they happen.
Analytics Present and Business Agility
This next phase in the evolution of analytics gets data-driven insights into the hands of end users quickly, with technology allowing them to interact with it on a deeper level. Data scientists are able to build machine learning systems that improve with more data. Using drag-and-drop tools, business users can process and analyze data without technical assistance. With cloud, automation, and streaming technologies, organizations have been better able to adapt to and plan for changing circumstances.
That said, machine learning works only so long in production before the algorithm struggles to account for changes to the business and needs intervention. While data scientists undertake these predictive challenges, BI professionals and domain experts tend to operate solely in analyzing current or past data. The next generation of analytics architecture will further reflect organizational needs for greater collaboration among data scientists, BI and analytics teams, and business users and consumers of analytics insights.
Analytics Future
In Chapter 3 you will learn about converged analytics as the next step for organizations. Under this approach, an organization’s use of analytics begins to resemble Mark Weiser’s famous dictum from a 1991 Scientific American article that “the most profound technologies are those that disappear.”6 Silos that slowed progress toward more valuable, data-driven insights will now be more permeable, supporting collaboration and automation in a convergence that leads to greater agility.
1 Rodney Heisterberg and Alakh Verma, Creating Business Agility: How Convergence of Cloud, Social, Mobile, Video, and Big Data Enables Competitive Advantage. (Hoboken, NJ: John Wiley & Sons, 2014).
2 Thomas Davenport and D. J. Patil, “Data Scientist: The Sexiest Job of the 21st Century,” Harvard Business Review, October 1, 2012.
3 George Firican, “How Data Is (And Isn’t) Like Oil,” TDWI, April 22, 2019.
4 Doug Laney, “3D Data Management: Controlling Data Volume, Velocity, and Variety,” Gartner, file No. 949, February 6, 2001.
5 Dan Woods, “Big Data Requires a Big, New Architecture,” Forbes, July 21, 2011.
6 Mark Weiser, “The Computer for the 21st Century,” Scientific American 265, no. 3 (September 1991): 94–105.