
5
Understanding Interactions with Stakeholders: Operational Architecture
5.1. Why understand interactions with stakeholders?
Operational architecture, or equivalently operational analysis, intends to precisely understand the interactions over time between the system of interest and the external systems of its reference environment, or equivalently of its stakeholders. Motivations of environment architecture, as already discussed in section 4.1, also apply in exactly the same terms – mutatis mutandis – to operational architecture. As for stakeholder identification, any forgetfulness, misunderstanding or error that could occur during the operational architecture process may indeed have disastrous – and usually costly – consequences on a system under development.
As previously pointed out in section 4.1, we must indeed understand that any function and any component of a system ultimately intend to provide an answer to a stakeholder and thus are always involved in the different interactions that are taking place between the system and its environment (of reference). We can therefore just not design – at least with a reasonable level of confidence – the different functions or components of a system without understanding the missions to which they contribute. Many design mistakes are typically done when designers do not have any precise idea of the various operational contexts in which the system they are developing will be used. We can thus only stress here the imperious necessity of always managing operational architecture in any systems architecting process, which will moreover allow us to bring back “meaning” to the end-engineer who is working on a little part of a large system. Medieval cathedrals – whose construction took centuries – would probably never have been built if all involved workers had not had a deep understanding of the global target to which they were contributing….1
The decoupling between operational architecture and both functional and constructional architecture is also fundamental. This apparently simple principle is in fact much more subtle than it seems. It typically allows us to develop systems that have very different operational architectures, but similar functional and constructional architectures. This is the principle of product lines where we construct “flexible” systems which have a very large customer diversity – in order to fit as closely as possible to the needs of the market – but with a very low technical diversity2. The idea is to develop a family of systems with a very large number of operational architectures, corresponding to different customer needs, on the basis of, on the first hand, standard functional and constructional elements (usually corresponding to everything that the customer does not see) and, on the second hand, a limited number of additional specific functional and constructional elements that are capturing the operational – or equivalently here the customer – diversity (and thus the business value which is perceived by the customer). Such an approach allows us to deliver highly customized products to the customer that are constructed using only standard modules. Many industries – automotive, consumer electronics and even food and beverage3 – are using with success this type of architecture for their products.
Despite its core importance as stressed above, operational architecture is unfortunately still an analysis which is not well known and often not practiced at all, probably since it may be considered as not sufficiently technical and concrete (engineers usually like to quickly jump into technique …). We thus must emphasize the value of operational architecture which is – even if apparently not too technical4 – a core technical analysis that can only be done by a systems architect. We shall indeed understand that operational architecture deliverables are structured in order to be easily mapped with functional and constructional deliverables. Thus, it is just impossible to perform any operational architecting without precisely understanding its functional and constructional consequences, which can only be done by a technical-minded person, typically a systems architect.
5.2. The key deliverables of operational architecture
For any system S, operational architecture has five core types of deliverables:
- 1) The need architecture diagram that hierarchically organizes all needs – with respect to S – according to a refinement hierarchy (see below).
- 2) The lifecycle diagram that describes how S passes – with indication of the associated events – from an operational context to another one, starting from its birth up to its death.
- 3) The use case diagrams that are describing – in a purely static way – the missions of S that are contributing to a given operational context.
- 4) The operational scenario diagrams that are describing – in a dynamic way – the interactions taking place between S and its stakeholders6 in a given operational context.
- 5) The operational flow diagrams that synthetize all flows – with their logical relationships – exchanged between S and its reference environment during the lifecycle of S.
These different types of deliverables are presented in more detail below.
5.2.1. Need architecture diagram
Let S be a system. The need architecture diagram of S is then a hierarchical exhaustive representation of all needs with respect to S, a need N1 being under another need N2 in this hierarchy if and only if we can logically deduce N1 from N27. In this last situation, we say then more precisely that N2 refines into N1, which explains why we speak of a need refinement hierarchy8.
Figure 5.1 below shows a (partial) need architecture diagram for an electronic toothbrush, a need being – classically – represented by a two-part box, whose first top part is a short name summarizing the need scope and whose second bottom part is the need statement, when the refinement relationships on which the need hierarchy relies are – also classically – represented by arrows.
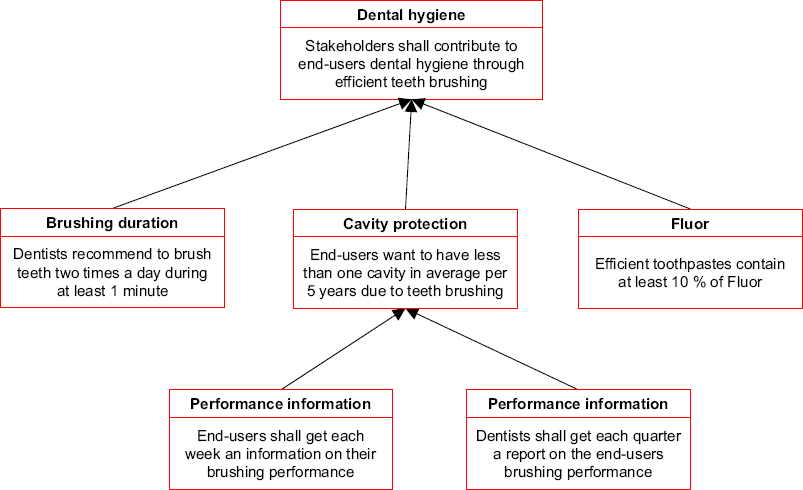
Figure 5.1. Example of a need architecture diagram for an electronic toothbrush. For a color version of this figure, see www.iste.co.uk/krob/systems.zip
The same issue that was already pointed out in the first part of section 4.2 when dealing with the stakeholder hierarchy diagram can also be expressed – more or less in the same terms – with the need architecture diagram: organizing a need refinement hierarchy is indeed always difficult since we shall avoid having too many first level needs, as well as too many levels of refinements if we want to be able to efficiently use such a view. The 7x7x7 rule (see the first part of section 4.2) is again precious to handle this real difficulty. As a consequence, a typical “good” need architecture diagram associated with a given system shall have no more than seven high-level needs, each of them refined in around seven medium-level needs, finally also refining in the same way into seven low-level needs. Note again that the number 7 shall of course be just taken as an order of magnitude. Obtaining up to 10–12 high-level needs in a need architecture diagram could of course work: however, we must probably not go further without analyzing whether this number is justified. Finally, we shall not hesitate to construct additional need architecture diagrams for refining such an analysis as soon as all relevant needs are not captured.
5.2.2. Lifecycle diagram
Again let S be a system. The lifecycle diagram of S is then a representation of:
- – the operational contexts of S, with their relative temporal relationships, that is, consecutiveness, inclusion or simultaneity9;
- – the events that cause the different transitions between each operational context of S and the immediately consecutive ones.
To draw such a diagram, we shall give the standard representations of the three temporal relations between operational contexts that we introduced above, which are provided by Table 5.1, where C and D stand for generic operational contexts. Remember here that operational contexts are modeled by ovals, as introduced in the first paragraph of section 3.4.2.
Table 5.1. Graphic representations of temporal relationships between operational contexts. For a color version of this table, see www.iste.co.uk/krob/systems.zip
| Temporal relation | Semantics | Graphic representation |
| Consecutiveness | D is consecutive to C when a termination event of C is exactly equal to an initiation event of D |  |
| Inclusion | D is included in C when the period of time underlying D is contained in the period of time underlying C |  |
| Simultaneity | D is simultaneous to C when the periods of time underlying C and D are exactly equal |  |
Figure 5.2 below provides an illustrative lifecycle diagram associated with an electronic toothbrush, taking here the standard representation of operational contexts and of their temporal relationships that we introduced. Events – that induce operational context transitions – are modeled by arrows labeled with the name of the relevant event. Note, however, that the initial (respectively, termination) events in each operational context do not respect this rule since they are conventionally modeled by small black circles (respectively, by white circles containing a black circle).

Figure 5.2. Example of the lifecycle diagram for an electronic toothbrush. For a color version of this figure, see www.iste.co.uk/krob/systems.zip
We may finally notice that there is a perfect symmetry between the environment diagram, which models the space in which evolves a system, and the lifecycle diagram, which models the periods of time through which a system passes. Since both space and time are always required to specify any system behavior (that necessarily takes place somewhere during a certain period of time), we can easily see that these two diagrams are equally important to specify any system.
5.2.3. Use case diagrams
Let S be a system, let Env(S) be its reference environment and let q(S) be an operational context of S. A use case diagram associated with S and q(S) is then a static representation of the missions achieved through the collaboration of S and its external systems within Env(S), during the period of time that is modeled by q(S), which explicitly specifies:
- 1) the external systems of the environment of S that are contributing to each mission;
- 2) the missions that contribute to another mission.
Note that it is sometimes necessary, when modeling a use case diagram, to also represent behaviors of Env(S) in which the system S is not contributing at all. This is done by just indicating that S is not contributing to such a function of Env(S).

Figure 5.3. Example of a use case diagram for an electronic toothbrush. For a color version of this figure, see www.iste.co.uk/krob/systems.zip
Figure 5.3 that follows provides an example of a use case diagram, associated with the “brushing data transmission” operational context of an electrical toothbrush. The square represents the system of interest, and we used again the “person” representation to model its stakeholders. A mission is (respectively, not) placed in the square when the system of interest contributes (respectively, does not contribute) to it. In the same way, we put a line between a stakeholder and a mission when the considered stakeholder contributes to such a mission10. We also indicate using a rigid arrow when a mission contributes to another mission and using a dashed arrow when a given mission M1 is mandatory to manage another one M2. Beware at that last level since the standard convention in this matter is highly counter-intuitive: we indeed model such a situation by putting a dashed arrow from M2 to M1 and not the converse. Note finally that it is interesting to observe in that example that the motivation of the “brushing data transmission” cannot be found in a mission of the electronic toothbrush, but rather in the “follow brushing recommendations” which is an environment function involving only end-users and dentists, but not the electronic toothbrush. We can then easily understand the value of a use case diagram on such a situation since it would clearly not be possible to describe, without a specific environment-oriented formalism, such a situation.
It is interesting to point out that if we consider the special – limit – case of the operational context equal to the complete lifecycle of a given system S, the associated use case diagram would especially provide a hierarchical representation of all missions of S, jointly with the indication of the different stakeholders that are contributing to each mission of the system. For the sake of readability, we can of course break down that last use case diagram into the two following use case diagrams:
- 1) The first provides a hierarchical representation of all missions of S, which shall be naturally called the Mission Breakdown Structure (MBS) of S11.
- 2) The second provides the indication of the stakeholders that contribute to each mission of the system, whose semantics is equivalent to a mission to stakeholder allocation matrix.
Note finally that if no hierarchically related missions occur when modeling a given use case diagram, the semantics of such a diagram is completely contained within the associated operational scenario diagram (see the next section). We shall in particular notice that a use case diagram is useless when we have the associated operational scenario diagram (the converse being not true).
5.2.4. Operational scenario diagrams
Let again S be a system, Env(S) be its reference environment and q(S) be an operational context of S. An operational scenario diagram associated with S and q(S) is then a dynamic representation of the missions achieved through the collaboration of S and its external systems within Env(S), during the period of time modeled by q(S), which explicitly specifies all interactions occurring between S and the stakeholders – or equivalently the external systems – of its reference environment.
Figure 5.4 shows an example of an operational scenario diagram, associated with the “reparation” operational context of an electrical toothbrush. We refer to the suitable paragraph of section 3.4.2 for all details on the semantics of the below representation.
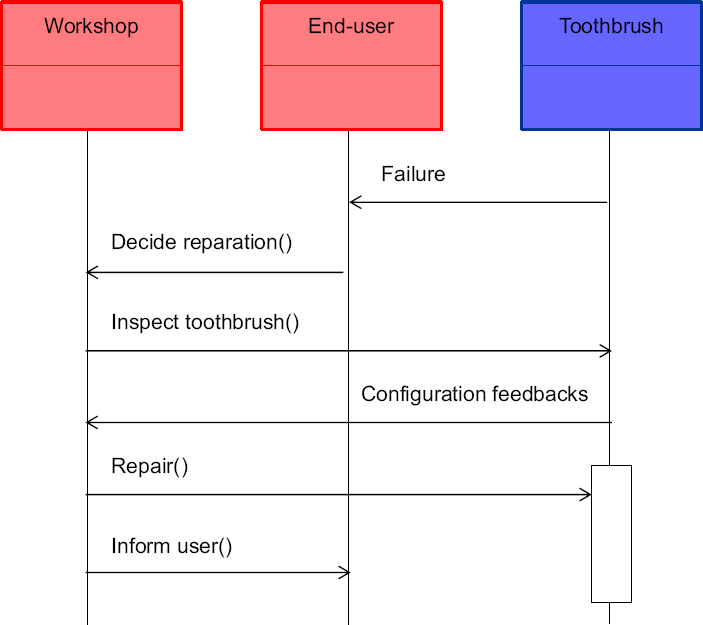
Figure 5.4. Example of operational scenario diagram for an electronic toothbrush. For a color version of this figure, see www.iste.co.uk/krob/systems.zip
An operational scenario diagram provides, therefore, an explicit algorithmic description which models the behavior of the environment of a given system during a given operational context. As already stated in the last paragraph, we must always choose whether to use either a use case diagram or an operational scenario diagram, to specify an operational context, when no hierarchically related missions occur within the use case diagram, since this last diagram will not add any semantics to the corresponding operational scenario diagram.
5.2.5. Operational flow diagram
Let S be a system. The operational flow diagram associated with S is a consolidated description of all operational flows associated with S and of:
- 1) their logical relationships;
- 2) their abstraction relationships12.
This new diagram thus plays the role of the operational “data model”13 of the system. Note that we may also split this diagram into two diagrams, each of them covering the two above points.
Figure 5.5 below shows an example of (partial) operational flow diagram, associated with an electrical toothbrush. The different logical relationships, which exist between the various operational flows (or objects) represented in that diagram, are modeled by rigid lines (without any arrow) labeled with the denomination of the corresponding relationship. Note that we usually use a verb – in the third form of singular – to name such a logical relation: in an operational flow diagram, the line connecting a flow of type A with a flow of type B that represents a logical relation between A and B is typically labeled by a verb such as “is related to” in order to express that “A is related to B” or that “B is related to A”. To avoid ambiguity, we place the relationship denomination closer to the first term of such a logical relationship14.
We may also put on the extremity of these lines an indication of the arity of the relationships: if n operational flows of type A can be associated with m operational flows of type B within a given logical relation, we just put a label with “n” (respectively, “m”) at the A-extremity (respectively, B-extremity) of the line put between A and B that models the corresponding relation (we recall that (n,m) is called the arity of such a logical relationship). Note also that, by convention, we put “*” instead of a natural number when there are no known limits to the number of involved elements.
Finally, on another totally different hand, the possible abstraction relationships that are provided in the above diagram are modeled – according to a classical convention – by squared arrows.
As already stated, the operational flow diagram defines the operational flow or object model of a given system. It is completely “dual” to the environment, use case or operational scenario diagrams since it focuses on flows, and not on the different functions, either of the system or of its reference environment, that are producing these flows. Unfortunately, most of the engineers, who usually do not have any computer science or software engineering background, do not understand the importance and the value of this new type of flow-oriented diagram …

Figure 5.5. Example of operational flow diagram for an electronic toothbrush. For a color version of this figure, see www.iste.co.uk/krob/systems.zip
We must therefore emphasize that such a diagram is of high importance since it rationally describes in a consolidated and organized way all inputs and all outputs of a given system. Hence, it gives the operational “dictionary” of the system, that is, the list of all the objects that are operationally manipulated by the system. This dictionary is of high value for ensuring a common vision between all project actors involved in the operational architecting process: these actors shall normally – in an ideal world – only use the terms of that dictionary when discussing an operational object. We may easily understand that such a principle allows us to avoid any ambiguity between the system designers and the project system stakeholders, as well as within the different specialty engineers. It is thus key for ensuring a good collaboration between all these actors.
- 1 In “The announcement to Mary”, a play written by the French writer P. Claudel whose action takes place in the Middle-Age during the construction of the Saint-Rémi church in Reims – France, two sculptors are working on a little statue located in the front of the church. One asks them what they are doing and they are answering: “we are building a cathedral”!
- 2 This last principle is the basis of diversity management whose purpose is to maintain in configuration among time such flexible architectures.
- 3 All types of Danone or Nestlé yoghurts are for instance made using the same white mass (standard module #1) and the same preforms, that is, tubes from which different types of cups are produced through adapted blowing (standard module #2). When making a yoghurt, the industrial process begins by creating a “generic” type of yoghurt, before adding the specific additives (or specific modules) that are given various flavors to yoghurts. This principle is called late differentiation: it allows us to quickly react when a competitor launches a new product or when the customer taste evolves, since we just need changing the last machines of the industrial chain to adapt, without reorganizing, the full chain (which takes time and money).
- 4 Operational architecture can indeed be seen as an interface between the stakeholder and the engineer worlds, since it offers a language that can be understood both by stakeholders and engineers, which explains its apparent simplicity.
- 5 This case study also illustrates that the operational architecture cannot be done in isolation. We must always understand and validate its functional and constructional consequences before freezing an operational architecture.
- 6 Or equivalently external systems.
- 7 Remember that needs are logical predicates (see section 3.4.2).
- 8 An additional important property of a need architecture is coverage: we shall try to construct the need architecture diagram in order to maintain the coverage logical property which states that N1 ∧ … ∧ Nn → N0 for all needs N1, …, Nn which are under a given need N0 in such a hierarchical diagram.
- 9 These three temporal relations are necessary and sufficient to model any temporal relationships between operational contexts among a system lifecycle. To be convinced of that claim, let us analyze the only embarrassing situation of two intervals of times P and Q that overlap, that is, such that P = [s, t] and Q = [u, v] with u < t. We can model such a situation with our temporal relations by first breaking down P into P1 = [s, u] and P2 = [u, t] and Q into Q1 = [u, t] and Q2 = [t, v], and observing then that P2 is consecutive to P1, Q1 is simultaneous to P2 and Q2 is consecutive to Q1.
- 10 Let UC(S) be a use case diagram associated with a given system S. A mission which is put in the square part of UC(S) and which is connected through lines to stakeholders S1, … , Sn within UC(S) is then formally a function of the system resulting from the integration of S with S1 up to Sn.
- 11 If one decides to model such a mission breakdown structure (MBS), one must beware to the readability of such a view. All the recommendations based on the 7x7x7 rule that we previously gave for the stakeholder and the need architecture diagrams will then of course also apply – mutatis mutandis – in order to efficiently model the MBS.
- 12 We recall that a flow A is abstracted by a flow B if and only if A is a special instance of B. As an example, matter is for instance abstracted by energy in relativist mechanics.
- 13 Beware that, even if we use the syntax of a data model for the operational flow diagram, this last diagram is not really a data model since it does not represent (only) data, but also physical objects, business objects or even informal information that may be exchanged by “humanware” stakeholders of a given system.
- 14 Strictly speaking, we should put two labels on each line between any flow A and any flow B in order to express both the logical relations between A and B and between B and A. However, this would be too heavy which explains our convention.