
4
Identifying Stakeholders: Environment Architecture
4.1. Why identify stakeholders?
Stakeholder identification, or equivalently environment architecture, is a key systemic analysis: each mistake in this analysis may indeed result in flaws in the product under design. We must indeed remember that a system is nothing other than a concrete answer to a series of needs1 and that these needs are coming from external stakeholders. As an immediate consequence, forgetting important stakeholders, misevaluating their role and/or considering erroneous ones will result in missing needs and/or working with incorrect needs, and hence in missing requirements and/or working with wrong derived requirements, relatively to a given system. The resulting concrete system that might be developed on such a basis will therefore typically either miss the functions and components that are specifically addressing these missing needs, or have unnecessary functions and components that are associated with these incorrect needs. We can therefore easily understand the crucial importance of correctly identifying stakeholders – that is, the necessary and sufficient ones – since any system development process fundamentally relies on the quality of this identification.
To stress on this last point, we shall also have in mind the potential cost(s) of incorrect stakeholder identification which explain why we must put the necessary energy into this core initial analysis. In this matter, we commonly consider that such costs follow a geometric progression within the system lifecycle (see Figure 4.1): if the correction of an error during stakeholder identification has cost 1 (i.e. typically adding a missing stakeholder or replacing an erroneous stakeholder in this analysis), we usually consider that correcting the consequence of that error will have cost 10 when done during system design, cost 100 when corrected during detailed design, cost 1,000 when discovered during integration and even cost 10,000 if managed when the system is in service. We must thus spend enough time initially in order to achieve an as-sound-as-possible environment architecture.
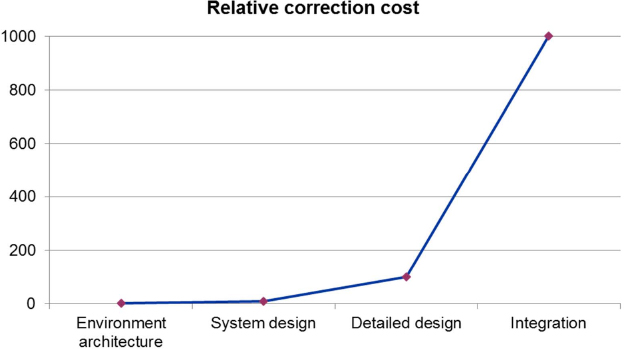
Figure 4.1. Impact of an error in environment architecture. For a color version of this figure, see www.iste.co.uk/krob/systems.zip
Any systems architect shall in particular always be highly anxious of being sure that stakeholders are correctly identified since the entire development process relies on that initial analysis!
4.2. The key deliverables of environment architecture
For any system S, environment architecture has two core deliverables:
- 1) The stakeholder hierarchy diagram that hierarchizes all stakeholders associated with S – or equivalently external systems – according to an abstraction hierarchy (see below).
- 2) The environment diagram that describes the exchanges existing between S and its first-level stakeholders – or equivalently external systems – with respect to the above hierarchy.
These two deliverables are presented more in detail in the two below sections.
4.2.1. Stakeholder hierarchy diagram
Let S be a system and let Env(S) be its reference environment (see section 3.1). The stakeholder hierarchy diagram of S is then a hierarchical exhaustive representation of all stakeholders – or equivalently all external systems to S – that belong to Env(S), a stakeholder H1 being under another stakeholder H2 in this stakeholder hierarchy if and only if H1 is contained in H2 (simply viewed here as sets of elementary stakeholders), meaning that H1 is a special case of H2 or equivalently that H2 is more abstract than H1.
The project system is for instance a typical stakeholder, associated with any engineered system that is hierarchically abstract – in the above meaning – an engineering system, an industrialization system (including plants and industrial people), the supply chain and the delivery logistics. The engineering system may for instance be recursively hierarchically broken down into a project management team, a systems architecture team, different specialty engineering teams and a verification and validation team. The same type of recursive breakdown applies of course for all other first-order stakeholders.
Figure 4.2 below also provides an illustrative partial example of stakeholder hierarchy diagram for an electronic toothbrush, a stakeholder or equivalently an external system being – classically – represented here by a graphic depicting a person2, when the inclusion or abstraction relationships on which this hierarchy relies are – also quite classically – represented by arrows.

Figure 4.2. Example of a stakeholder hierarchy diagram for an electronic toothbrush
When dealing with the stakeholder hierarchy diagram, the main standard difficulty is to find the “good” abstractions. We shall indeed avoid having too many first level stakeholders, as well as too many levels of abstractions, if we want to be able to efficiently use such a view. The 7x7x7 rule provides a simple trick to use in order to optimally organize this diagram. This ergonomic principle indeed claims that a human being can only holistically understand a maximum number of more or less 3503 data, as far as they were hierarchically clustered into seven main groups of data, each of them again broken down into seven subgroups, each of them finally containing seven elementary data. The 7x7x7 principle is therefore a precious tool for organizing a stakeholder hierarchy diagram: the limitations of the human brain indeed oblige us to respect it when constructing such a diagram, as soon as we want to easily read and communicate with these diagrams. As a consequence, a typical “good” stakeholder hierarchy diagram has no more than seven high-level stakeholders, each of them broken down around seven medium-level stakeholders, refining finally into seven low-level stakeholders. Note of course that the number 7 shall just be taken as an order of magnitude. Obtaining up to 10–12 high-level stakeholders in a stakeholder hierarchy diagram would typically not be a heresy: however, we must not go further without at least checking whether this number is justified. Finally, we shall not hesitate to construct additional stakeholder hierarchy diagrams for refining such an initial analysis as soon as all relevant stakeholders are not captured.
4.2.2. Environment diagram
Again let S be a system and Env(S) be its reference environment (see section 3.1). The environment diagram of S is then a representation of:
- – the system S and all the high-level stakeholders – or equivalently external systems to S – in the meaning of the stakeholder hierarchy introduced in the previous paragraph;
- – all flows exchanged between the system and its stakeholders, that is, between S and the external systems of its reference environment.
Figure 4.3 gives an example of the environment diagram, here associated with an electronic toothbrush, taking the same representation for the stakeholders of Env(S) as in the previous stakeholder hierarchy diagram, when the system of interest S is modeled by a box.
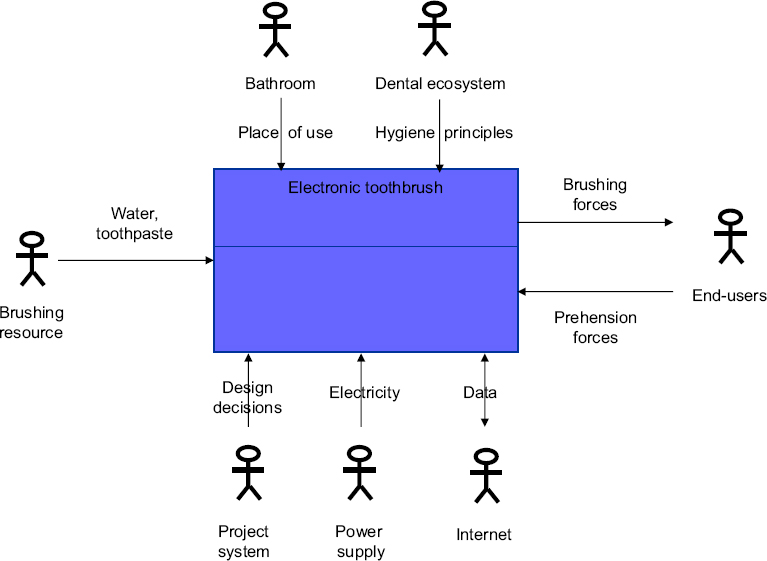
Figure 4.3. Example of an environment diagram for an electronic toothbrush. For a color version of this figure, see www.iste.co.uk/krob/systems.zip
A classical way of organizing an environment diagram for a given system S consists of, respectively, positioning the following stakeholders, that is, external systems, in the four quadrants of the diagram:
- – in the left hand-side of the diagram: key input systems of S;
- – in the right-hand side of the diagram: key output systems of S;
- – in the top of the diagram: key constraining systems with respect to S;
- – in the bottom of the diagram: key resource systems with respect to S.
These key input, output, constraining and resource systems associated with S within the environment diagram will be, respectively, denoted below by I(S), O(S), C(S) and R(S).
Note that the environment diagram of Figure 4.3 is for instance typically organized in such a way. This mode of representation is useful since it equips such a diagram with a natural semantics. We may indeed automatically read the mission of the considered system on any environment diagram which is organized in such a way using the pattern given in Table 4.1.
Table 4.1. Pattern of the mission statement of a system
| Pattern of the mission statement of a system S |
| The system S shall transform inputs of I(S) into outputs of O(S) under constraints C(S) and with resources R(S). |
In a similar way, functional analysis is also naturally oriented by such a representation mode. The core functions of a system S are indeed then the functions that are connecting the input systems I(S) to the output systems O(S), when the piloting and the support functions of S are the functions that are mainly exchanging with, respectively, the constraining systems C(S) and the resource systems R(S).
The environment diagram is thus a very important diagram which induces structuring architectural orientations for a system. It can also be used for monitoring the first systems architecting activities. A good environment architecture shall indeed fundamentally always be well balanced: the number of lower-level stakeholders or of needs per high-level stakeholder shall typically be more or less the same. Any difference of balance in these numbers shall therefore necessarily puzzle the good systems architect who must question it, in order to find whether there is a rational explanation for it, which of course is the case (see Appendix 2 for an example of this situation). As we can see, the environment diagram is a very rich diagram and a precious tool for the systems architect!
- 1 We recall that we are using here the term “need” in a technical way. A need indeed refers to any property expected (which would correspond to a need in the common sense) or imposed (which would rather correspond to a constraint in the common sense) by the environment of a given system (see section 3.4.2 for more details).
- 2 This is just a representation which may typically model any hardware, software or “humanware” system, as soon as they are part of the reference environment of the considered system.
- 3 We recall that 7 multiplied by 7, multiplied again by 7 makes 343.