
We put a bit more extended (but in no way complete) classification with links (based on Volume 4, page 389, where every category is presented in chronological order of our encounter with links):
Synthetic
Natural
This research was motivated during the work on a memory dump differing tool called DumpLogic that can do logical and arithmetic operations between memory snapshots, for example, take a difference between them for further visualization. This tool resulted in another simple tool called DumpFilter. The latter allows filtering certain unsigned integer (DWORD) values from a memory dump (or any binary file) by replacing them with 0xFFFFFFFF and all other values with 0×00000000. The resultant binary file can be visualized by any data visualization package or transformed to a bitmap file using Dump2Picture (Volume 1, page 532) to see the distribution of filtered values.
As a filtering example we used TestDefaultDebugger64 (Volume 1, page 641) to generate a process user memory dump. It was converted to a BMP file by Dump2Picture:
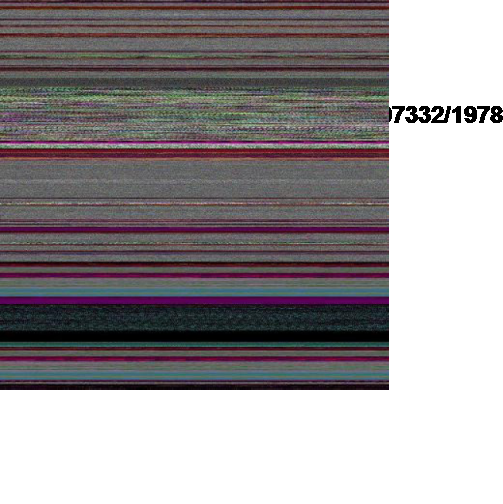
Then we filtered only AV exception code 0xc0000005:
C:>DumpFilter tdd64.dmp tdd64.bin <dwords.txt
dwords.txt just contained one line
c0000005
It is possible to filter many values. We just need to put more lines to dwords.txt file. tdd64.bin file was converted to tdd64.bmp by Dump2Picture:
C:>Dump2Picture tdd64.bin tdd64.bmp
Because the image had only black and while RGBA colors we saved it as a B/W bitmap:

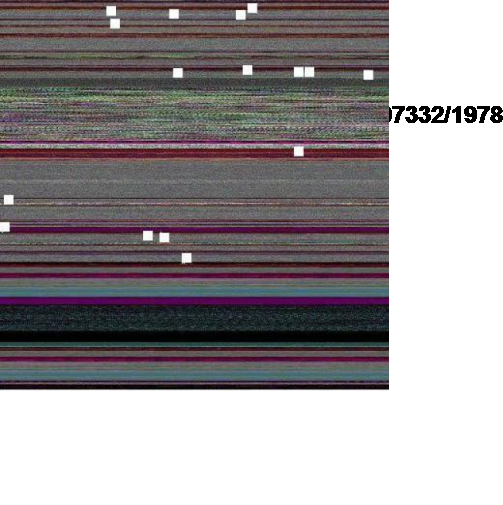
Every AV exception code is a white dot there but it is difficult to see them unless magnified. So we enlarged them manually on the following map:

We put them on the original image too and can see that exception processing spans many areas:
The tool and the sample dwords.txt file (for c0000005 and 80000003) can be downloaded from Crash Dump Analysis portal[72].
Another example: Night Sky (page 376) memory space art image is just a fragment after filtering all 1 values from another process memory dump.
Yes, it can. Here's the Dump2Picture (Volume 1, page 532) image of a kernel memory dump (3 GB) from a 128 GB system:

The blue color can be seen in the Color Supplement volume.
There are many different approaches to illustrate virtual to physical memory mapping on systems with paging like Windows. Here is another approach that uses natural memory visualization (Volume 1, page 532). An image of a user process was generated and juxtaposed to an image of kernel memory dump generated afterwards to produce the combined picture of the full virtual space. Of course, uncommited regions were not included in it as they were not present in user and kernel dumps. Then, after reboot, the same application was launched again and an image of a complete memory dump was generated. Finally, both images were juxtaposed to produce this approximate picture:

In the virtual memory space to the left we see much more granularity. On the contrary, the physical memory space to the right is more uniform and has a different coloring.
If you attended Fundamentals of Complete Crash and Hang Memory Dump Analysis Webinar[73] you probably remember the memory dump visualization question that we repeat here on this slide fragment:
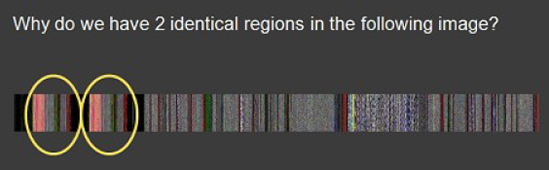
We got a few responses:
"Unfortunately they are not identical - visual inspection shows that. I tried differencing the relevant sub-images in Photoshop and I can't get zero. Of course this can be due to compression artifacts and, more likely, the fact that the duplication is not required to be aligned to the borders. A stronger confirmation/refutation would require unrolling the bitmap to one dimension and sliding it back and forth until maximum correlation is found. Since I have not done the examples step by step, I am left guessing about just what the dump you show illustrates. An aliased memory mapped area is my first guess, and a flip/flop garbage collector is my second."
"Perhaps some module such as a .NET assembly is getting loaded twice in a .NET app, pre .NET 4."
Initially we also thought that there was the same module loaded twice from different location like in Duplicated Module pattern (Volume 2, page 294). Unfortunately, lm command didn't show any duplicated loaded and unloaded modules as well as any hidden modules (Volume 2, page 339). We looked at address information and found two identical relatively large regions at the beginning:
0:000> !address [...] BaseAddress EndAddress+1 RegionSize Type State Protect Usage [...] 0`00470000 0`007f00000`00380000MEM_MAPPED MEM_COMMIT PAGE_READONLY <unclassified> [...] 0`01f10000 0`022900000`00380000MEM_MAPPED MEM_COMMIT PAGE_READONLY <unclassified> [...]
The image above was scaled by ImageMagic from a bitmap generated by Dump2Picture (Volume 1, page 532):
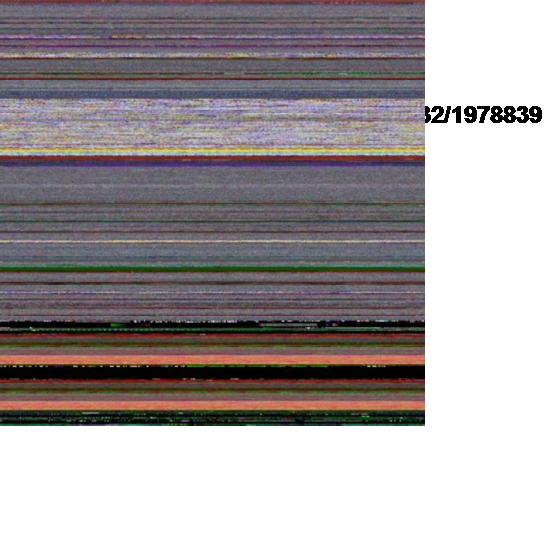
The original image from Dump2Picture had different colors:

We quickly checked the colorimetric structure of those regions: 0`00470000 0`007f0000 and 0`01f10000 0`02290000 using MemPicture WinDbg script (Volume 1, page 556) and they seem to conform with the magnified picture above:
0:000> $$>a< d:Dump2Picturemempicture.txt 0`00470000 L?0`007f0000-
0`00470000
Writing 380000 bytes

C:Program FilesDebugging Tools for Windows (x64)>dump2picture d2p-
range.bin d2p-range.bmp

Dump2Picture version 1.1
Written by Dmitry Vostokov, 2007

d2p-range.bmp
d2p-range.bin
        1 file(s) copied.

C:Program FilesDebugging Tools for Windows (x64)>d2p-range.bmp
.shell: Process exited

Here is the magnified slice from the original picture:
We see the same partitioning if we juxtapose the original picture and the picture of the address region:

Also these regions are completely identical if we compare their data:
0:000> c 0`00470000 L?(0`007f0000-0`00470000)/8 0`01f10000
Therefore, it looks like some file was mapped twice. Inspected via dc command it shows remarkable regularity not seen in executable modules. This regularity also mani-fests itself in color:

In order to verify our hypothesis we modeled it by writing a simple program that maps a file twice passed as a command line parameter:
int _tmain(int argc, _TCHAR* argv[])
{
   if (argc < 2)
   {
      puts("Usage: MappedFiles.exe <File_Name_To_Map>
");
      return -1;
   }

   HANDLE hf = CreateFile(argv[1], GENERIC_READ, FILE_SHARE_READ, NULL,
                           OPEN_EXISTING, FILE_ATTRIBUTE_NORMAL, NULL);
   HANDLE hm = CreateFileMapping(hf, NULL, PAGE_READONLY, 0, 0, NULL);
   MapViewOfFile(hm, FILE_MAP_READ, 0, 0, 0);
   hf = CreateFile(argv[1], GENERIC_READ, FILE_SHARE_READ, NULL,
                    OPEN_EXISTING, FILE_ATTRIBUTE_NORMAL, NULL);
   hm = CreateFileMapping(hf, NULL, PAGE_READONLY, 0, 0, NULL);
   MapViewOfFile(hm, FILE_MAP_READ, 0, 0, 0);
   DebugBreak();
   return 0;
}
I executed it and chose to map explorer.exe because it was a sufficiently large image file:
C:MappedFilesRelease>MappedFiles.exe c:windowsexplorer.exe
The dump file was saved and its processing shows this picture:

We clearly see identical regions and double check them from the dump file:
0:000> !address BaseAddr EndAddr+1 RgnSize Type State Protect Usage [...] a60000 d1d0002bd000MEM_MAPPED MEM_COMMIT PAGE_READONLY <unclassified> d1d000 d20000 3000 MEM_FREE PAGE_NOACCESS Free d20000 fdd0002bd000MEM_MAPPED MEM_COMMIT PAGE_READONLY <unclassified> [...]
0:000> $$>a< d:Dump2Picturemempicture.txt 0`00470000 L?0`007f0000-
0`00470000
Writing 380000 bytes

C:Program FilesDebugging Tools for Windows (x64)>dump2picture d2p-
range.bin d2p-range.bmp

Dump2Picture version 1.1
Written by Dmitry Vostokov, 2007

d2p-range.bmp
d2p-range.bin
        1 file(s) copied.

C:Program FilesDebugging Tools for Windows (x64)>d2p-range.bmp
.shell: Process exited

We see the same partitioning if we juxtapose results:

The application can be downloaded from here:
http://www.dumpanalysis.org/downloads/MappedFiles.zip
[62] http://technet.microsoft.com/en-us/sysinternals/dd535533.aspx
[63] http://j00ru.vexillium.org/?p=269&lang=en
[64] http://www.saygoodnight.com/?p=9
[65] http://blogs.msdn.com/tess/archive/2009/04/23/show-me-the-memory-tool-for-visualizing-virtual-memory-usage-and-gc-heap-usage.aspx
[66] http://www.dumpanalysis.org/blog/index.php/2007/08/04/visualizing-memory-dumps/
[67] http://ad.sigsegv.pl/dumbgallery/
[68] http://www.dumpanalysis.org/blog/index.php/2009/07/13/advanced-memory-visualization-part-1/
[69] http://www.dumpanalysis.org/blog/index.php/2009/07/19/3d-memory-visualization/
[70] http://www.dumpanalysis.org/blog/index.php/2007/08/15/picturing-computer-memory/
[71] http://seductivelogic.blogspot.com/
[72] http://www.dumpanalysis.org/downloads/DumpFilter.zip
[73] http://www.dumpanalysis.com/FCMDA-materials