
When looking at software traces and doing either a search for or just scrolling certain messages grab attention immediately. We call them Significant Events. It could be a recorded exception (Volume 4, page 337) or an error, a basic fact (Volume 3, page 345), a trace message from vocabulary index (Volume 4, page 349), or just any trace state-ment that marks the start of some activity we want to explore in depth, for example, a certain DLL is attached to the process, a coupled process is started or a function is called. The start of a trace and the end of it are trivial significant events and are used in deciding whether the trace is circular (Volume 3, page 346), in determining the trace recording interval or its average statement current (Volume 4, page 335).
This is a time interval between significant events (page 281). For example,
# Module PID TID Time File Function Message 1 10:06:18.994 (Start) [...] 6060 dllA 1604 7108 10:06:21.746 fileA.c DllMain DLL_PROCESS_ATTACH [...] 24480 dllA 1604 7108 10:06:32.262 fileA.c Exec Path: C:Program FilesCompanyAappB.exe [...] 24550 dllB 1604 9588 10:362 fileB.c PostMsg Event Q [...] 28230 10:06:32.170 (End)07:05.
Such deltas are useful in examining delays. In the trace fragment above we are interested in dllA activity from its load until it launches appB.exe. We see that the time delta was only 10 seconds. The message #24550 was the last message from the process ID 1604 and after that we didn't "hear" from that PID for more than 30 seconds until the tracing was stopped.
This is an extension of Thread of Activity pattern (Volume 4, page 339) based on the concept of multibraiding (Volume 4, page 330). See also an article published in De-bugged! MZ/PE magazine[50].
Sometimes we have a sequence of Activity Regions (Volume 4, page 348) with increasing values of Statement Current (Volume 4, page 335), like depicted here:

The boundaries of regions may be blurry and arbitrarily drawn. Nevertheless, the current is visibly increasing or decreasing, hence the name of this pattern by analogy with physical acceleration, a second-order derivative. We can also metaphorically use here the notion of a partial derivative for trace statement current and acceleration for Threads of Activity (Volume 4, page 339) and Adjoint Threads of Activity (page 283) but whether it is useful remains to be seen.
Typical software narrative history consists of requests and responses, for example, function or object method calls and returns:
#     Module PID  TID  Time         File    Function Message
[...]
26060 dllA   1604 7108 10:06:21.746 fileA.c foo      Calling bar
[...]
26232 dllA   1604 7108 10:06:22.262 fileA.c foo      bar returns 0x5
[...]
The code that generates execution history is response-complete if it traces both requests and responses. For such code (except in cases where tracing is stopped be-fore a response) the absence of expected responses could be a sign of blocked threads or quiet exception processing. The code that generates execution history is exception-complete if it also traces exception processing. Response-complete and exception-complete code is called call-complete. If we don't see response messages for call-complete code we have Incomplete History.
In general, we can talk about the absence of certain messages in a trace as a deviation from the standard trace sequence template corresponding to a use case. The difference there is in a missing request too.
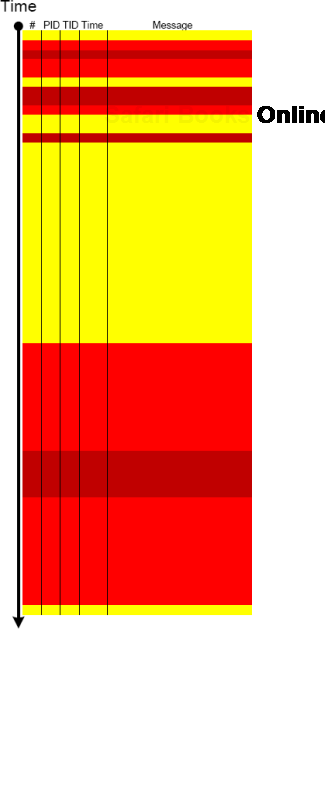
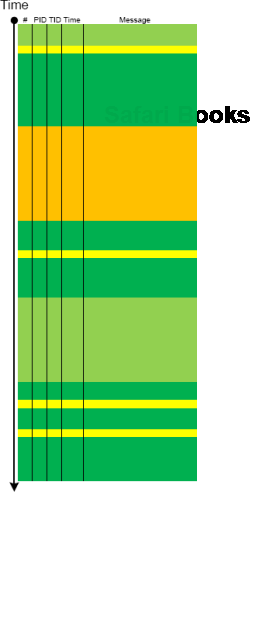
Metaphorical bijection (Volume 4, page 241) from literary narratology to software narratology (Volume 3, page 342) provides a pattern of Background and Foreground Components. This can be easily illustrated on pseudo-trace color diagrams. Suppose we troubleshoot a graphical issue using an ETW trace containing the output from all components of the problem system. Graphic components and their messages are foreground for a trace viewer (a person) against numerous background components (for example, database, file and registry access, shown in shades of green or light grey colors in print B/W edition):

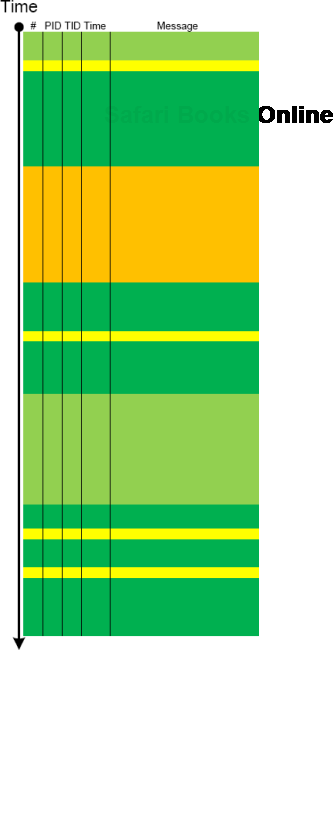
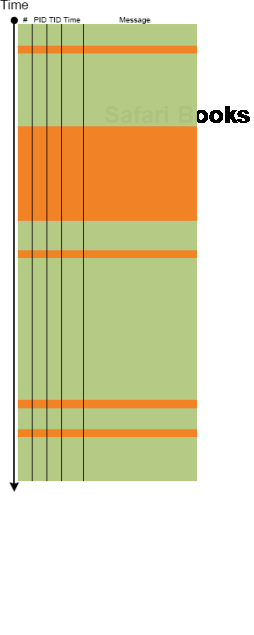
Trace viewers (for example, CDFAnalyzer, Volume 4, page 327) can filter out background component messages and present only foreground components (that I propose to call component foregrounding):
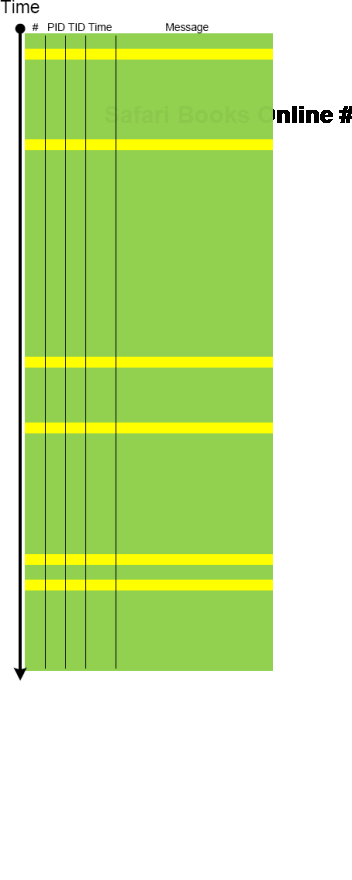
Of cource, this process is iterative and parts of what once was foreground be-come background and candidate for further filtering:

"Capturing delicate moments, one gives birth to a poetry of traces..."
Ange Leccia, Motionless Journeys[51], by Fabien Danesi
In this pattern from software narratology (Volume 3, page 342) see sudden unfamiliar trace statements across familiar landscape of characteristic blocks (Volume 4, page 345) and activity regions (Volume 4, page 348).
Example of a familar trace:
Example of the new trace from a problem system:

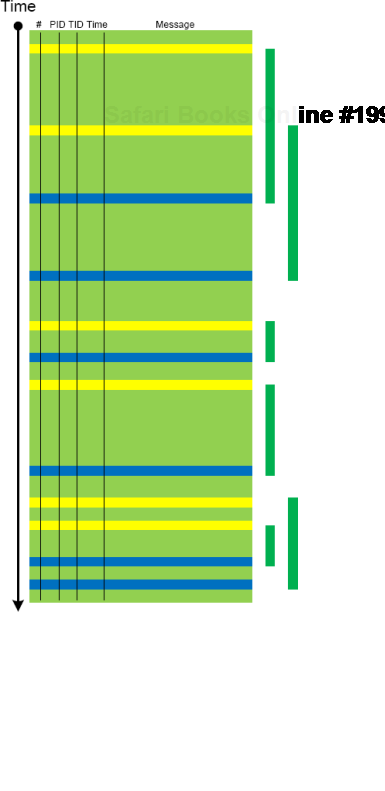
When a software trace is lengthy it is useful to partition it into several regions based on a sequence of Anchor Messages. The choice of them can be determined by a Vocabulary Index (Volume 4, page 349) or an Adjoint Thread of Activity (page 283). For example, an ETW trace with almost 900,000 messages recorded during a desktop connection for 6 minutes can be split into 14 segments by the adjoint thread of DLL_PROCESS_ATTACH message (the message was generated by DllMain of an injected module, not shown in the trace output for formatting clarity):
#      PID  TID  Time         Message
24226  2656 3480 10:41:05.774 AppA.exe: DLL_PROCESS_ATTACH
108813 4288 4072 10:41:05.774 AppB.exe: DLL_PROCESS_ATTACH
112246 4180 3836 10:41:05.940 DllHost.exe: DLL_PROCESS_ATTACH
135473 2040 3296 10:41:12.615 AppC.exe: DLL_PROCESS_ATTACH
694723 1112 1992 10:44:23.393 AppD.exe: DLL_PROCESS_ATTACH
703962 5020 1080 10:44:42.014 DllHost.exe: DLL_PROCESS_ATTACH
705511 4680 3564 10:44:42.197 DllHost.exe: DLL_PROCESS_ATTACH
705891 1528 2592 10:44:42.307 regedit.exe: DLL_PROCESS_ATTACH
785231 2992 4912 10:45:26.516 AppE.exe: DLL_PROCESS_ATTACH
786523 3984 1156 10:45:26.605 powershell.exe: DLL_PROCESS_ATTACH
817979 4188 4336 10:45:48.707 wermgr.exe: DLL_PROCESS_ATTACH
834875 3976 1512 10:45:52.342 LogonUI.exe: DLL_PROCESS_ATTACH
835229 4116 3540 10:45:52.420 AppG.exe: DLL_PROCESS_ATTACH
Each region can be analyzed independently for any anomalies, for example, to look for the answer to a question why wermgr.exe was launched. An example of partitioning is illustrated on the following schematic diagram:
It is also possible to make different trace segmentation by interleaving regions above with another set of anchor messages comprising of the adjoint thread of DLL_PROCESS_DETACH message:
This pattern is similar to No Component Symbols (Volume 1, page 298) memory analysis pattern:
# Module PID TID Time Message 21372 srcdllA 2968 5476 3:55:10.004 Calling foo() 21373Unknown2968 5476 3:55:10.004????? Unknown( 27): GUID=1EF56EBD- A7FC-4892-8DBA-00AD813F8A24 (No Format Information found).21374Unknown2968 5476 3:55:10.004????? Unknown( 27): GUID=1EF56EBD- A7FC-4892-8DBA-00AD813F8A24 (No Format Information found).21375Unknown2968 5476 3:55:10.004????? Unknown( 27): GUID=1EF56EBD- A7FC-4892-8DBA-00AD813F8A24 (No Format Information found).21376Unknown2968 5476 3:55:10.004 ?????Unknown( 28): GUID=1EF56EBD- A7FC-4892-8DBA-00AD813F8A24 (No Format Information found).21377Unknown2968 5476 3:55:10.004????? Unknown( 23): GUID=1EF56EBD- A7FC-4892-8DBA-00AD813F8A24 (No Format Information found).21378 srcdllA 2968 5476 3:55:10.004 Calling bar()
In some case when we don't have TMF files it is possible to detect broad behavioral patterns such as:
Circular Trace (Volume 3, page 346)
Statement Density and Current (Volume 4, page 335)
Discontinuity (Volume 4, page 341)
Time Delta (page 282)
Trace Acceleration (page 284)
By looking at Thread of Activity (Volume 4, page 339) we can sometimes also infer the possible component name based on surrounding trace messages with present TMF files, escpecially when we have source code access. For example, in the trace above it can be dllA or any other module that foo function calls.
This is the limit of Discontinuity pattern (Volume 4, page 341). The absence of activity can be seen at a thread level or at a process level where it is similar to Missing Component pattern (Volume 3, page 342). The difference from the latter pattern is that we know for certain that we selected our process modules for tracing but don't see any trace messages. Consider this example:
#  Source        PID  TID  Time         Function     Message
1  TraceSettings 1480 8692 08:04:20.682              **** Start Trace Session
[... TraceSettings messages 2-11 show that we selected AppA for tracing ...]
12 ModuleB       3124 4816 08:04:37.049 WorkerThread Worker thread running
13 TraceSettings 1480 8692 08:04:41.966              **** Trace Session was stopped
Only modules from AppA process and modules from a coupled process (for example, ModuleB) were selected. However, we only see a reminder message from the coupled process (3124.4816:ModuleB!WorkerThread) and no messages for 21 seconds. Fortunately, AppA process memory dump was saved during the tracing session:
Debug session time: Fri May 21 08:04:31.000 2010 (GMT+0)
We see 2 threads waiting for a critical section:
0:000> ×*kL

  14  Id: 640.8b8 Suspend: 1 Teb: 7ffa7000 Unfrozen
ChildEBP RetAddr
0248f8c0 7c827d29 ntdll!KiFastSystemCallRet
0248f8c4 7c83d266 ntdll!ZwWaitForSingleObject+0xc
0248f900 7c83d2b1 ntdll!RtlpWaitOnCriticalSection+0x1a3
0248f920 0040dea8 ntdll!RtlEnterCriticalSection+0xa8
[...]
0248f9a4 77ce78aa rpcrt4!Invoke+0×30
0248f9c0 77ce7a94 rpcrt4!NdrCallServerManager+0×17
0248fcb8 77ce7b7c rpcrt4!NdrStubCall+0×1d6
0248fcd0 77c7ff7a rpcrt4!NdrServerCall+0×15
0248fd04 77c8042d rpcrt4!DispatchToStubInCNoAvrf+0×38
0248fd58 77c80353 rpcrt4!RPC_INTERFACE::DispatchToStubWorker+0×11f
0248fd7c 77c7e0d4 rpcrt4!RPC_INTERFACE::DispatchToStub+0xa3
0248fdbc 77c7e080 rpcrt4!RPC_INTERFACE::DispatchToStubWithObject+0xc0
0248fdfc 77c812f0 rpcrt4!LRPC_SCALL::DealWithRequestMessage+0×41e
0248fe20 77c88678 rpcrt4!LRPC_ADDRESS::DealWithLRPCRequest+0×127
0248ff84 77c88792 rpcrt4!LRPC_ADDRESS::ReceiveLotsaCalls+0×430
0248ff8c 77c8872d rpcrt4!RecvLotsaCallsWrapper+0xd
0248ffac 77c7b110 rpcrt4!BaseCachedThreadRoutine+0×9d
  15  Id: 640.18c0 Suspend: 1 Teb: 7ffdb000 Unfrozen
ChildEBP RetAddr
01b8ff40 7c827d29 ntdll!KiFastSystemCallRet
01b8ff44 7c83d266 ntdll!ZwWaitForSingleObject+0xc
01b8ff80 7c83d2b1 ntdll!RtlpWaitOnCriticalSection+0x1a3
01b8ffa0 0040dba7 ntdll!RtlEnterCriticalSection+0xa8
[...]
01b8ffec 00000000 kernel32!BaseThreadStart+0×34
Unfortunately, it belongs to a missing thread and blocked threads wait forever:
0:000> !cs -l -o -s ----------------------------------------- DebugInfo = 0x01facdd0 Critical section = 0x01da19c0 (+0x1DA19C0) LOCKEDLockCount = 0×2WaiterWoken = NoOwningThread = 0×00001384RecursionCount = 0×1 LockSemaphore = 0×578 SpinCount = 0×00000000 ntdll!RtlpStackTraceDataBase is NULL. Probably the stack traces are not enabled 0:000> ××[1384] ^Illegal thread error in '××[1384]'
Apparently, AppA process was hanging and it explains why we don't see any activity in the trace. We suggested enabling user mode stack trace database using this article as an example: CTX106970[52] and get a new dump.
Here we introduce a software narratological partitioning of a trace into Head, Prologue, Core, Epilogue and Tail segments. This is useful for comparative software trace analysis. Suppose, a trace started just before the reproduction steps or a start marker was in-jected (by CDFMarker, page 276, for example) and finished just after the last repro steps or after an end marker was injected. Then its core trace messages are surrounded by prologue and epilogue statements. What is before and after are not necessary for analysis and usually distract an analyst. They are shown as grey areas on the following picture where the left trace is for working (non-working) scenario and the right trace is for non-working (working) scenario:
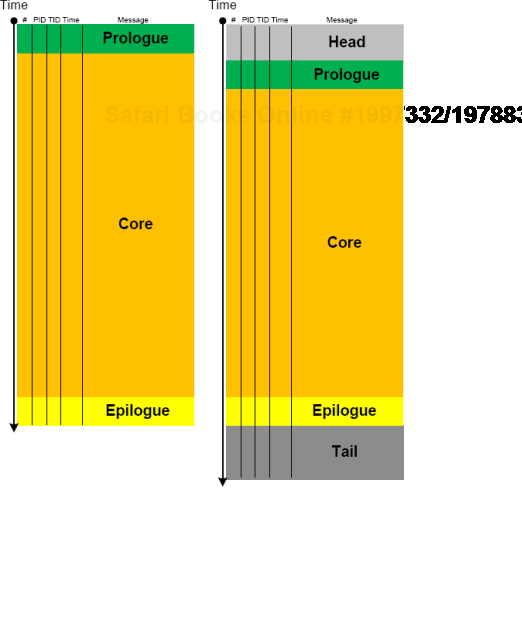
The size of a core segment need not be the same because environments and exe-cuted code paths might be different. However, often some traces are truncated. Also sometimes it is difficult to establish whether the first trace is normal and the sec-ond has a tail or the first one is truncated and the second one is normal with an optional tail. Here artificial markers are important.
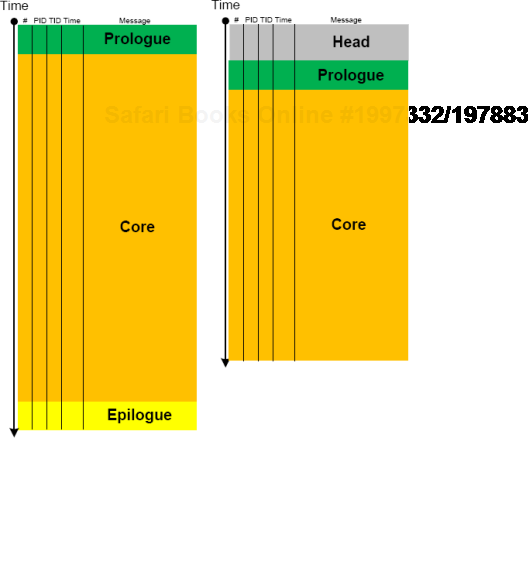
Sometimes a software trace is truncated when the trace session was stopped prematurely, often when a problem didn't manifest itself visually. We can diagnose such traces by their short time duration, missing anchor messages (page 293) or components (Volume 4, page 342) necessary for analysis. My favourite example is user session initialization in a Citrix terminal services environment when problem effects are visible only after the session is fully initialized and an application is launched but a truncated CDF trace only shows the launch of winlogon.exe despite the presence of a process creation trace provider or other components that record the process launch sequence (Volume 2, page 387) and the trace itself lasts only a few seconds after that.
Like in literature (and in narratology in general) we have components that trace them-selves and components that tell the story of a computation including status updates they query from other components and subsystems. This pattern gets its name from diegesis[53]. Here's the difference between diegetic (in bold) and non-diegetic trace messages:
PID    TID    TIME          MESSAGE
11864  11912  06:34:53.598  ModuleA: foo called bar. Status OK.
11620  10372  06:34:59.754  ModuleB: ModuleA integrity check. Status OK.
Some modules may emit messages that tell about their status but from their message text we know the larger computation story like in a process startup sequence example (Volume 2, page 387).
We often see such errors in software traces recorded during deviant software behavior (often called non-working software traces) and when we double check their presence in normal expected software behavior traces (often called working traces) we find them there too. We already mentioned similar false positives when we introduced the first software trace analysis pattern called Periodic Error (Volume 3, page 344). Here is an example from the real trace. In a non-working trace we found this error in an adjoint thread (page 283) of a foreground component (page 287):
OpenProcess error 5
However, we found the same error in the working trace, continued looking and found several other errors:
Message request report: last error 1168, ...
[...]
GetMsg result -2146435043
The last one is 8010001D if converted to a hex status, but, unfortunately, the same errors were present in the working trace too in the same activity regions (Volume 4, page 348).
After that we started comparing both traces looking for a bifurcation point (Volume 4, page 343) and we found the error that was only present in a non-working trace with significant trace differences after that:
Error reading from the named pipe: 800700E9
My favourite tool (WinDbg) to convert error and status values gave this description:
0:000> !error 800700E9
Error code: (HRESULT) 0x800700e9 (2147942633) - No process is on the other
end of the pipe.
Sometimes, when comparing normal, expected (working) and abnormal (non-working) traces we can get a clue for further troubleshooting and debugging by looking at mod-ule load events. For example, when we see an unexpected module loaded in our non-working trace, its function (and sometimes even module name) can signify some differ-ence to pay attention to:
#    PID TID Time         Message
[...]
4492 908 912 11:06:41.953 LoadImageEvent:ImageName(WINDOWSsystem323rdPartySso.dll)
[...]
We call this pattern Guest Component and it is different from Missing Component (Volume 4, page 342). Although in the latter pattern a missing component in one trace may appear in another but the component name is known apriori and expected. In the former pattern the component is unexpected. For example, in the trace above, its partial name fragment "Sso" may trigger a suggestion to relate differences in authentication where in a non-working case SSO (single sign-on) was configured.
Sometimes, when we find an anchor message (page 293) related to our problem description (for example, a COM port error) we are interested in its evolution through-out a software narrative:
# PID TID Message [...] 126303 5768 1272 OpenComPort returns Status = 0x0 [...] 231610 3464 1576 OpenComPort returns Status = 0x0 [...]336535 5768 4292 OpenComPort returns Status = 0×0[...][...] 531247 5768 5492 OpenComPort returns Status = 0xc000000f [...] 639039 772 3404 OpenComPort returns Status = 0xc000000f [...]423508 5252 2544 OpenComPort returns Status = 0xc000000f
Then we can check activity between changes.
This pattern name was borrowed from historiography. This periodization[54] of software trace messages includes individual messages, then aggregated messages from threads, then processes as wholes and finally individual computers (in client-server or similar sense). This is best illustrated graphically.
Message layer:

Thread layer (different colors correspond to different TID):
Process layer (different colors correspond to different PID):
Please note that it is also possible to have a periodization based on modules, functions and individual messages but it might be complicated because different threads can enter the same module or function. Here other patterns are more appropriate like Activity Region (Volume 4, page 348), Characteristic Message Block (Volume 4, page 345), and Background and Foreground Components (page 287).