
Here we resume previously introduced memory analysis succession patterns series (Volume 4, page 93). We introduce a case study where Wait Chains (executive resources, Volume 2, page 147) and Swarm of Shared Locks (Volume 3, page 107) were probably resulted from Spiking Thread (Volume 1, page 305). We have these resource locks:
0: kd> !locks
**** DUMP OF ALL RESOURCE OBJECTS ****
Resource @ 0x808a6860 Shared 9 owning threads
Threads: 8e739b40-01<*> 8e07db58-01<*> 8e455d18-01<*> 8df72958-01<*>
8e356620-01<*> 8d7e9700-01<*> 8e73a660-01<*> 8dbb0af0-01<*>
8e01c9b8-01<*>
Resource @ 0xf7b6d5b0 Shared 2 owning threads
Contention Count = 1
Threads: 8e741898-01<*> 8e73fb40-01<*>
Resource @ 0x8e5a1534 Shared 12 owning threads
Contention Count = 76
NumberOfSharedWaiters = 7
NumberOfExclusiveWaiters = 1
Threads: 8e73fb40-01 8d80fc70 -01<*> 8dc226c0-01<*> 8dc84db0-01<*>
8e416458-01<*> 8dbf1630-01<*> 8e740db0-01<*> 8d7e9700-01<*>
8d818420-01<*> 8e7413b8-01<*> 8e739020-01 8d80ac70-01<*>
8e30ec88-01<*> 8e7408d0-01 8dd022a8-01 8e59a2f8-01
8dc4d300-01 8dc36278-01<*> 8e060078-01
Threads Waiting On Exclusive Access:
8d818870
Resource @ 0x8e5a1368 Shared 3 owning threads
Contention Count = 132
NumberOfExclusiveWaiters = 9
Threads: 8d7c5370-01<*> 8e416458-01<*> 8e72f4808dbe0388 8e7413b8
8e741898
Resource @ 0x8e74a3b0 Exclusively owned
Contention Count = 11
NumberOfSharedWaiters = 2
NumberOfExclusiveWaiters = 1
Threads: 8dbe0388-01<*> 8e73e660-01 8e740020-01
Threads Waiting On Exclusive Access:
8d80fc70
Resource @ 0x8e54f810 Exclusively owned
Contention Count = 118
NumberOfSharedWaiters = 1
NumberOfExclusiveWaiters = 2
Threads: 8e72f480Resource @ 0x8e3a03e0 Exclusively owned
Contention Count = 4
NumberOfSharedWaiters = 1
NumberOfExclusiveWaiters = 1
Threads: 8dbe0388-01<*> 8e740660-01
Threads Waiting On Exclusive Access:
8e30ec88
Resource @ 0x8e33d6a8 Exclusively owned
Contention Count = 1
Threads: 8dc36278-01<*>
Resource @ 0x8e33d640 Exclusively owned
Contention Count = 1
Threads: 8dc36278-01<*>
Resource @ 0x8e17f890 Exclusively owned
Contention Count = 2
NumberOfExclusiveWaiters = 1
Threads: 8dc84db0-01<*>
Threads Waiting On Exclusive Access:
8e740db0
Resource @ 0x8e17f828 Exclusively owned
Threads: 8dc84db0-01<*>
Resource @ 0x8e09fc40 Exclusively owned
Contention Count = 3
NumberOfSharedWaiters = 2
Threads: 8e416458-01<*> 8e076770-01 8dbf5b70-01
Resource @ 0x8e09fbd8 Exclusively owned
Threads: 8e416458-01<*>
Resource @ 0x8df021a0 Exclusively owned
Threads: 8d7e9700-01<*>
Resource @ 0x8dffce50 Exclusively owned
Contention Count = 2
NumberOfExclusiveWaiters = 1
Threads: 8dbf1630-01<*>
Threads Waiting On Exclusive Access:
8dc226c0
Resource @ 0x8df147f8 Exclusively owned
Contention Count = 4
NumberOfSharedWaiters = 1
Threads: 8dbf1630-01<*> 8e7403f0-01
Resource @ 0x8e599de8 Exclusively owned
Threads: 8d7c5370-01<*>
Resource @ 0x8e324ee8    Shared 1 owning threads
    Contention Count = 1
     Threads: 8d7c5370-01<*>

Resource @ 0x8e21bc60    Exclusively owned
     Threads: 8dbe0388-01<*>

Resource @ 0x8e446f18    Exclusively owned
     Threads: 8d80fc70-01<*>

Resource @ 0x8df65570    Shared 1 owning threads
    Contention Count = 3
     Threads: 8dc5f698-01<*>

Resource @ 0x8e085100    Exclusively owned
    Contention Count = 1
     Threads: 8e73e8d0-01<*>

Resource @ 0x8dbe51b8    Exclusively owned
     Threads: 8dbe0388-01<*>

Resource @ 0x8df458c8    Exclusively owned
    Contention Count = 1
    NumberOfExclusiveWaiters = 1
     Threads: 8d80ac70-01<*>
     Threads Waiting On Exclusive Access:
              8d818420

Resource @ 0x8dfb9168    Shared 2 owning threads
     Threads: 8e7413b8-01<*> 8d862630-01<*>

Resource @ 0x8dfb9128    Exclusively owned
    Contention Count = 1
     Threads: 8e7413b8-01<*>

Resource @ 0x8df86150    Shared 1 owning threads
     Threads: 8dba25d8-01<*>

Resource @ 0x8df86110    Exclusively owned
     Threads: 8e741b08-01<*>

Resource @ 0x8e3f17d0    Shared 1 owning threads
     Threads: 8dc84db0-01<*>

Resource @ 0x8dc9c008    Exclusively owned
     Threads: 8e72f480 -01<*>

Resource @ 0x8dc9c1a8     Shared 1 owning threads
     Threads: 8e72f480 -01<*>
Resource @ 0x8e3ec7a0    Shared 1 owning threads
     Threads: 8e7413b8-01<*>

Resource @ 0x8d85a218    Exclusively owned
     Threads: 8d80fc70-01<*>

Resource @ 0x8e2d1988    Shared 1 owning threads
     Threads: 8d7c5370-01<*>

Resource @ 0x8e3f1ac0    Shared 1 owning threads
     Threads: 8e416458-01<*>

Resource @ 0x8dc11798    Exclusively owned
    Contention Count = 1
     Threads: 8e73f8d0-01<*>

Resource @ 0x8dc93298    Exclusively owned
     Threads: 8e73f8d0-01<*>

Resource @ 0x8e2bb198    Shared 1 owning threads
    Contention Count = 1
     Threads: 8d80ac70-01<*>

Resource @ 0x8e06e6f8    Shared 1 owning threads
     Threads: 8e72f480 -01<*>

4346 total locks, 47 locks currently held
We don't see High Contention (executive resources, Volume 1, page 421) pattern. What we actually see is a runaway system thread:
0: kd> !running

System Processors f (affinity mask)
  Idle Processors d

Prcbs  Current   Next
  1    f772f120  8e72f480            ................
0: kd> !thread8e72f480THREAD 8e72f480 Cid 0004.00e4 Teb: 00000000 Win32Thread: 00000000RUNNING on processor 1Not impersonating DeviceMap d66018c0 Owning Process 8e7437a8 Image: System Attached Process N/A Image: N/A Wait Start TickCount 78418 Ticks: 919192 (0:03:59:22.375) Context Switch Count 240 UserTime 00:00:00.000KernelTime 03:59:29.203Start Address 0×80848dbc Stack Init b2f94000 Current b2f93584 Base b2f94000 Limit b2f91000 Call 0 Priority 17 BasePriority 8 PriorityDecrement 0 ChildEBP RetAddr Args to Child [..] b2f93a14 f7b4dae0 8d802108 d78220d0 b2f93be8ModuleA!bar+0×2a0 b2f93c14 f7b527d0 8d802108 8e28d218 8e574860ModuleA!foo+0×1e27 [...] b2f93ddc 8088fa7e 80848dbc 00000000 00000000 nt!PspSystemThreadStartup+0×2e 00000000 00000000 00000000 00000000 00000000 nt!KiThreadStartup+0×16
We highlighted in bold italics this thread in the output of !locks command above. Many wait chains terminate at this thread (an example one is highlighted in bold above, 8d818870 -> 8d80fc70 -> 8dbe0388 -> 8e72f480). The stack trace collection shows ModuleA on top of stack traces of many threads (!stacks 0 ModuleA! filter command) but we don't include its output here.
Here we show an example of a wait chain involving process objects. This Wait Chain pattern (Volume 1, page 482) variation is similar to threads waiting for thread objects (Volume 3, page 92). When looking at stack trace collection (Volume 1, page 409) from a complete memory dump file we see that several threads in a set of processes are blocked in ALPC wait chain (Volume 3, page 97):
THREAD fffffa80110b8700  Cid 12f8.1328  Teb: 000000007ef9a000 Win32Thread:
0000000000000000 WAIT: (WrLpcReply) UserMode Non-Alertable
    fffffa80110b8a90  Semaphore Limit 0x1
Waiting for reply to ALPC Message fffff8801c7096e0 : queued at port
fffffa8010c9d9a0 : owned by process fffffa80109c8c10
Not impersonating
DeviceMap                 fffff880097ce5e0
Owning
Process            fffffa80110ad510       Image:         ProcessA.exe
Attached Process          N/A            Image:         N/A
Wait Start TickCount      14004580       Ticks: 62149 (0:00:16:09.530)
Context Switch Count      25100
UserTime                  00:00:00.421
KernelTime                00:00:00.218
Win32 Start Address 0×0000000074ca29e1
Stack Init fffffa6003bc4db0 Current fffffa6003bc4670
Base fffffa6003bc5000 Limit fffffa6003bbf000 Call 0
Priority 8 BasePriority 8 PriorityDecrement 0 IoPriority 2 PagePriority 5
Child-SP          RetAddr           Call Site
fffffa60`03bc46b0 fffff800`01cba0fa nt!KiSwapContext+0×7f
fffffa60`03bc47f0 fffff800`01caedab nt!KiSwapThread+0×13a
fffffa60`03bc4860 fffff800`01ce4e72 nt!KeWaitForSingleObject+0×2cb
fffffa60`03bc48f0 fffff800`01f32f34 nt!AlpcpSignalAndWait+0×92
fffffa60`03bc4980 fffff800`01f2f9c6 nt!AlpcpReceiveSynchronousReply+0×44
fffffa60`03bc49e0 fffff800`01f1f52f
nt!AlpcpProcessSynchronousRequest+0×24f
fffffa60`03bc4b00 fffff800`01cb7973 nt!NtAlpcSendWaitReceivePort+0×19f
fffffa60`03bc4bb0 00000000`7713756a nt!KiSystemServiceCopyEnd+0×13
(TrapFrame @ fffffa60`03bc4c20)
00000000`016ee5b8 00000000`74f9993f ntdll!ZwAlpcSendWaitReceivePort+0xa
00000000`016ee5c0 00000000`74f8a996 wow64!whNtAlpcSendWaitReceivePort+0×5f
00000000`016ee610 00000000`75183688 wow64!Wow64SystemServiceEx+0xca
00000000`016eeec0 00000000`74f8ab46 wow64cpu!ServiceNoTurbo+0×28
00000000`016eef50 00000000`74f8a14c wow64!RunCpuSimulation+0xa
00000000`016eef80 00000000`771605a8 wow64!Wow64LdrpInitialize+0×4b4
00000000`016ef4e0 00000000`771168de ntdll! ??
00000000`016ef590 00000000`00000000 ntdll!LdrInitializeThunk+0xe
1: kd> !alpc /m fffff8801c7096e0

Message @ fffff8801c7096e0
  MessageID             : 0x263C (9788)
  CallbackID            : 0x29F2A02 (43985410)
  SequenceNumber        : 0x000009FE (2558)
  Type                  : LPC_REQUEST
  DataLength            : 0x0058 (88)
  TotalLength           : 0x0080 (128)
  Canceled              : No
  Release               : No
  ReplyWaitReply        : No
  Continuation          : Yes
  OwnerPort             : fffffa8015128040
[ALPC_CLIENT_COMMUNICATION_PORT]
  WaitingThread         : fffffa80110b8700
  QueueType             : ALPC_MSGQUEUE_PENDING
  QueuePort             : fffffa8010c9d9a0 [ALPC_CONNECTION_PORT]
  QueuePortOwnerProcess : fffffa80109c8c10 (ProcessB.exe)
  ServerThread          : fffffa8013b87bb0
  QuotaCharged          : No
  CancelQueuePort       : 0000000000000000
  CancelSequencePort    : 0000000000000000
  CancelSequenceNumber  : 0×00000000 (0)
  ClientContext         : 0000000009b49208
  ServerContext         : 0000000000000000
  PortContext           : 000000000280f0d0
  CancelPortContext     : 0000000000000000
  SecurityData          : 0000000000000000
  View                  : 0000000000000000
If we look at a process fffffa80109c8c10 and its thread fffffa8013b87bb0 we would see that it is blocked on some kind of a lock as well:
THREAD fffffa8013b87bb0  Cid 0358.2c60  Teb: 000007fffff7e000 Win32Thread:
0000000000000000 WAIT: (UserRequest) UserMode Non-Alertable
    fffffa8010bca370  Semaphore Limit 0x7fffffff
    fffffa8013b87c68  NotificationTimer
Impersonation token:  fffff8801e614060 (Level Impersonation)
DeviceMap                 fffff880097ce5e0
Owning Process            fffffa80109c8c10       Image:         ProcessB.exe
Attached Process          N/A            Image:         N/A
Wait Start TickCount      14004580       Ticks: 62149 (0:00:16:09.530)
Context Switch Count      134
UserTime                  00:00:00.000
KernelTime                00:00:00.000
Win32 Start Address RPCRT4!ThreadStartRoutine (0x000007feff267780)
Stack Init fffffa6035a1fdb0 Current fffffa6035a1f940
Base fffffa6035a20000 Limit fffffa6035a1a000 Call 0
Priority 11 BasePriority 10 PriorityDecrement 0 IoPriority 2 PagePriority 5
Child-SP          RetAddr           Call Site
fffffa60`35a1f980 fffff800`01cba0fa nt!KiSwapContext+0x7f
fffffa60`35a1fac0 fffff800`01caedab nt!KiSwapThread+0x13a
fffffa60`35a1fb30 fffff800`01f1d608 nt!KeWaitForSingleObject+0x2cb
fffffa60`35a1fbc0 fffff800`01cb7973 nt!NtWaitForSingleObject+0x98
fffffa60`35a1fc20 00000000`77136d5a nt!KiSystemServiceCopyEnd+0x13 (TrapFrame @
fffffa60`35a1fc20)
00000000`0486ec28 00000000`770f559f ntdll!ZwWaitForSingleObject+0xa
00000000`0486ec30 00000000`ff77d4e9 ntdll!RtlAcquireResourceShared+0xd1
00000000`0486ec70 00000000`ff77fb4d ProcessB!CLock::CLock+0×61
[...]
00000000`0486eee0 000007fe`ff261f46 RPCRT4!Invoke+0×65
00000000`0486ef40 000007fe`ff26254d RPCRT4!NdrStubCall2+0×348
00000000`0486f520 000007fe`ff2868d4 RPCRT4!NdrServerCall2+0×1d
00000000`0486f550 000007fe`ff2869f0 RPCRT4!DispatchToStubInCNoAvrf+0×14
00000000`0486f580 000007fe`ff287402 RPCRT4!RPC_INTERFACE::DispatchToStubWorker+0×100
00000000`0486f670 000007fe`ff287080 RPCRT4!LRPC_SCALL::DispatchRequest+0×1c2
00000000`0486f6e0 000007fe`ff2862bb RPCRT4!LRPC_SCALL::HandleRequest+0×200
00000000`0486f800 000007fe`ff285e1a RPCRT4!LRPC_ADDRESS::ProcessIO+0×44a
00000000`0486f920 000007fe`ff267769 RPCRT4!LOADABLE_TRANSPORT::ProcessIOEvents+0×24a
00000000`0486f9d0 000007fe`ff267714 RPCRT4!ProcessIOEventsWrapper+0×9
00000000`0486fa00 000007fe`ff2677a4 RPCRT4!BaseCachedThreadRoutine+0×94
00000000`0486fa40 00000000`76fdbe3d RPCRT4!ThreadStartRoutine+0×24
00000000`0486fa70 00000000`77116a51 kernel32!BaseThreadInitThunk+0xd
00000000`0486faa0 00000000`00000000 ntdll!RtlUserThreadStart+0×1d
There are many such threads and inspection of all threads in the process fffffa80109c8c10 reveals another thread waiting for an ALPC reply:
THREAD fffffa8010c9b060  Cid 0358.02ac  Teb: 000007fffffd3000 Win32Thread:
0000000000000000 WAIT: (WrLpcReply) UserMode Non-Alertable
    fffffa8010c9b3f0  Semaphore Limit 0x1
    Waiting for reply to ALPC Message fffff88011994cf0 : queued at port
fffffa8010840360 : owned by process fffffa801083e120
Not impersonating
DeviceMap                 fffff880000073d0
Owning Process            fffffa80109c8c10       Image:         ProcessB.exe
Attached Process          N/A            Image:         N/A
Wait Start TickCount      13986969       Ticks: 79760 (0:00:20:44.263)
Context Switch Count      712
UserTime                  00:00:00.000
KernelTime                00:00:00.000
Win32 Start Address ntdll!TppWorkerThread (0×0000000077107cb0)
Stack Init fffffa6004bfbdb0 Current fffffa6004bfb670
Base fffffa6004bfc000 Limit fffffa6004bf6000 Call 0
Priority 10 BasePriority 10 PriorityDecrement 0 IoPriority 2 PagePriority 5
Kernel stack not resident.
Child-SP          RetAddr           Call Site
fffffa60`04bfb6b0 fffff800`01cba0fa nt!KiSwapContext+0×7f
fffffa60`04bfb7f0 fffff800`01caedab nt!KiSwapThread+0×13a
fffffa60`04bfb860 fffff800`01ce4e72 nt!KeWaitForSingleObject+0×2cb
fffffa60`04bfb8f0 fffff800`01f32f34 nt!AlpcpSignalAndWait+0×92
fffffa60`04bfb980 fffff800`01f2f9c6 nt!AlpcpReceiveSynchronousReply+0×44
fffffa60`04bfb9e0 fffff800`01f1f52f nt!AlpcpProcessSynchronousRequest+0×24f
fffffa60`04bfbb00 fffff800`01cb7973 nt!NtAlpcSendWaitReceivePort+0×19f
fffffa60`04bfbbb0 00000000`7713756a nt!KiSystemServiceCopyEnd+0×13 (TrapFrame @
fffffa60`04bfbc20)
00000000`00c3f2f8 00000000`771872c9 ntdll!ZwAlpcSendWaitReceivePort+0xa
[...]
00000000`00c3f810 00000000`77107fd0 ntdll!RtlpTpWorkCallback+0xf2
00000000`00c3f8c0 00000000`76fdbe3d ntdll!TppWorkerThread+0×3d6
00000000`00c3fb40 00000000`77116a51 kernel32!BaseThreadInitThunk+0xd
00000000`00c3fb70 00000000`00000000 ntdll!RtlUserThreadStart+0×1d
1: kd> !alpc /m fffff88011994cf0

Message @ fffff88011994cf0
  MessageID             : 0x033C (828)
  CallbackID            : 0x29CEF57 (43839319)
  SequenceNumber        : 0x000000D8 (216)
  Type                  : LPC_REQUEST
  DataLength            : 0x000C (12)
  TotalLength           : 0x0034 (52)
  Canceled              : No
  Release               : No
  ReplyWaitReply        : No
  Continuation          : Yes
  OwnerPort             : fffffa8010c99040
[ALPC_CLIENT_COMMUNICATION_PORT]
  WaitingThread         : fffffa8010c9b060
  QueueType             : ALPC_MSGQUEUE_PENDING
  QueuePort             : fffffa8010840360 [ALPC_CONNECTION_PORT]
  QueuePortOwnerProcess : fffffa801083e120 (ProcessC.exe)
  ServerThread          : fffffa80109837d0
  QuotaCharged          : No
  CancelQueuePort       : 0000000000000000
  CancelSequencePort    : 0000000000000000
  CancelSequenceNumber  : 0×00000000 (0)
  ClientContext         : 0000000000000000
  ServerContext         : 0000000000000000
  PortContext           : 00000000005f3400
  CancelPortContext     : 0000000000000000
  SecurityData          : 0000000000000000
  View                  : 0000000000000000
We see that ProcessC thread fffffa80109837d0 is waiting for a process object fffffa801434cb40:
THREAD fffffa80109837d0  Cid 027c.02b0  Teb: 000007fffffdb000 Win32Thread:
0000000000000000 WAIT: (UserRequest) UserMode Non-Alertable
    fffffa801434cb40  ProcessObject
Not impersonating
DeviceMap                 fffff880000073d0
Owning Process            fffffa801083e120       Image:         ProcessC.exe
Attached Process          N/A            Image:         N/A
Wait Start TickCount      13986969       Ticks: 79760 (0:00:20:44.263)
Context Switch Count      520
UserTime                  00:00:00.000
KernelTime                00:00:00.062
Win32 Start Address 0×000000004826dcf4
Stack Init fffffa6002547db0 Current fffffa6002547940
Base fffffa6002548000 Limit fffffa6002542000 Call 0
Priority 13 BasePriority 11 PriorityDecrement 0 IoPriority 2 PagePriority 5
Kernel stack not resident.
Child-SP          RetAddr           Call Site
fffffa60`02547980 fffff800`01cba0fa nt!KiSwapContext+0×7f
fffffa60`02547ac0 fffff800`01caedab nt!KiSwapThread+0×13a
fffffa60`02547b30 fffff800`01f1d608 nt!KeWaitForSingleObject+0×2cb
fffffa60`02547bc0 fffff800`01cb7973 nt!NtWaitForSingleObject+0×98
fffffa60`02547c20 00000000`77136d5a nt!KiSystemServiceCopyEnd+0×13 (TrapFrame @
fffffa60`02547c20)
00000000`0024f7c8 00000000`4826ea97 ntdll!ZwWaitForSingleObject+0xa
00000000`0024f7d0 00000000`4826ef44 ProcessC!TerminatePID+0xa3
[...]
00000000`0024fc90 00000000`00000000 ntdll!RtlUserThreadStart+0×29
When we inspect the process fffffa801434cb40 we see that it has only one thread with many usual threads missing (Volume 1, page 362). The blocked thread (Vol-ume 2, page 184) stack trace has DriverA module code waiting for an event:
1: kd> !process fffffa801434cb40 ff
PROCESS fffffa801434cb40
    SessionId: 1  Cid: a0c8    Peb: 7fffffdc000  ParentCid: 1c08
    DirBase: 19c6cc000  ObjectTable: fffff8801767ee00  HandleCount: 287.
    Image: ProcessD.exe
    VadRoot fffffa8021be17d0 Vads 71 Clone 0 Private 955. Modified 1245.
Locked 0.
    DeviceMap fffff880000073d0
    Token                              fffff880187cb3c0
    ElapsedTime                        00:49:23.432
    UserTime                           00:00:00.686
    KernelTime                         00:00:00.904
    QuotaPoolUsage[PagedPool]          208080
    QuotaPoolUsage[NonPagedPool]       6720
    Working Set Sizes (now,min,max)   (2620, 50, 345) (10480KB, 200KB,
1380KB)
    PeakWorkingSetSize                 3136
    VirtualSize                        101 Mb
    PeakVirtualSize                    222 Mb
    PageFaultCount                     13495
    MemoryPriority                     BACKGROUND
    BasePriority                       13
    CommitCharge                       1154

[...]
THREAD fffffa8012249b30  Cid a0c8.31b4  Teb: 0000000000000000 Win32Thread:
0000000000000000 WAIT: (Executive) KernelMode Non-Alertable
   fffffa801180a6a0  SynchronizationEvent
   Not impersonating
DeviceMap                 fffff880000073d0
Owning
Process            fffffa801434cb40       Image:         ProcessD.exe
Attached Process          N/A            Image:         N/A
Wait Start TickCount      13986969       Ticks: 79760 (0:00:20:44.263)
Context Switch Count      97
UserTime                  00:00:00.000
KernelTime                00:00:00.000
Win32 Start Address DllA (0xfffff96000eeada0)
Stack Init fffffa601b841db0 Current fffffa601b841960
Base fffffa601b842000 Limit fffffa601b83c000 Call 0
Priority 13 BasePriority 13 PriorityDecrement 0 IoPriority 2 PagePriority
5
Child-SP          RetAddr           Call Site
fffffa60`1b8419a0 fffff800`01cba0fa nt!KiSwapContext+0x7f
fffffa60`1b841ae0 fffff800`01caedab nt!KiSwapThread+0x13a
fffffa60`1b841b50 fffff960`00eeb281 nt!KeWaitForSingleObject+0x2cb
fffffa60`1b841c20 fffff800`01ec7bc7 DriverA+0×4b281
fffffa60`1b841d50 fffff800`01cf65a6 nt!PspSystemThreadStartup+0×57
fffffa60`1b841d80 00000000`00000000 nt!KiStartSystemThread+0×16
We therefore recommend contacting the vendor of DriverA component.
For certain stack traces we should always be aware of coincidental frames similar to Coincidental Symbolic Information pattern (Volume 1, page 390) for raw stack data. Such frames can lead to a wrong analysis conclusion. Consider this stack trace fragment from a kernel memory dump:
0: kd> kL 100 ChildEBPRetAddr9c5b6550 8082d9a4 nt!KeBugCheckEx+0×1b 9c5b6914 8088befa nt!KiDispatchException+0×3a2 9c5b697c8088beaent!CommonDispatchException+0×4a 9c5b699c80a6056dnt!KiExceptionExit+0×186 9c5b69a080893ae2hal!KeReleaseQueuedSpinLock+0×2d9c5b6a08 b20c3de5 nt!MiFreePoolPages+0×7dcWARNING: Stack unwind information not available. Following frames may be wrong. 9c5b6a48 b20c4107 DeriverA+0×17de5 [...]
The frame with MiFreePoolPages symbol might suggest some sort of a pool corruption. We can even double check return addresses and see the valid common sense assembly language code:
0: kd> ub8088beaent!KiExceptionExit+0×167: 8088be8f 33c9 xor ecx,ecx 8088be91 e81a000000 call nt!CommonDispatchException (8088beb0) 8088be96 33d2 xor edx,edx 8088be98 b901000000 mov ecx,1 8088be9d e80e000000 call nt!CommonDispatchException (8088beb0) 8088bea2 33d2 xor edx,edx 8088bea4 b902000000 mov ecx,2 8088bea9 e802000000 call nt!CommonDispatchException (8088beb0) 0: kd> ub80a6056dhal!KeReleaseQueuedSpinLock+0×1b: 80a6055b 7511 jne hal!KeReleaseQueuedSpinLock+0×2e (80a6056e) 80a6055d 50 push eax 80a6055e f00fb119 lock cmpxchg dword ptr [ecx],ebx 80a60562 58 pop eax 80a60563 7512 jne hal!KeReleaseQueuedSpinLock+0×37 (80a60577) 80a60565 5b pop ebx 80a60566 8aca mov cl,dl 80a60568 e8871e0000 call hal!KfLowerIrql (80a623f4)
0: kd> ub80893ae2nt!MiFreePoolPages+0×7c3: 80893ac9 761c jbe nt!MiFreePoolPages+0×7e1 (80893ae7) 80893acb ff75f8 push dword ptr [ebp-8] 80893ace ff7508 push dword ptr [ebp+8] 80893ad1 e87ea1fcff call nt!MiFreeNonPagedPool (8085dc54) 80893ad6 8a55ff mov dl,byte ptr [ebp-1] 80893ad9 6a0f push 0Fh 80893adb 59 pop ecx 80893adc ff1524118080 call dword ptr [nt!_imp_KeReleaseQueuedSpinLock (80801124)] 0: kd> ubDriverA+0×17dcf: b20c3dcf 51 push ecx b20c3dd0 ff5010 call dword ptr [eax+10h] b20c3dd3 eb10 jmp DriverA+0×17de5 (b20c3de5) b20c3dd5 8b5508 mov edx,dword ptr [ebp+8] b20c3dd8 52 push edx b20c3dd9 8d86a0000000 lea eax,[esi+0A0h] b20c3ddf 50 push eax b20c3de0 e8ebf1ffff call DriverA+0×16fd0 (b20c2fd0)b20c3de5
However, if we try to reconstruct the stack trace manually (Volume 1, page 157) we would naturally skip these 3 frames (shown in underlined bold):
9c5b6550 8082d9a4 nt!KeBugCheckEx+0x1b 9c5b6914 8088befa nt!KiDispatchException+0x3a2 9c5b697c 8088beae nt!CommonDispatchException+0x4a9c5b699c 80a6056d nt!KiExceptionExit+0×186 9c5b69a0 80893ae2 hal!KeReleaseQueuedSpinLock+0×2d 9c5b6a08 b20c3de5 nt!MiFreePoolPages+0×7dc9c5b6a48 b20c4107 DeriverA+0×17de5 [...] 0: kd> !thread THREAD 8f277020 Cid 081c.7298 Teb: 7ff11000 Win32Thread: 00000000 RUNNING on processor 0 IRP List: 8e234b60: (0006,0094) Flags: 00000000 Mdl: 00000000 Not impersonating DeviceMap e1002880 Owning Process 8fc78b80 Image: ProcessA.exe Attached Process N/A Image: N/A Wait Start TickCount 49046879 Ticks: 0 Context Switch Count 10 UserTime 00:00:00.000 KernelTime 00:00:00.000 Win32 Start Address DllA!ThreadA (0x7654dc90) Start Address kernel32!BaseThreadStartThunk (0x77e617dc) Stack Init 9c5b7000 Current 9c5b6c50Base 9c5b7000 Limit 9c5b4000Call 0 Priority 10 BasePriority 10 PriorityDecrement 0 ChildEBP RetAddr Args to Child [...]
0: kd> dds 9c5b4000 9c5b7000 9c5b4000 00000000 9c5b4004 00000000 9c5b4008 00000000 [...] 9c5b6290 ffdff13c9c5b6294 9c5b65509c5b6298 80827e01 nt!KeBugCheckEx+0×1b 9c5b629c 00000008 9c5b62a0 00000286 [...] 9c5b654c 000000009c5b6550 9c5b69149c5b6554 8082d9a4 nt!KiDispatchException+0×3a2 9c5b6558 0000008e 9c5b655c c0000005 [...] 9c5b6910 ffffffff9c5b6914 9c5b69849c5b69189c5b691c8088befa nt!CommonDispatchException+0×4a9c5b6920 00000000 [...]9c5b69309c5b6980 8088beae nt!KiExceptionExit+0×1869c5b6984 9c5b6a089c5b6988 b20c3032 DriverA+0×17032 9c5b698c badb0d00 9c5b6990 00000006 9c5b6994 8dc11cec 9c5b6998 808b6900 nt!KiTimerTableLock+0×3c0 9c5b699c 9c5b69d49c5b69a0 80a6056d hal!KeReleaseQueuedSpinLock+0×2d 9c5b69a4 80893ae2 nt!MiFreePoolPages+0×7dc9c5b69a8 808b0b40 nt!NonPagedPoolDescriptor 9c5b69ac 03151fd0 9c5b69b0 00000000 9c5b69b4 00000000 [...] 9c5b6a04 8f47123b9c5b6a08 9c5b6a489c5b6a0c b20c3de5 DriverA+0×17de5 9c5b6a10 8e3640a0 9c5b6a14 8f4710d0 [...] 9c5b6a44 000000009c5b6a48 9c5b6a809c5b6a4c b20c4107 DriverA+0×18107 9c5b6a50 8f4710d0 9c5b6a54 9c5b6a6c [...]
If we try to find a pointer to the exception record we get this crash address:
0: kd> .exr 9c5b6930
ExceptionAddress: b20c3032 (DriverA+0×00017032)If we disassemble it we see an inlined (Volume 2, page 322) string or memory copy, perhaps wcscpy function:
0: kd> uDriverA+0×17032:b20c3032b20c3034 8bcb mov ecx,ebx b20c3036 83e103 and ecx,3 b20c3039 f3a4 rep movs byte ptr es:[edi],byte ptr [esi] b20c303b 8b750c mov esi,dword ptr [ebp+0Ch] b20c303e 0fb7ca movzx ecx,dx b20c3041 894e14 mov dword ptr [esi+14h],ecx b20c3044 8b700c mov esi,dword ptr [eax+0Ch]b20c3032 f3a5 rep movs dword ptr es:[edi],dword ptr [esi]
So the problem happened in DriverA code, not in functions MiFreePoolPages or KeReleaseQueuedSpinLock.
In the case of multiple different faults like bugchecks and/or different crash points, stack traces and modules we can look at what is common among them. It could be their proc-ess context, which can easily be seen from the default analysis command:
1: kd> !analyze -v

[...]

PROCESS_NAME:  Application.exe
Then we can check whether an application is resource consumption intensive (could implicate hardware faults) like games and simulators or uses its own drivers (implicates latent corruption). In a production environment it can also be removed if it is functionally non-critical and can be avoided or replaced.
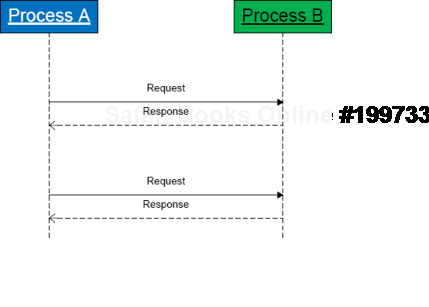
Previously introduced Coupled Processes (Volume 1, page 419) pattern involves an ac-tive request (or an action) and an active wait for a response (or the action status):
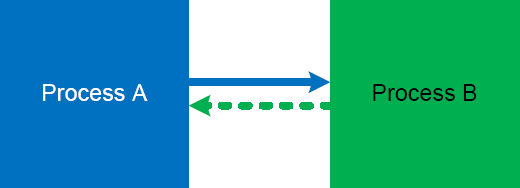
It is illustrated on this simple UML sequence diagram (process timeline represent collective request-response threads):
However, there is so called weak coupling when a process subscribes for notifications. Such threads most times are passive (Volume 1, page 430) and processes are not blocked:

The coupling manifests itself when notifier threads start spiking CPU and bring their share of CPU consumption to the notified threads:

Here is an example of such threads:
   5 Id: 61018.dbec Suspend: 1 Teb: 7ffae000 Unfrozen
ChildEBP RetAddr
01e3fa68 7c82787b ntdll!KiFastSystemCallRet
01e3fa6c 77c80a6e ntdll!NtRequestWaitReplyPort+0xc
01e3fab8 77c7fcf0 rpcrt4!LRPC_CCALL::SendReceive+0x230
01e3fac4 77c80673 rpcrt4!I_RpcSendReceive+0x24
01e3fad8 77ce315a rpcrt4!NdrSendReceive+0x2b
01e3fec0 771f4fbd rpcrt4!NdrClientCall2+0x22e
01e3fed8 771f4f60 winsta!RpcWinStationWaitSystemEvent+0x1c
01e3ff20 6582116c winsta!WinStationWaitSystemEvent+0x51
[...]
01e3ffec 00000000 kernel32!BaseThreadStart+0x34
In cases of synchronous notifications if a notified thread is blocked we have an in-stance of a reversed strong coupling.
This is a variation of Hooked Functions (Volume 1, page 469) pattern for kernel space. In addition to trampoline patching, we also see a modified service table:
0: kd> !chkimg -lo 50 -d !nt-v Searching for module with expression: !nt Will apply relocation fixups to file used for comparison Will ignore NOP/LOCK errors Will ignore patched instructions Image specific ignores will be applied Comparison image path: c:symdownstream tkrnlmp.exe4B7A8E62280000 tkrnlmp.exe No range specified Scanning section: .text Size: 625257 Range to scan: 80801000-80899a69808373e3-808373e9 7 bytes - nt!KeAcquireQueuedSpinLockAtDpcLevel+1b [ f7 41 04 01 00 00 00:e9 00 0d b2 76 cc cc ]-8083e6cb 4 bytes -8083e6c8+440 (+0×72e5) [ 98 4e 98 80:d0 66 e9 f4 ]nt!KiServiceTable80840605-8084060a 6 bytes - nt!KxFlushEntireTb+9 (+0×1f3d) [ ff 15 1c 10 80 80:e9 a5 7a b1 76 cc ] Total bytes compared: 625257(100%) Number of errors: 17 Scanning section: MISYSPTE Size: 1906 Range to scan: 8089a000-8089a772 Total bytes compared: 1906(100%) Number of errors: 0 Scanning section: POOLMI Size: 7868 Range to scan: 8089b000-8089cebc Total bytes compared: 7868(100%) Number of errors: 0 Scanning section: POOLCODE Size: 7754 Range to scan: 8089d000-8089ee4a Total bytes compared: 7754(100%) Number of errors: 0 Scanning section: PAGE Size: 1097281 Range to scan: 808bc000-809c7e41 Total bytes compared: 1097281(100%) Number of errors: 0
Scanning section: PAGELK
Size: 63633
Range to scan: 809c8000-809d7891
Total bytes compared: 63633(100%)
Number of errors: 0
Scanning section: PAGEWMI
Size: 7095
Range to scan: 809ef000-809f0bb7
Total bytes compared: 7095(100%)
Number of errors: 0
Scanning section: PAGEKD
Size: 16760
Range to scan: 809f1000-809f5178
Total bytes compared: 16760(100%)
Number of errors: 0
Scanning section: PAGEHDLS
Size: 7508
Range to scan: 809f7000-809f8d54
Total bytes compared: 7508(100%)
Number of errors: 0
17 errors : !nt (808373e3-8084060a)
0: kd> dds 8083e6c8
8083e6c8 f4e966d0 DriverA+0×20d88083e734 037aaa85 8083e738 00c1f700 8083e73c 0fffff00 8083e740 037a9e85 8083e744 9090c300 0: kd> u808373e3nt!KeAcquireQueuedSpinLockAtDpcLevel+0×1b:808373e3 jmp DriverB+0×10e8 (f73580e8)808373e8 int 3 808373e9 int 3 808373ea je nt!KeAcquireQueuedSpinLockAtDpcLevel+0×12 (808373da) 808373ec pause 808373ee jmp nt!KeAcquireQueuedSpinLockAtDpcLevel+0×1b (808373e3) nt!KeReleaseInStackQueuedSpinLockFromDpcLevel: 808373f0 lea ecx,[ecx] nt!KeReleaseQueuedSpinLockFromDpcLevel: 808373f2 mov eax,ecx 0: kd> u80840605nt!KxFlushEntireTb+0×9:80840605 jmp DriverB+0×10af (f73580af)8084060a int 3 8084060b mov byte ptr [ebp-1],al 8084060e mov ebx,offset nt!KiTbFlushTimeStamp (808a7100) 80840613 mov ecx,dword ptr [nt!KiTbFlushTimeStamp (808a7100)] 80840619 test cl,1 8084061c jne nt!KxFlushEntireTb+0×19 (8082cd8d) 80840622 mov eax,ecx
Sometimes, when a high number of interrupts is reported but there are no signs of an interrupt storm[10] or pending DPCs in a memory dump file it is useful to search for this pattern in running and / or suspected threads. This can be done by examining execution residue left on a thread raw stack. Although the found driver activity might not be related to reported problems it can be a useful start for a driver elimination procedure for a general recommendation to check suspected drivers for any updates. Here is an example of a thread raw stack with a network card doing "Scatter-Gather" DMA:
1: kd> !thread
THREAD f7732090 Cid 0000.0000 Teb: 00000000 Win32Thread: 00000000 RUNNING
on processor 1
Not impersonating
Owning Process 8089db40 Image: Idle
Attached Process N/A Image: N/A
Wait Start TickCount 0 Ticks: 24437545 (4:10:03:56.640)
Context Switch Count 75624870
UserTime 00:00:00.000
KernelTime 4 Days 08:56:05.125
Stack Init f78b3000 Current f78b2d4c Base f78b3000 Limit f78b0000 Call 0
Priority 0 BasePriority 0 PriorityDecrement 0
ChildEBP RetAddr Args to Child
f3b30c5c 00000000 00000000 00000000 00000000 LiveKdD+0x1c07

1: kd> dds f78b0000 f78b3000
f78b0000 00000000
f78b0004 00000000
f78b0008 00000000
f78b000c 00000000
f78b0010 00000000
[...]
f78b2870 8b3de0d0
f78b2874 80887b75 nt!KiFlushTargetSingleTb+0xd
f78b2878 8b49032c
f78b287c 00000000
f78b2880 2d003202
f78b2884 00000000
f78b2888 00000000
f78b288c 2d003202
f78b2890 8b490302
f78b2894 f78b28a4
f78b2898 80a61456 hal!KfLowerIrql+0x62
f78b289c 2d00320a
f78b28a0 00000000
f78b28a4 8b3de0d0
f78b28a8 8b3e3730
f78b28ac 00341eb0
f78b28b0 f78b2918
f78b28b4 f63fbf78 NetworkAdapterA!SendWithScatterGather+0×318
f78b28b8 8b3de0d0
f78b28bc 8b341eb0
f78b28c0 f78b28d4
f78b28c4 00000000
f78b28c8 80a5f3c0 hal!KfAcquireSpinLock
f78b28cc 00000000
f78b28d0 8b3de0d0
f78b28d4 00000000
f78b28d8 8b3de0d0
f78b28dc 8b3eb730
f78b28e0 005a7340
f78b28e4 f78b294c
f78b28e8 f63fbf78 NetworkAdapterA!SendWithScatterGather+0×318
f78b28ec 8b3de0d0
f78b28f0 8a5a7340
f78b28f4 f78b2908
f78b28f8 00000000
f78b28fc 8b3de0d0
f78b2900 8b0f5158
f78b2904 001e2340
f78b2908 f78b2970
f78b290c f63fbf78 NetworkAdapterA!SendWithScatterGather+0×318
f78b2910 8b3de0d0
f78b2914 8b1e2340
f78b2918 f78b292c
f78b291c 00000000
f78b2920 80a5f3c0 hal!KfAcquireSpinLock
f78b2924 00000000
f78b2928 8b3de0d0
f78b292c 00000000
f78b2930 8b3eb700
f78b2934 00000000
f78b2938 00000000
f78b293c 00000000
f78b2940 00000000
f78b2944 00000000
f78b2948 00000000
f78b294c 0a446aa2
f78b2950 f78b29b8
f78b2954 8b0f5158
f78b2958 8b01ce10
f78b295c 00000001
f78b2960 8b3de0d0
f78b2964 80a5f302 hal!HalpPerfInterrupt+0×32
f78b2968 00000001
f78b296c 8b3de0d0
f78b2970 80a5f302 hal!HalpPerfInterrupt+0×32
f78b2974 8b3de302
f78b2978 f78b2988
f78b297c 80a61456 hal!KfLowerIrql+0×62
f78b2980 80a5f3c0 hal!KfAcquireSpinLock
f78b2984 8b3de302
f78b2988 f78b29a4
f78b298c 80a5f44b hal!KfReleaseSpinLock+0xb
f78b2990 f63fbbbf NetworkAdapterA!SendPackets+0×1b3
f78b2994 8a446a90
f78b2998 8b0e8ab0
f78b299c 00000000
f78b29a0 008b29d0
f78b29a4 f78b29bc
f78b29a8 f7163790 NDIS!ndisMProcessSGList+0×90
f78b29ac 8b3de388
f78b29b0 f78b29d0
f78b29b4 00000001
f78b29b8 00000000
f78b29bc f78b29e8
f78b29c0 80a60147 hal!HalBuildScatterGatherList+0×1c7
f78b29c4 8b0e89b0
f78b29c8 00000000
f78b29cc 8a44cde8
f78b29d0 8b1e2340
f78b29d4 8a446aa2
f78b29d8 8b026ca0
f78b29dc 8b1e2340
f78b29e0 8b0e8ab0
f78b29e4 8b0e8ab0
f78b29e8 f78b2a44
f78b29ec f716369f NDIS!ndisMAllocSGList+0xda
f78b29f0 8a44cde8
f78b29f4 8b0e89b0
f78b29f8 8a446a70
f78b29fc 00000000
f78b2a00 00000036
f78b2a04 f7163730 NDIS!ndisMProcessSGList
f78b2a08 8b1e2340
f78b2a0c 00000000
f78b2a10 8a44cde8
f78b2a14 00000218
f78b2a18 8b1e2308
f78b2a1c 00000103
f78b2a20 8b0e8ab0
f78b2a24 8a446a70
f78b2a28 8a44cde8
f78b2a2c 00000036
f78b2a30 8b0e8ab0
f78b2a34 00000036
f78b2a38 00000000
f78b2a3c 00000000
f78b2a40 029a9e02
f78b2a44 f78b2a60
f78b2a48 f71402ff NDIS!ndisMSendX+0×1dd
f78b2a4c 8b490310
f78b2a50 8b1e2340
f78b2a54 8a446a70
f78b2a58 8a9a9e02
f78b2a5c 8a9a9e02
f78b2a60 f78b2a88
f78b2a64 f546c923 tcpip!ARPSendData+0×1a9
f78b2a68 8b3e76c8
f78b2a6c 8b1e2340
f78b2a70 8a9a9ea8
f78b2a74 8b490310
f78b2a78 80888b00 nt!RtlBackoff+0×68
f78b2a7c 8a446a70
f78b2a80 8a446aa2
f78b2a84 8a446a70
f78b2a88 f78b2ab4
f78b2a8c f546ba5d tcpip!ARPTransmit+0×112
f78b2a90 8b490310
f78b2a94 8b1e2340
f78b2a98 8a9a9ea8
f78b2a9c 00000103
f78b2aa0 8a446a70
f78b2aa4 00000000
f78b2aa8 8b342398
f78b2aac 8a47e1f8
f78b2ab0 8b1e2340
f78b2ab4 f78b2bf0
f78b2ab8 f546c4fc tcpip!_IPTransmit+0×866
f78b2abc 8a9a9ebc
f78b2ac0 f78b2b02
f78b2ac4 00000001
[...]
We also do a sanity check for coincidental symbols (Volume 1, page 390):
1: kd> ub f63fbf78
NetworkAdapterA!SendWithScatterGather+0x304:
f63fbf64 push     eax
f63fbf65 push     edi
f63fbf66 push     esi
f63fbf67 mov      dword ptr [ebp-44h],ecx
f63fbf6a mov      dword ptr [ebp-3Ch],ecx
f63fbf6d mov      dword ptr [ebp-34h],ecx
f63fbf70 mov      dword ptr [ebp-2Ch],ecx
f63fbf73 call     NetworkAdapterA!PacketRetrieveNicActions (f63facd2)
1: kd> ub f63fbbbf
NetworkAdapterA!SendPackets+0x190:
f63fbb9c cmp      dword ptr [esi+0Ch],2
f63fbba0 jl       NetworkAdapterA!SendPackets+0x19e (f63fbbaa)
f63fbba2 mov      dword ptr [ecx+3818h],eax
f63fbba8 jmp      NetworkAdapterA!SendPackets+0x1a4 (f63fbbb0)
f63fbbaa mov      dword ptr [ecx+438h],eax
f63fbbb0 mov      dl,byte ptr [esi+2BCh]
f63fbbb6 mov      ecx,dword ptr [ebp+8]
f63fbbb9 call     dword ptr [NetworkAdapterA!_imp_KfReleaseSpinLock
(f640ca18)]

1: kd> ub 80a60147
hal!HalBuildScatterGatherList+0x1b0:
80a60130 je       hal!HalBuildScatterGatherList+0x1b9 (80a60139)
80a60132 mov      dword ptr [eax+4],1
80a60139 push     dword ptr [ebp+20h]
80a6013c push     eax
80a6013d mov      eax,dword ptr [ebp+0Ch]
80a60140 push     dword ptr [eax+14h]
80a60143 push     eax
80a60144 call     dword ptr [ebp+1Ch]
Most of the time this pattern is associated with function names and offsets, for exam-ple, module!foo vs. module!foo+100. In some cases the module name is incorrect itself or absent altogether. This can happen in complete memory dumps when we forget to reload user space symbols after changing the process context, for example:
; previous process context of firefox.exe
; switching to winlogon.exe context

kd> .process fffffadfe718c040
Implicit process is now fffffadf`e718c040

kd> !process fffffadfe718c040
PROCESS fffffadfe718c040
    SessionId: 0  Cid: 017c    Peb: 7fffffd9000  ParentCid: 0130
    DirBase: 01916000  ObjectTable: fffffa800099a890  HandleCount: 754.
    Image: winlogon.exe
    VadRoot fffffadfe75e91f0 Vads 190 Clone 0 Private 2905. Modified
10047. Locked 0.
    DeviceMap fffffa8000004950
    Token                             fffffa800122a060
    ElapsedTime                       77 Days 02:14:26.109
    UserTime                          00:00:04.156
    KernelTime                        00:00:02.359
    QuotaPoolUsage[PagedPool]         143128
    QuotaPoolUsage[NonPagedPool]      191072
    Working Set Sizes (now,min,max)  (541, 50, 345) (2164KB, 200KB,
1380KB)
    PeakWorkingSetSize                6323
    VirtualSize                       108 Mb
    PeakVirtualSize                   118 Mb
    PageFaultCount                    212547
    MemoryPriority                    BACKGROUND
    BasePriority                      13
    CommitCharge                      3733

[...]
THREAD fffffadfe68f2040 Cid 017c.0198 Teb: 000007fffffd7000 Win32Thread:
fffff97ff4a09010 WAIT: (Unknown) UserMode Non-Alertable
fffffadfe7133160 Semaphore Limit 0x7fffffff
fffffadfe68f20f8 NotificationTimer
sNot impersonating
DeviceMap fffffa8000004950
Owning
Process fffffadfe718c040 Image: winlogon.exe
Attached Process N/A Image: N/A
Wait Start TickCount 426298731 Ticks: 51 (0:00:00:00.796)
Context Switch Count 2215076 LargeStack
UserTime 00:00:00.187
KernelTime 00:00:00.468
Start Address 0×0000000077d6b6e0
Stack Init fffffadfe4481e00 Current fffffadfe4481860
Base fffffadfe4482000 Limit fffffadfe447a000 Call 0
Priority 14 BasePriority 13 PriorityDecrement 0
Child-SP RetAddr Call Site
fffffadf`e44818a0 fffff800`0103b093 nt!KiSwapContext+0×85
fffffadf`e4481a20 fffff800`0103c433 nt!KiSwapThread+0xc3
fffffadf`e4481a60 fffff800`012d25ae nt!KeWaitForSingleObject+0×528
fffffadf`e4481af0 fffff800`0104113d nt!NtReplyWaitReceivePortEx+0×8c8
fffffadf`e4481c00 00000000`77ef0caa nt!KiSystemServiceCopyEnd+0×3
(TrapFrame @ fffffadf`e4481c70)
00000000`00bcfb98 000007ff`7fd6ff61 ntdll!NtReplyWaitReceivePortEx+0xa
00000000`00bcfba0 00000000`000d2340 0×7ff`7fd6ff61
00000000`00bcfba8 00000000`00bcfde0 0xd2340
00000000`00bcfbb0 00000000`014cd220 0xbcfde0
00000000`00bcfbb8 00000000`000c1d30 0×14cd220
00000000`00bcfbc0 00000000`00bcfe18 0xc1d30
00000000`00bcfbc8 0000ffff`00001f80 0xbcfe18
00000000`00bcfbd0 00000000`006c0044firefox+0×2c0044
00000000`00bcfbe0 00000000`000007b0 0×6ec
00000000`00bcfbe8 00000000`419b8385 0×7b0
00000000`00bcfbf0 00000000`00000000 0×419b8385
kd> lmu m firefox
start end module name
00000000`00400000 00000000`00b67000 firefox T (no symbols)
We have the return address 00000000`006c0044 which is just firefox+0×2c0044 (00000000`00400000 + 2c0044). We correct it by reloading user space symbols.
kd> .reload /user

kd> !process fffffadfe718c040
[...]
THREAD fffffadfe68f2040  Cid 017c.0198  Teb: 000007fffffd7000 Win32Thread:
fffff97ff4a09010 WAIT: (Unknown) UserMode Non-Alertable
    fffffadfe7133160  Semaphore Limit 0x7fffffff
    fffffadfe68f20f8  NotificationTimer
Not impersonating
DeviceMap                 fffffa8000004950
Owning
Process            fffffadfe718c040       Image:         winlogon.exe
Attached Process          N/A            Image:         N/A
Wait Start TickCount      426298731      Ticks: 51 (0:00:00:00.796)
Context Switch Count      2215076                 LargeStack
UserTime                  00:00:00.187
KernelTime                00:00:00.468
Start Address kernel32!BaseThreadStart (0x0000000077d6b6e0)
Stack Init fffffadfe4481e00 Current fffffadfe4481860
Base fffffadfe4482000 Limit fffffadfe447a000 Call 0
Priority 14 BasePriority 13 PriorityDecrement 0
Child-SP          RetAddr           Call Site
fffffadf`e44818a0 fffff800`0103b093 nt!KiSwapContext+0x85
fffffadf`e4481a20 fffff800`0103c433 nt!KiSwapThread+0xc3
fffffadf`e4481a60 fffff800`012d25ae nt!KeWaitForSingleObject+0x528
fffffadf`e4481af0 fffff800`0104113d nt!NtReplyWaitReceivePortEx+0x8c8
fffffadf`e4481c00 00000000`77ef0caa nt!KiSystemServiceCopyEnd+0x3
(TrapFrame @ fffffadf`e4481c70)
00000000`00bcfb98 000007ff`7fd6ff61 ntdll!NtReplyWaitReceivePortEx+0xa
00000000`00bcfba0 000007ff`7fd45369
RPCRT4!LRPC_ADDRESS::ReceiveLotsaCalls+0x2a5
00000000`00bcfeb0 000007ff`7fd65996 RPCRT4!RecvLotsaCallsWrapper+0x9
00000000`00bcfee0 000007ff`7fd65d51 RPCRT4!BaseCachedThreadRoutine+0xde
00000000`00bcff50 00000000`77d6b71a RPCRT4!ThreadStartRoutine+0x21
00000000`00bcff80 00000000`00000000 kernel32!BaseThreadStart+0x3a
Commands like .process /r /p fffffadfe718c040 or !process fffffadfe718c040 ff do that automatically.
Another case for incorrect module names is malformed unloaded modules information:
0:000> lmt
start    end        module name
[...]
7c800000 7c907000   kernel32  Mon Apr 16 16:53:05 2007 (46239BE1)
7c910000 7c9c7000   ntdll     Wed Aug 04 08:57:08 2004 (411096D4)
7c9d0000 7d1ef000   shell32   Tue Dec 19 21:49:37 2006 (45885E71)
7df20000 7dfc0000   urlmon    Wed Aug 22 14:13:03 2007 (46CC365F)
7e360000 7e3f0000   user32    Thu Mar 08 15:36:30 2007 (45F02D7E)
Missing image name, possible paged-out or corrupt data.
Unloaded modules:
00410053 008a00a3   Unknown_Module_00410053
    Timestamp: Tue Mar 17 20:27:26 1970 (0064002E)
    Checksum:  006C006C
00010755 007407c5   l
    Timestamp: Wed Feb 04 21:26:01 1970 (002E0069)
    Checksum:  006C0064
00000011 411096d2   eme.dll
    Timestamp: Thu Apr 02 01:33:25 1970 (00780055)
    Checksum:  00680054
Missing image name, possible paged-out or corrupt data.
0064002e 00d0009a   Unknown_Module_0064002e
    Timestamp: unavailable (00000000)
    Checksum:  00000000
Here parts of UNICODE module names appear in checksums and timestamps as well. Such partial module names can appear on thread stacks and raw stack data, for example:
0:000> kL
ChildEBP RetAddr
[...]
0015ef3c 0366afc2 ModuleA!Validation+0x5b
WARNING: Frame IP not in any known module. Following frames may be wrong.
0015efcc 79e7c7a6 <Unloaded_ure.dll>+0x366afc1
03dc9b70 00000000 mscorwks!MethodDesc::CallDescr+0x1f
Default analysis falls victim too and suggests ure.dll that you would try hard to find on your system:
MODULE_NAME: ure

IMAGE_NAME:    ure.dll

DEBUG_FLR_IMAGE_TIMESTAMP:    750063

FAILURE_BUCKET_ID:    ure.dll!Unloaded_c0000005_APPLICATION_FAULT
Timestamp is suspiciously UNICODE-like. In such cases we can even reconstruct the module name:
00000011 411096d2   eme.dll
    Timestamp: Thu Apr 02 01:33:25 1970 (00780055)
    Checksum:  00680054
0:000> .formats 00780055 Evaluate expression: Hex: 00000000`00780055 Decimal: 7864405 Octal: 0000000000000036000125 Binary: 00000000 00000000 00000000 00000000 00000000 01111000 00000000 01010101Time: Thu Apr 02 01:33:25 1970 Float: low 1.10204e-038 high 0 Double: 3.88553e-317 0:000> .formats 00680054 Evaluate expression: Hex: 00680054 Decimal: 6815828 Octal: 00032000124 Binary: 00000000 01101000 00000000 01010100Chars: .....x.UTime: Fri Mar 20 21:17:08 1970 Float: low 9.55101e-039 high 0 Double: 3.36747e-317Chars: .h.T
We concatenate UNICODE Ux and Th with eme.dll to get UxTheme.dll which is a real DLL name we can find on a system.
In addition to hooking functions via code patching there is another function pre- and post-processing done via windows message hooking[11] mechanism that we call Message Hooks pattern to differentiate it from Hooked Functions pattern (Volume 1, page 469). In some cases message hooking becomes a source of aberrant software behaviour including spikes, hangs and crashes. We can identify such residue looking at the problem thread raw stack:
0:000> !teb
TEB at 7ffde000
ExceptionList: 0012fcdc
StackBase: 00130000
StackLimit: 0011b000
SubSystemTib: 00000000
FiberData: 00001e00
ArbitraryUserPointer: 00000000
Self: 7ffde000
EnvironmentPointer: 00000000
ClientId: 0000050c . 000004b8
RpcHandle: 00000000
Tls Storage: 00000000
PEB Address: 7ffdf000
LastErrorValue: 0
LastStatusValue: c0000034
Count Owned Locks: 0
HardErrorMode: 0
0:000> dps 0011b000 00130000
[...]
0012fc78 7e4318d1 user32!DispatchHookA
0012fc7c 0012fcb8
0012fc80 7472467f
0012fc84 7e43e1ad user32!NtUserCallNextHookEx+0xc
0012fc88 7e43e18a user32!CallNextHookEx+0×6f
0012fc8c 00000003
0012fc90 00000011
0012fc94 001d0001
0012fc98 00000001
0012fc9c 00000003
0012fca0 00000000
0012fca4 001d0001
0012fca8 0012fcec
0012fcac 747308440012fcb4 00000003 0012fcb8 00000011 0012fcbc 001d0001 0012fcc0 00000003 0012fcc4 00020003 0012fcc8 001d0001 0012fccc 00000000 0012fcd0 001e04f7 0012fcd4 0012fcc0 0012fcd8 00000000 0012fcdc 0012fd4c 0012fce0 7475f1a6 0012fce4 74730850 0012fce8 ffffffff 0012fcec 0012fd200012fcf0 7e431923 user32!DispatchHookA+0×1010012fcf4 00000003 0012fcf8 00000011 0012fcfc 001d0001 0012fd00 00000000 0012fd04 0012fe94 0012fd08 00000102 0012fd0c 7ffde000 0012fd10 00000000 0012fd14 00000001 0012fd18 000000030012fd1c 7e42b326 user32!CallHookWithSEH+0×440012fd20 0012fd5c0012fd24 7e42b317 user32!CallHookWithSEH+0×210012fd28 00020003 0012fd2c 00000011 0012fd30 001d0001 0012fd34 747307c3 0012fd38 00000000 0012fd3c 0012fe94 0012fd40 00000102 [...] 0:000> ubDllA!ThreadKeyboardProc+0×5e: 7473082b jne DllA!ThreadKeyboardProc+0×77 (74730844) 7473082d cmp dword ptr [ebp-1Ch],esi 74730830 je DllA!ThreadKeyboardProc+0×77 (74730844) 74730832 push dword ptr [ebp+10h] 74730835 push dword ptr [ebp+0Ch] 74730838 push dword ptr [ebp+8] 7473083b push dword ptr [ebp-1Ch] 7473083e call dword ptr [DllA!_imp__74730844CallNextHookEx(74721248)]
Sometimes we can even reconstruct stack trace fragments (Volume 1, page 157) that show message hooking call stack. When threads are spiking or blocked in a message hook procedure we can see a hooking module too:
0:000> kL
ChildEBP RetAddr
0012fc80 7e43e1ad ntdll!KiFastSystemCallRet
0012fca8 74730844 user32!NtUserCallNextHookEx+0xc
0012fcec 7e431923 DllA!ThreadKeyboardProc+0×77
0012fd20 7e42b317 user32!DispatchHookA+0×101
0012fd5c 7e430238 user32!CallHookWithSEH+0×21
0012fd80 7c90e473 user32!__fnHkINDWORD+0×24
0012fda4 7e4193e9 ntdll!KiUserCallbackDispatcher+0×13
0012fdd0 7e419402 user32!NtUserPeekMessage+0xc
0012fdfc 747528ee user32!PeekMessageW+0xbc
[...]
0012fff0 00000000 kernel32!BaseProcessStart+0×23
This is a specialization of Blocked Thread pattern (Volume 2, page 184) where a thread is waiting for a hardware I/O response. For example, a frozen system initialization thread is waiting for a response from one of ACPI general register ports:
kd> kL 100
ChildEBP RetAddr
f7a010bc f74c5a57 hal!READ_PORT_UCHAR+0×7
f7a010c8 f74c5ba4 ACPI!DefReadAcpiRegister+0xa1
f7a010d8 f74b4d78 ACPI!ACPIReadGpeStatusRegister+0×10
f7a010e4 f74b6334 ACPI!ACPIGpeIsEvent+0×14
f7a01100 8054157d ACPI!ACPIInterruptServiceRoutine+0×16
f7a01100 806d687d nt!KiInterruptDispatch+0×3d
f7a01194 804f9487 hal!HalEnableSystemInterrupt+0×79
f7a011d8 8056aac4 nt!KeConnectInterrupt+0×95
f7a011fc f74c987c nt!IoConnectInterrupt+0xf2
f7a0123c f74d13f0 ACPI!OSInterruptVector+0×76
f7a01250 f74b5781 ACPI!ACPIInitialize+0×154
f7a01284 f74cf824 ACPI!ACPIInitStartACPI+0×71
f7a012b0 f74b1e12 ACPI!ACPIRootIrpStartDevice+0xc0
f7a012e0 804ee129 ACPI!ACPIDispatchIrp+0×15a
f7a012f0 8058803b nt!IopfCallDriver+0×31
f7a0131c 805880b9 nt!IopSynchronousCall+0xb7
f7a01360 804f515c nt!IopStartDevice+0×4d
f7a0137c 80587769 nt!PipProcessStartPhase1+0×4e
f7a015d4 804f5823 nt!PipProcessDevNodeTree+0×1db
f7a01618 804f5ab3 nt!PipDeviceActionWorker+0xa3
f7a01630 8068afc6 nt!PipRequestDeviceAction+0×107
f7a01694 80687e48 nt!IopInitializeBootDrivers+0×376
f7a0183c 806862dd nt!IoInitSystem+0×712
f7a01dac 805c61e0 nt!Phase1Initialization+0×9b5
f7a01ddc 80541e02 nt!PspSystemThreadStartup+0×34
00000000 00000000 nt!KiThreadStartup+0×16

kd> r
eax=00000000 ebx=00000000 ecx=00000002 edx=0000100c esi=00000000
edi=867d8008
eip=806d664b esp=f7a010c0 ebp=f7a010c8 iopl=1      nv up ei pl zr na pe nc
cs=0008  ss=0010  ds=0023  es=0023  fs=0030  gs=0000          efl=00001246
hal!READ_PORT_UCHAR+0x7:
806d664b c20400          ret     4
kd> ub eip
hal!KdRestore+0x9:
806d663f cc              int     3
806d6640 cc              int     3
806d6641 cc              int     3
806d6642 cc              int     3
806d6643 cc              int     3
hal!READ_PORT_UCHAR:
806d6644 33c0            xor     eax,eax
806d6646 8b542404        mov     edx,dword ptr [esp+4]
806d664a ec              in      al,dx

kd> version
[...]
System Uptime: 0 days 0:03:42.140
[...]

kd> !thread
THREAD 867c63e8  Cid 0004.0008  Teb: 00000000 Win32Thread: 00000000
RUNNING on processor 0
IRP List:
    867df008: (0006,0190) Flags: 00000000  Mdl: 00000000
Not impersonating
DeviceMap                 e1005460
Owning Process            0       Image:         <Unknown>
Attached Process          867c6660       Image:         System
Wait Start TickCount      39             Ticks: 1839 (0:00:00:18.416)
Context Switch Count      4
UserTime                  00:00:00.000
KernelTime                00:00:00.911
Start Address nt!Phase1Initialization (0x80685928)
Stack Init f7a02000 Current f7a014a4 Base f7a02000 Limit f79ff000 Call 0
Priority 31 BasePriority 8 PriorityDecrement 0 DecrementCount 0
[...]
Sometimes we have threads that wait for a response from another machine (for example, via RPC). For most of the time Coupled Processes pattern (Volume 1, page 419) covers that if we assume that processes in that pattern are not restricted to the same machine. However, sometimes we have threads that provide hints for dependency on another machine through their data and that could also involve additional threads from different processes to accomplish the task. Here we need another pattern that we call Coupled Machines. For example, the following thread on a computer SERVER_A is trying to set the current working directory that resides on a computer SERVER_B:
kd> kv 100 ChildEBP RetAddr Args to Child b881c8d4 804e1bf2 89cd9c80 89cd9c10 804e1c3e nt!KiSwapContext+0x2f b881c8e0 804e1c3e 00000000 89e35b08 89e35b34 nt!KiSwapThread+0x8a b881c908 f783092e 00000000 00000006 00000000 nt!KeWaitForSingleObject+0x1c2 b881c930 f7830a3b 89e35b08 00000000 f78356d8 Mup!PktPostSystemWork+0x3d b881c94c f7836712 b881c9b0 b881c9b0 b881c9b8 Mup!PktGetReferral+0xce b881c980 f783644f b881c9b0 b881c9b8 00000000 Mup!PktCreateDomainEntry+0x224 b881c9d0 f7836018 0000000b 00000000 b881c9f0 Mup!DfsFsctrlIsThisADfsPath+0x2bb b881ca14 f7835829 89a2e130 899ba350 b881caac Mup!CreateRedirectedFile+0x2cd b881ca70 804e13eb 89f46ee8 89a2e130 89a2e130 Mup!MupCreate+0x1cb b881ca80 805794b6 89f46ed0 89df3c44 b881cc18 nt!IopfCallDriver+0x31 b881cb60 8056d03b 89f46ee8 00000000 89df3ba0 nt!IopParseDevice+0xa12 b881cbd8 805701e7 00000000 b881cc18 00000042 nt!ObpLookupObjectName+0x53c b881cc2c 80579b12 00000000 00000000 00003801 nt!ObOpenObjectByName+0xea b881cca8 80579be1 00cff67c 00100020 00cff620 nt!IopCreateFile+0x407 b881cd04 80579d18 00cff67c 00100020 00cff620 nt!IoCreateFile+0x8e b881cd44 804dd99f 00cff67c 00100020 00cff620 nt!NtOpenFile+0x27 b881cd44 7c90e514 00cff67c 00100020 00cff620 nt!KiFastCallEntry+0xfc 00cff5f0 7c90d5aa 7c91e8dd 00cff67c 00100020 ntdll!KiFastSystemCallRet 00cff5f4 7c91e8dd 00cff67c 00100020 00cff620 ntdll!ZwOpenFile+0xc 00cff69c 7c831e58 00cff6a8 00460044 0078894a ntdll!RtlSetCurrentDirectory_U+0x169 00cff6b0 7731889e0078894a00000000 00000001 kernel32!SetCurrentDirectoryW+0×2b 00cffb84 7730ffbb 00788450 00788b38 00cffbe0 schedsvc!CSchedWorker::RunNTJob+0×221 00cffe34 7730c03a 01ea9108 8ed032d4 00787df8 schedsvc!CSchedWorker::RunJobs+0×304 00cffe74 77310e4d 7c80a749 00000000 00000000 schedsvc!CSchedWorker::RunNextJobs+0×129 00cfff28 77310efc 7730b592 00000000 000ba4bc schedsvc!CSchedWorker::MainServiceLoop+0×6d9 00cfff2c 7730b592 00000000 000ba4bc 0009a2bc schedsvc!SchedMain+0xb 00cfff5c 7730b69f 00000001 000ba4b8 00cfffa0 schedsvc!SchedStart+0×266 00cfff6c 010011cc 00000001 000ba4b8 00000000 schedsvc!SchedServiceMain+0×33 00cfffa0 77df354b 00000001 000ba4b8 0007e898 svchost!ServiceStarter+0×9e 00cfffb4 7c80b729 000ba4b0 00000000 0007e898 ADVAPI32!ScSvcctrlThreadA+0×12 00cfffec 00000000 77df3539 000ba4b0 00000000 kernel32!BaseThreadStart+0×37 kd> du /c 900078894a0078894a "\SERVER_BShare_X$Folder_Q"
This is a variant of High Contention pattern for processors where we have more threads at the same priority than the available processors. All these threads share the same notification event (or any other similar synchronization mechanism) and rush once it is signalled. If this happens often the system becomes sluggish or even appears frozen.
0: kd> !running

System Processors 3 (affinity mask)
  Idle Processors 0

Prcbs  Current   Next
  0    ffdff120  89a92020            O...............
  1    f7737120  89275020            W...............

0: kd> !ready
Processor 0: Ready Threads at priority 8
     THREAD 894a1db0  Cid 1a98.25c0  Teb: 7ffde000 Win32Thread: bc19cea8 READY
     THREAD 897c4818  Cid 11d8.1c5c  Teb: 7ffa2000 Win32Thread: bc2c5ba8 READY
     THREAD 8911fd18  Cid 2730.03f4  Teb: 7ffd9000 Win32Thread: bc305830 READY
Processor 1: Ready Threads at priority 8
     THREAD 89d89db0  Cid 1b10.20ac  Teb: 7ffd7000 Win32Thread: bc16e680 READY
     THREAD 891f24a8  Cid 1e2c.20d0  Teb: 7ffda000 Win32Thread: bc1b9ea8 READY
     THREAD 89214db0  Cid 1e2c.24d4  Teb: 7ffd7000 Win32Thread: bc24ed48 READY
     THREAD 89a28020  Cid 1b10.21b4  Teb: 7ffa7000 Win32Thread: bc25b3b8 READY
     THREAD 891e03b0  Cid 1a98.05c4  Teb: 7ffdb000 Win32Thread: bc228bb0 READY
     THREAD 891b0020  Cid 1cd0.0144  Teb: 7ffde000 Win32Thread: bc205ea8 READY
All these threads have the common stack trace (we show only a few threads here):
0: kd> !thread 89a92020 1f
THREAD 89a92020  Cid 11d8.27d8  Teb: 7ffd9000 Win32Thread: bc1e6860
RUNNING on processor 0
Not impersonating
DeviceMap                 e502b248
Owning Process            89e2a020       Image:         ProcessA.exe
Attached Process          N/A            Image:         N/A
Wait Start TickCount      336581         Ticks: 0
Context Switch Count      61983                 LargeStack
UserTime                  00:00:00.156
KernelTime                00:00:00.281
Win32 Start Address ntdll!RtlpWorkerThread (0x7c839f2b)
Start Address kernel32!BaseThreadStartThunk (0x77e617ec)
Stack Init f3730000 Current f372f7e0 Base f3730000 Limit f372c000 Call 0
Priority 8 BasePriority 8 PriorityDecrement 0
ChildEBP RetAddr
f3cc98e8 f6e21915 DriverA+0x1e4d
[...]
f3cc9ac0 f67f05dc nt!IofCallDriver+0x45
[...]
02e7ff44 7c83aa3b ntdll!RtlpWorkerCallout+0x71
02e7ff64 7c83aab2 ntdll!RtlpExecuteWorkerRequest+0x4f
02e7ff78 7c839f90 ntdll!RtlpApcCallout+0x11
02e7ffb8 77e6482f ntdll!RtlpWorkerThread+0x61
02e7ffec 00000000 kernel32!BaseThreadStart+0x34

0: kd> !thread 89275020 1f
THREAD 89275020  Cid 1cd0.2510  Teb: 7ffa9000 Win32Thread: bc343180
RUNNING on processor 1
Not impersonating
DeviceMap                 e1390978
Owning Process            89214708       Image:          ProcessB.exe
Attached Process          N/A            Image:          N/A
Wait Start TickCount      336581         Ticks: 0
Context Switch Count      183429                 LargeStack
UserTime                  00:00:00.171
KernelTime                00:00:00.484
Win32 Start Address ntdll!RtlpWorkerThread (0x7c839f2b)
Start Address kernel32!BaseThreadStartThunk (0x77e617ec)
Stack Init b9f6e000 Current b9f6d7e0 Base b9f6e000 Limit b9f6a000 Call 0
Priority 8 BasePriority 8 PriorityDecrement 0
ChildEBP RetAddr
b9f6d87c f6e22d4b nt!KeWaitForSingleObject+0x497
b9f6d8e8 f6e21915 DriverA+0x1e4d
[...]
b9f6dac0 f67f05dc nt!IofCallDriver+0x45
[...]
0507ff44 7c83aa3b ntdll!RtlpWorkerCallout+0x71
0507ff64 7c83aab2 ntdll!RtlpExecuteWorkerRequest+0x4f
0507ff78 7c839f90 ntdll!RtlpApcCallout+0x11
0507ffb8 77e6482f ntdll!RtlpWorkerThread+0x61
0507ffec 00000000 kernel32!BaseThreadStart+0x34

0: kd> !thread 89d89db0 1f
THREAD 89d89db0  Cid 1b10.20ac  Teb: 7ffd7000 Win32Thread: bc16e680 READY
Not impersonating
DeviceMap                 e4e3a0b8
Owning Process            898cb020       Image:          ProcessC.exe
Attached Process          N/A            Image:          N/A
Wait Start TickCount      336581         Ticks: 0
Context Switch Count      159844                 LargeStack
UserTime                  00:00:00.234
KernelTime                00:00:00.484
Win32 Start Address ntdll!RtlpWorkerThread (0x7c839f2b)
Start Address kernel32!BaseThreadStartThunk (0x77e617ec)
Stack Init b9e1e000 Current b9e1d7e0 Base b9e1e000 Limit b9e1a000 Call 0
Priority 8 BasePriority 8 PriorityDecrement 0
ChildEBP RetAddr
b9e1d7f8 80831292 nt!KiSwapContext+0x26
b9e1d818 80828c73 nt!KiExitDispatcher+0xf8
b9e1d830 80829c72 nt!KiAdjustQuantumThread+0x109
b9e1d87c f6e22d4b nt!KeWaitForSingleObject+0x536
b9e1d8e8 f6e21915 DriverA+0x1e4d
[...]
b9e1dac0 f67f05dc nt!IofCallDriver+0x45
[...]
014dff44 7c83aa3b ntdll!RtlpWorkerCallout+0x71
014dff64 7c83aab2 ntdll!RtlpExecuteWorkerRequest+0x4f
014dff78 7c839f90 ntdll!RtlpApcCallout+0x11
014dffb8 77e6482f ntdll!RtlpWorkerThread+0x61
These threads also share the same synchronization object:
0: kd> .thread 89275020 Implicit thread is now 89275020 0: kd> kv 1 ChildEBP RetAddr Args to Child b9f6d87c f6e22d4bf6e2513000000006 00000001 nt!KeWaitForSingleObject+0×497 0: kd> .thread 89d89db0 Implicit thread is now 89d89db0 0: kd> kv 4 ChildEBP RetAddr Args to Child b9e1d7f8 80831292 f7737120 f7737b50 f7737a7c nt!KiSwapContext+0x26 b9e1d818 80828c73 00000000 89d89db0 89d89e58 nt!KiExitDispatcher+0xf8 b9e1d830 80829c72 f7737a7c 00000102 00000001 nt!KiAdjustQuantumThread+0x109 b9e1d87c f6e22d4bf6e2513000000006 00000001 nt!KeWaitForSingleObject+0×536 0: kd> dt _DISPATCHER_HEADERf6e25130ntdll!_DISPATCHER_HEADER +0×000 Type : 0 +0×001 Absolute : 0 +0×001 NpxIrql : 0 +0×002 Size : 0×4 +0×002 Hand : 0×4 +0×003 Inserted : 0 +0×003 DebugActive : 0 +0×000 Lock : 262144+0×008 WaitListHead : _LIST_ENTRY [ 0xf6e25138 - 0xf6e25138 ]+0×004 SignalState : 1
Here we show the possible signs of the classical thread starvation. Suppose we have two running threads with a priority 8:
0: kd> !running System Processors 3 (affinity mask) Idle Processors 0 Prcbs Current Next 0 ffdff120 89a92020 O............... 1 f7737120 89275020 W............... 0: kd> !thread 89a92020 THREAD 89a92020 Cid 11d8.27d8 Teb: 7ffd9000 Win32Thread: bc1e6860 RUNNING on processor 0 [...]Priority 8BasePriority 8 PriorityDecrement 0 0: kd> !thread 89275020 THREAD 89275020 Cid 1cd0.2510 Teb: 7ffa9000 Win32Thread: bc343180 RUNNING on processor 1 [...]Priority 8BasePriority 8 PriorityDecrement 0
If we have other threads ready with the same priority contending for the same processors (page 82) other threads with less priority might starve (shown in bold italics):
0: kd> !readyProcessor 0: Ready Threads at priority 8 THREAD 894a1db0 Cid 1a98.25c0 Teb: 7ffde000 Win32Thread: bc19cea8 READY THREAD 897c4818 Cid 11d8.1c5c Teb: 7ffa2000 Win32Thread: bc2c5ba8 READY THREAD 8911fd18 Cid 2730.03f4 Teb: 7ffd9000 Win32Thread: bc305830 READYProcessor 0: Ready Threads at priority 7 THREAD 8a9e5ab0 Cid 0250.0470 Teb: 7ff9f000 Win32Thread: 00000000 READY THREAD 8a086838 Cid 0250.0654 Teb: 7ff93000 Win32Thread: 00000000 READY THREAD 8984b8b8 Cid 0250.1dc4 Teb: 7ff99000 Win32Thread: 00000000 READY THREAD 8912a4c0 Cid 0f4c.2410 Teb: 7ff81000 Win32Thread: 00000000 READY THREAD 89e5c570 Cid 0f4c.01c8 Teb: 00000000 Win32Thread: 00000000 READY Processor 0: Ready Threads at priority 6 THREAD 8a9353b0 Cid 1584.1598 Teb: 7ff8b000 Win32Thread: bc057698 READY THREAD 8aba2020 Cid 1584.15f0 Teb: 7ff9f000 Win32Thread: bc2a0ea8 READY THREAD 8aab17a0 Cid 1584.01a8 Teb: 7ff92000 Win32Thread: bc316ea8 READY THREAD 8a457020 Cid 1584.0634 Teb: 7ff8d000 Win32Thread: bc30fea8 READY THREAD 8a3d4020 Cid 1584.1510 Teb: 7ff8f000 Win32Thread: bc15b8a0 READY THREAD 8a5f5db0 Cid 1584.165c Teb: 7ff9d000 Win32Thread: bc171be8 READY THREAD 8a297020 Cid 0f4c.0f54 Teb: 7ffde000 Win32Thread: bc20fda0 READY THREAD 8a126020 Cid 1584.175c Teb: 7ffa9000 Win32Thread: 00000000 READY THREAD 8a548478 Cid 0250.07b0 Teb: 7ff9a000 Win32Thread: 00000000 READY
     THREAD 8a478020  Cid 0944.0988  Teb: 7ffd9000 Win32Thread: 00000000 READY
     THREAD 8986ad08  Cid 1d2c.1cf0  Teb: 7ffa8000 Win32Thread: bc285800 READY
     THREAD 897f4db0  Cid 1d2c.2554  Teb: 7ffdb000 Win32Thread: bc238e80 READY
     THREAD 89a2e618  Cid 1d2c.1de4  Teb: 7ffdd000 Win32Thread: bc203908 READY
Processor 0: Ready Threads at priority 0
     THREAD 8b184db0  Cid 0004.0008  Teb: 00000000 Win32Thread: 00000000 READY
Processor 1: Ready Threads at priority 8
     THREAD 89d89db0  Cid 1b10.20ac  Teb: 7ffd7000 Win32Thread: bc16e680 READY
     THREAD 891f24a8  Cid 1e2c.20d0  Teb: 7ffda000 Win32Thread: bc1b9ea8 READY
     THREAD 89214db0  Cid 1e2c.24d4  Teb: 7ffd7000 Win32Thread: bc24ed48 READY
     THREAD 89a28020  Cid 1b10.21b4  Teb: 7ffa7000 Win32Thread: bc25b3b8 READY
     THREAD 891e03b0  Cid 1a98.05c4  Teb: 7ffdb000 Win32Thread: bc228bb0 READY
     THREAD 891b0020  Cid 1cd0.0144  Teb: 7ffde000 Win32Thread: bc205ea8 READY
Processor 1: Ready Threads at priority 7
     THREAD 898367a0  Cid 0f4c.1cd4  Teb: 00000000 Win32Thread: 00000000 READY
     THREAD 8a1ac020  Cid 0f4c.1450  Teb: 00000000 Win32Thread: 00000000 READY
     THREAD 8aa1ab90  Cid 0f4c.11b0  Teb: 00000000 Win32Thread: 00000000 READY
     THREAD 89cc92e0  Cid 0f4c.1b34  Teb: 00000000 Win32Thread: 00000000 READY
     THREAD 89579020  Cid 0f4c.2220  Teb: 00000000 Win32Thread: 00000000 READY
Processor 1: Ready Threads at priority 6
     THREAD 8a487db0  Cid 1584.14bc  Teb: 7ffa2000 Win32Thread: bc304ea8 READY
     THREAD 8a3ce020  Cid 1584.0630  Teb: 7ff8e000 Win32Thread: bc293c20 READY
     THREAD 8a1b6db0  Cid 1584.1590  Teb: 7ff8c000 Win32Thread: bc310ea8 READY
     THREAD 8a1fe6e0  Cid 1584.15ec  Teb: 7ffa1000 Win32Thread: bc15bea8 READY
     THREAD 8ac0adb0  Cid 1584.156c  Teb: 7ff8a000 Win32Thread: bc153be8 READY
     THREAD 8b1e35a0  Cid 1584.15f4  Teb: 7ff9e000 Win32Thread: bc0567e8 READY
     THREAD 8a3288e8  Cid 1584.14b8  Teb: 7ff9a000 Win32Thread: bc2fbea8 READY
     THREAD 8a5056a0  Cid 1584.1518  Teb: 7ff91000 Win32Thread: bc337ea8 READY
     THREAD 891afdb0  Cid 1d2c.27e8  Teb: 7ffaf000 Win32Thread: bc217c18 READY
     THREAD 8a07d308  Cid 1d2c.2548  Teb: 7ffae000 Win32Thread: bc235750 READY
     THREAD 8a055d18  Cid 1584.17d0  Teb: 7ffd5000 Win32Thread: 00000000 READY
     THREAD 8ac0b770  Cid 0250.0268  Teb: 7ffde000 Win32Thread: bc2349d8 READY
     THREAD 8a0eeb40  Cid 1584.1560  Teb: 7ffdc000 Win32Thread: 00000000 READY
Here we should also analyze stack traces for running and ready threads with the priority 8 and check kernel and user times. If we find anything common between them we should also check ready threads with lower priority to see if that commonality is unique to threads with the priority 8. See also the similar pattern: Busy System (Volume 1, page 449) and the similar starvation pattern resulted from realtime priority threads (Volume 2, page 274).
In addition to strong (Volume 1, page 419) and weak (60) process coupling patterns we also have another variant that we call semantic coupling. Some processes (not necessarily from the same vendor) cooperate to provide certain functionality. The cooperation might not involve trackable and visible inter-process communication such as (A)LPC/RPC or pipes but involve events, shared memory and other possible mechanisms not explicitly visible when we look at memory dumps. In many cases, after finding problems in one or several processes from a semantic group we also look at the remaining processes from that group to see if there are some anomalies there as well. The one example I encounter often can be generalized as follows: we have an ALPC wait chain ProcessA -> ProcessB <-> ProcessC (not necessarily a deadlock) but the crucial piece of functionality is also implemented in ProcessD. Sometimes ProcessD is healthy and the problem resides in ProcessC or ProcessB, and sometimes, when we look at ProcessD we find evidence of an earlier problem pattern there so the focus of recommendations shifts to one of ProcessD modules.
Sometimes we get memory dumps that are difficult to analyze in full because some if not most of information was omitted during saving them. These are usually small memory dumps (contrasted with kernel and complete) and user process minidumps. We can easily recognize that when we open a dump file:
User Mini Dump File: Only registers, stack and portions of memory are available


Mini Kernel Dump File: Only registers and stack trace are available
The same also applies to user dumps where thread times information is omitted (it is not possible to use !runaway WinDbg command) or to a dump saved with various options of .dump command (including privacy-ware Volume 1, page 600) instead of /ma or deprecated /f option. On the contrary, manually erased data (Volume 2, page 397) in crash dumps looks more like an example of another pattern called Lateral Damage (Volume 1, page 264).
The similar cases of abridged dumps are discussed in Wrong Dump (Volume 1, page 496) and Missing Space (Volume 3, page 138) antipatterns.
Anyway, we shouldn't dismiss such dump files and should try to analyze them. For example, some approaches (including using image binaries) are listed in kernel minidump analysis series (Volume 1, page 43). We can even see portions of the raw stack data when looking for execution residue (Volume 2, page 239):
0: kd> !thread
GetPointerFromAddress: unable to read from 81d315b0
THREAD 82f49020  Cid 0004.0034  Teb: 00000000 Win32Thread: 00000000 RUNNING on
processor 0
IRP List:
    Unable to read nt!_IRP @ 8391e008
Not impersonating
GetUlongFromAddress: unable to read from 81d0ad90
Owning Process            82f00ab0       Image:         System
Attached Process          N/A            Image:         N/A
ffdf0000: Unable to get shared data
Wait Start TickCount      4000214
Context Switch Count      21886
ReadMemory error: Cannot get nt!KeMaximumIncrement value.
UserTime                  00:00:00.000
KernelTime                00:00:00.000
Win32 Start Address nt!ExpWorkerThread (0x81c78ea3)
Stack Init 85be0000 Current 85bdf7c0 Base 85be0000 Limit 85bdd000 Call 0
Priority 14 BasePriority 12 PriorityDecrement 0 IoPriority 2 PagePriority 5
[...]
0: kd> dps 85bdd000 85be0000
85bdd000  ????????
85bdd004  ????????
85bdd008  ????????
85bdd00c  ????????
85bdd010  ????????
85bdd014  ????????
85bdd018  ????????
85bdd01c  ????????
85bdd020  ????????
85bdd024  ????????
85bdd028  ????????
[...]
85bdf8c4  ????????
85bdf8c8  ????????
85bdf8cc  ????????
85bdf8d0  0000000a
85bdf8d4  a112883e
85bdf8d8  0000001b
85bdf8dc  00000000
85bdf8e0  81c28750 nt!KeSetEvent+0x4d
85bdf8e4  85bdf8e8
85bdf8e8  85bdf970
85bdf8ec  81c28750 nt!KeSetEvent+0x4d
85bdf8f0  badb0d00
85bdf8f4  00000000
85bdf8f8  00000000
85bdf8fc  81cf4820 nt!KiInitialPCR+0x120
85bdf900  00000000
85bdf904  85bdf938
85bdf908  81cf4820 nt!KiInitialPCR+0x120
85bdf90c  00000000
85bdf910  81d32300 nt!IopTimerLock
85bdf914  00000000
85bdf918  81fa0000 nt!_NULL_IMPORT_DESCRIPTOR <PERF> (nt+0x3a0000)
85bdf91c  85bd0023
85bdf920  00000023
85bdf924  00000000
85bdf928  81d323c0 nt!KiDispatcherLock
85bdf92c  a1128828
85bdf930  85bdf9b4
85bdf934  85bdfdb0
85bdf938  00000030
85bdf93c  84ca6f40
85bdf940  84ca6f38
85bdf944  00000001
85bdf948  85bdf970
85bdf94c  00000000
85bdf950  81c28750 nt!KeSetEvent+0x4d
85bdf954  00000008
85bdf958  00010246
85bdf95c  00000000
85bdf960  84ca68a0
[...]
85bdfd2c  82f49020
85bdfd30  835ca4d0
85bdfd34  a6684538
85bdfd38  81cfde7c nt!ExWorkerQueue+0x3c
85bdfd3c  00000001
85bdfd40  00000000
85bdfd44  85bdfd7c
85bdfd48  81c78fa0 nt!ExpWorkerThread+0xfd
85bdfd4c  835ca4d0
85bdfd50  00000000
85bdfd54  82f49020
85bdfd58  00000000
85bdfd5c  00000000
85bdfd60  0069000b
85bdfd64  00000000
85bdfd68  00000001
85bdfd6c  00000000
85bdfd70  835ca4d0
85bdfd74  81da9542 nt!PnpDeviceEventWorker
85bdfd78  00000000
85bdfd7c  85bdfdc0
85bdfd80  81e254e0 nt!PspSystemThreadStartup+0x9d
85bdfd84  835ca4d0
85bdfd88  85bd4680
85bdfd8c  00000000
85bdfd90  00000000
85bdfd94  00000000
85bdfd98  00000002
85bdfd9c  00000000
85bdfda0  00000000
85bdfda4  00000001
85bdfda8  85bdfd88
85bdfdac  85bdfdbc
85bdfdb0  ffffffff
85bdfdb4  81c8aad5 nt!_except_handler4
85bdfdb8  81c9ddb8 nt!`string'+0x4
85bdfdbc  00000000
85bdfdc0  00000000
85bdfdc4  81c9159e nt!KiThreadStartup+0x16
85bdfdc8  81c78ea3 nt!ExpWorkerThread
85bdfdcc  00000001
85bdfdd0  00000000
85bdfdd4  00000000
85bdfdd8  002e0069
85bdfddc  006c0064
85bdfde0  004c006c
85bdfde4  00000000
85bdfde8  000007f0
85bdfdec  00010000
85bdfdf0  0000027f
85bdfdf4  00000000
85bdfdf8  00000000
85bdfdfc  00000000
85bdfe00  00000000
85bdfe04  00000000
85bdfe08  00001f80
85bdfe0c  0000ffff
85bdfe10  00000000
85bdfe14  00000000
85bdfe18  00000000
[...]
85bdffe4  00000000
85bdffe8  00000000
85bdffec  00000000
85bdfff0  00000000
85bdfff4  00000000
85bdfff8  00000000
85bdfffc  00000000
85be0000  ????????
User minidumps are similar here:
0:001> k
ChildEBP RetAddr
099bfe14 7c90daaa ntdll!KiFastSystemCallRet
099bfe18 77e765e3 ntdll!NtReplyWaitReceivePortEx+0xc
099bff80 77e76caf rpcrt4!LRPC_ADDRESS::ReceiveLotsaCalls+0×12a
099bff88 77e76ad1 rpcrt4!RecvLotsaCallsWrapper+0xd
099bffa8 77e76c97 rpcrt4!BaseCachedThreadRoutine+0×79
099bffb4 7c80b729 rpcrt4!ThreadStartRoutine+0×1a
099bffec 00000000 kernel32!BaseThreadStart+0×37

0:001> dd 099bfe14
099bfe14  099bfe24 7c90daaa 77e765e3 00000224
099bfe24  099bff74 00000000 2db87ae8 099bff48
099bfe34  fbf58e18 00000040 fd629338 b279dbbc
099bfe44  fd5928b8 fbf58ebc b279dbbc e0c1e002
099bfe54  00000000 00000006 00000001 00000000
099bfe64  e637d218 00000000 00000006 00000006
099bfe74  00000006 e1f79698 e39b8b60 00000000
099bfe84  fbe33c40 00000001 e5ce12f8 b279db9c

0:001> dd 099bfe14-20
099bfdf4  ???????? ???????? ???????? ????????
099bfe04  ???????? ???????? ???????? ????????
099bfe14  099bfe24 7c90daaa 77e765e3 00000224
099bfe24  099bff74 00000000 2db87ae8 099bff48
099bfe34  fbf58e18 00000040 fd629338 b279dbbc
099bfe44  fd5928b8 fbf58ebc b279dbbc e0c1e002
099bfe54  00000000 00000006 00000001 00000000
099bfe64  e637d218 00000000 00000006 00000006
As a warning here it is possible to conclude that minidumps can also reveal private information especially when ASCII or Unicode buffers are seen on the raw stack data.
We named this pattern by analogy with an abridged book.
This is an obvious pattern that is shown in many pattern interaction case studies. We can also call it Exception Thread. This is a stack trace that has exception processing functions, for example:
9 Id: 1df4.a08 Suspend: -1 Teb: 7fff4000 Unfrozen ChildEBP RetAddr 1022f5a8 7c90df4a ntdll!KiFastSystemCallRet 1022f5ac 7c8648a2 ntdll!ZwWaitForMultipleObjects+0xc1022f900 7c83ab50 kernel32!UnhandledExceptionFilter+0×8b91022f908 7c839b39 kernel32!BaseThreadStart+0×4d 1022f930 7c9032a8 kernel32!_except_handler3+0×61 1022f954 7c90327a ntdll!ExecuteHandler2+0×26 1022fa04 7c90e48a ntdll!ExecuteHandler+0×241022fa04 7c812afb ntdll!KiUserExceptionDispatcher+0xe 1022fd5c 0b82e680 kernel32!RaiseException+0×531022fd94 0b82d2f2 DllA+0×21e640 1022fde8 7753004f DllA+0×21d4f2 1022fdfc 7753032f ole32!CClassCache::CDllPathEntry::CanUnload_rl+0×3b 1022ff3c 7753028b ole32!CClassCache::FreeUnused+0×70 1022ff4c 775300b5 ole32!CoFreeUnusedLibrariesEx+0×36 1022ff58 77596af5 ole32!CoFreeUnusedLibraries+0×9 1022ff6c 77566ff9 ole32!CDllHost::MTAWorkerLoop+0×25 1022ff8c 7752687c ole32!CDllHost::WorkerThread+0xc1 1022ff94 774fe3ee ole32!DLLHostThreadEntry+0xd 1022ffa8 774fe456 ole32!CRpcThread::WorkerLoop+0×1e 1022ffb4 7c80b729 ole32!CRpcThreadCache::RpcWorkerThreadEntry+0×1b 1022ffec 00000000 kernel32!BaseThreadStart+0×37
Such exceptions can be detected by the default analysis command (for example, !analyze -v WinDbg command) or by inspecting a stack trace collection (Volume 1, page 409). However, if we don't see any exception thread it doesn't mean there were no exceptions. There could be hidden exceptions (Volume 1, page 271) on raw stack data.
In our case we can get the exception information by looking at parameters to an unhandled exception filter:
0:009> kv 3
ChildEBP RetAddr Args to Child
1022f5a8 7c90df4a 7c8648a2 00000002 1022f730 ntdll!KiFastSystemCallRet
1022f5ac 7c8648a2 00000002 1022f730 00000001 ntdll!ZwWaitForMultipleObjects+0xc
1022f900 7c83ab50 1022f9280:009> .exptr 1022f928In addition to LPC / ALPC wait chains (Volume 3, page 97) we can also see RPC chains in complete memory dumps and even mixed (A)LPC / RPC chains. How to distinguish RPC from (A)LPC (and RPC over LPC) threads? Here's a fragment from an RPC over LPC thread (they also have "waiting for ..." or "working on ..." strings in THREAD output):
f50e4c20 80833491 nt!KiSwapContext+0x26 f50e4c4c 80829a82 nt!KiSwapThread+0x2e5 f50e4c94 8091ecf2 nt!KeWaitForSingleObject+0x346f50e4d50 808897cc nt!NtRequestWaitReplyPort+0×776f50e4d50 7c82860c nt!KiFastCallEntry+0xfc (TrapFrame @ f50e4d64) 00e5f2b8 7c827899 ntdll!KiFastSystemCallRet00e5f2bc 77c80a6e ntdll!ZwRequestWaitReplyPort+0xc 00e5f308 77c7fcf0 RPCRT4!LRPC_CCALL::SendReceive+0×23000e5f314 77c80673 RPCRT4!I_RpcSendReceive+0×24 00e5f328 77ce315a RPCRT4!NdrSendReceive+0×2b 00e5f710 771f40c4 RPCRT4!NdrClientCall2+0×22e
Here's the thread stack of an RPC waiting thread (the connection was over a pipe):
THREAD 8a4b7320  Cid 0208.0220  Teb: 7ffa4000 Win32Thread: bc3eaea8 WAIT:
(Unknown) UserMode Non-Alertable
       8bc379f8  NotificationEvent
IRP List:
       891879a8: (0006,0094) Flags: 00000800  Mdl: 00000000
Not impersonating
DeviceMap                 e1002270
Owning Process            8a5c8828       Image:         ApplicationA.exe
Attached Process          N/A            Image:         N/A
Wait Start TickCount      3044574        Ticks: 37746 (0:00:09:49.781)
Context Switch Count      54673                 LargeStack
UserTime                  00:00:00.015
KernelTime                00:00:00.046
Win32 Start Address MSVCR90!_threadstartex (0x7854345e)
Start Address kernel32!BaseThreadStartThunk (0x77e617ec)
Stack Init f473b000 Current f473ac60 Base f473b000 Limit f4737000 Call 0
Priority 11 BasePriority 10 PriorityDecrement 0
ChildEBP RetAddr
f473ac78 80833491 nt!KiSwapContext+0x26
f473aca4 80829a82 nt!KiSwapThread+0x2e5
f473acec 80938dea nt!KeWaitForSingleObject+0x346
f473ad50 808897cc nt!NtWaitForSingleObject+0x9a
f473ad50 7c82860c nt!KiFastCallEntry+0xfc (TrapFrame @ f473ad64)
0155f0f4 7c827d29 ntdll!KiFastSystemCallRet
0155f0f8 77e61d1e ntdll!ZwWaitForSingleObject+0xc
0155f168 77c6a85f kernel32!WaitForSingleObjectEx+0xac
0155f184 77c69bf7 RPCRT4!UTIL_WaitForSyncIO+0×20
0155f1a8 77c6a935 RPCRT4!UTIL_GetOverlappedResultEx+0×1d
0155f1c4 77c6a8f3 RPCRT4!UTIL_GetOverlappedResult+0×17
0155f1e4 77c6944f RPCRT4!NMP_SyncSendRecv+0×73
0155f20c 77c69667 RPCRT4!OSF_CCONNECTION::TransSendReceive+0×7d
0155f294 77c695d4 RPCRT4!OSF_CCONNECTION::SendFragment+0×2ae
0155f2ec 77c6977a RPCRT4!OSF_CCALL::SendNextFragment+0×1e2
0155f334 77c699f2 RPCRT4!OSF_CCALL::FastSendReceive+0×148
0155f350 77c69975 RPCRT4!OSF_CCALL::SendReceiveHelper+0×5b
0155f380 77c7fcf0 RPCRT4!OSF_CCALL::SendReceive+0×41Here's the endpoint thread stack in the RPC service processing the client call:
THREAD 8a631d80 Cid 0244.0290 Teb: 7ffd4000 Win32Thread: 00000000 WAIT:
(Unknown) UserMode Non-Alertable
8a6354d8 SynchronizationEvent
IRP List:
882d0008: (0006,0094) Flags: 00000900 Mdl: 00000000
8811c450: (0006,0094) Flags: 00000900 Mdl: 00000000
8a4d1b28: (0006,0190) Flags: 00000000 Mdl: 8a4d2e40
8a634188: (0006,0094) Flags: 00000800 Mdl: 00000000
Not impersonating
DeviceMap e1002270
Owning Process 8a5b3ac8 Image: ServiceB.exe
Attached Process N/A Image: N/A
Wait Start TickCount 3041752 Ticks: 40568 (0:00:10:33.875)
Context Switch Count 36194
UserTime 00:00:00.562
KernelTime 00:00:01.093
Win32 Start Address RPCRT4!ThreadStartRoutine (0x77c7b0f5)
Start Address kernel32!BaseThreadStartThunk (0x77e617ec)
Stack Init f5f3e000 Current f5f3dc60 Base f5f3e000 Limit f5f3b000 Call 0
Priority 12 BasePriority 10 PriorityDecrement 0
ChildEBP RetAddr
f5f3dc78 80833491 nt!KiSwapContext+0x26
f5f3dca4 80829a82 nt!KiSwapThread+0x2e5
f5f3dcec 80938dea nt!KeWaitForSingleObject+0x346
f5f3dd50 808897cc nt!NtWaitForSingleObject+0x9a
f5f3dd50 7c82860c nt!KiFastCallEntry+0xfc (TrapFrame @ f5f3dd64)
00def83c 7c827d29 ntdll!KiFastSystemCallRet
00def840 7c83d266 ntdll!ZwWaitForSingleObject+0xc
00def87c 7c83d2b1 ntdll!RtlpWaitOnCriticalSection+0×1a3
00def89c 4ab773ea ntdll!RtlEnterCriticalSection+0xa800defd94 77c8042d RPCRT4!DispatchToStubInCNoAvrf+0×38
00defde8 77c80353 RPCRT4!RPC_INTERFACE::DispatchToStubWorker+0×11f
00defe0c 77c68e0d RPCRT4!RPC_INTERFACE::DispatchToStub+0xa3
00defe40 77c68cb3 RPCRT4!OSF_SCALL::DispatchHelper+0×149
00defe54 77c68c2b RPCRT4!OSF_SCALL::DispatchRPCCall+0×10d
00defe84 77c68b5e RPCRT4!OSF_SCALL::ProcessReceivedPDU+0×57f
00defea4 77c6e8db RPCRT4!OSF_SCALL::BeginRpcCall+0×194
00deff04 77c6e7b4 RPCRT4!OSF_SCONNECTION::ProcessReceiveComplete+0×435
00deff18 77c7b799 RPCRT4!ProcessConnectionServerReceivedEvent+0×21
00deff84 77c7b9b5 RPCRT4!LOADABLE_TRANSPORT::ProcessIOEvents+0×1b8
00deff8c 77c8872d RPCRT4!ProcessIOEventsWrapper+0xd
00deffac 77c7b110 RPCRT4!BaseCachedThreadRoutine+0×9d
00deffb8 77e6482f RPCRT4!ThreadStartRoutine+0×1b
00deffec 00000000 kernel32!BaseThreadStart+0×34
We also see that the latter thread is waiting for a critical section so we have an example of a mixed wait chain here as well. Another example is an RPC over LPC server thread that is also an RPC client thread:
THREAD 8989f020 Cid 0170.1cfc Teb: 7ff8c000 Win32Thread: 00000000 WAIT:
(Unknown) UserMode Non-Alertable
    89a1c368 NotificationEvent
IRP List:
    887aac68: (0006,0094) Flags: 00000800 Mdl: 00000000
Not impersonating
DeviceMap                 e1002270
Owning Process            8a056b80      Image:        ServiceC.exe
Attached Process          N/A           Image:        N/A
Wait Start TickCount      3075354       Ticks: 6966 (0:00:01:48.843)
Context Switch Count      2521
UserTime                  00:00:00.031
KernelTime                00:00:00.015
Win32 Start Address 0x00750d91
LPC Server thread working on message Id 750d91
Start Address kernel32!BaseThreadStartThunk (0×77e617ec)
Stack Init f26da000 Current f26d9c60 Base f26da000 Limit f26d7000 Call 0
Priority 8 BasePriority 8 PriorityDecrement 0
ChildEBP RetAddr
f26d9c78 80833491 nt!KiSwapContext+0×26
f26d9ca4 80829a82 nt!KiSwapThread+0×2e5
f26d9cec 80938dea nt!KeWaitForSingleObject+0×346
f26d9d50 808897cc nt!NtWaitForSingleObject+0×9a
f26d9d50 7c82860c nt!KiFastCallEntry+0xfc (TrapFrame @ f26d9d64)
03e9efa8 7c827d29 ntdll!KiFastSystemCallRet
03e9efac 77e61d1e ntdll!ZwWaitForSingleObject+0xc
03e9f01c 77c6a85f kernel32!WaitForSingleObjectEx+0xac
03e9f038 77c69bf7 RPCRT4!UTIL_WaitForSyncIO+0×20
03e9f05c 77c6a935 RPCRT4!UTIL_GetOverlappedResultEx+0×1d
03e9f078 77c6a8f3 RPCRT4!UTIL_GetOverlappedResult+0×17
03e9f098 77c6944f RPCRT4!NMP_SyncSendRecv+0×73
03e9f0c0 77c69667 RPCRT4!OSF_CCONNECTION::TransSendReceive+0×7d
03e9f148 77c695d4 RPCRT4!OSF_CCONNECTION::SendFragment+0×2ae
03e9f1a0 77c6977a RPCRT4!OSF_CCALL::SendNextFragment+0×1e203e9f250 77c80673 RPCRT4!I_RpcSendReceive+0×24 03e9f264 77ce315a RPCRT4!NdrSendReceive+0×2b 03e9f64c 7d1fa0b1 RPCRT4!NdrClientCall2+0×22e 03e9f8ac 7654fa50 ServiceC!QueryInformation+0×801 [...] 03e9f8f8 77ce33e1 RPCRT4!Invoke+0×30 03e9fcf8 77ce35c4 RPCRT4!NdrStubCall2+0×299 03e9fd14 77c7ff7a RPCRT4!NdrServerCall2+0×19 03e9fd48 77c8042d RPCRT4!DispatchToStubInCNoAvrf+0×38 03e9fd9c 77c80353 RPCRT4!RPC_INTERFACE::DispatchToStubWorker+0×11f 03e9fdc0 77c811dc RPCRT4!RPC_INTERFACE::DispatchToStub+0xa303e9f1f8 77c699f2 RPCRT4!OSF_CCALL::FastSendReceive+0×148 03e9f214 77c69975 RPCRT4!OSF_CCALL::SendReceiveHelper+0×5b 03e9f244 77c7fcf0 RPCRT4!OSF_CCALL::SendReceive+0×4103e9fdfc 77c812f0 RPCRT4!LRPC_SCALL::DealWithRequestMessage+0×42c 03e9fe20 77c88678 RPCRT4!LRPC_ADDRESS::DealWithLRPCRequest+0×127 03e9ff84 77c88792 RPCRT4!LRPC_ADDRESS::ReceiveLotsaCalls+0×430 03e9ff8c 77c8872d RPCRT4!RecvLotsaCallsWrapper+0xd03e9ffac 77c7b110 RPCRT4!BaseCachedThreadRoutine+0×9d 03e9ffb8 77e6482f RPCRT4!ThreadStartRoutine+0×1b 03e9ffec 00000000 kernel32!BaseThreadStart+0×34
Abnormal CPU consumption detection usually goes at a process level when we detect it using Task Manager, for example. Sometimes that process has only one spiking thread (Volume 1, page 305) among many but there are cases when CPU consumption is spread among many threads. We call this pattern Distributed Spike. Such behavior could be a consequence of a weak process coupling (page 60), for example, in these 2 services (where, for simplicity, we highlight in bold threads with more than 1 second CPU time spent in user mode):
0:000> !runaway
 User Mode Time
  Thread       Time
 120:4e518      0 days 0:05:09.937
 126:531bc      0 days 0:03:56.546
  44:334c      0 days 0:03:40.765
 133:4fe1c      0 days 0:03:31.156
  45:42b4      0 days 0:03:27.328
 107:25ae0      0 days 0:03:19.921
  49:627c      0 days 0:02:48.250
 147:6b90c      0 days 0:02:33.046
 136:6620c      0 days 0:02:05.109
 127:4f2d0      0 days 0:02:04.046
 129:5bc30      0 days 0:02:02.171
  48:623c      0 days 0:02:01.796
 119:41f00      0 days 0:02:00.562
  74:cd18      0 days 0:01:59.453
  51:7a4c      0 days 0:01:54.234
  35:21d4      0 days 0:01:47.390
 148:326dc      0 days 0:01:32.640
 123:43c8c      0 days 0:01:32.515
 135:67b08      0 days 0:01:32.296
  11:aa8       0 days 0:01:30.906
 118:42f8c      0 days 0:01:20.265
  42:3a3c      0 days 0:01:20.000
  77:d024      0 days 0:01:19.734
 115:3a840      0 days 0:01:15.625
  89:145f4     0 days 0:01:10.500
 157:4e310      0 days 0:01:07.625
  80:d07c      0 days 0:01:07.468
  33:1ab0      0 days 0:01:00.593
 117:10bd4      0 days 0:00:59.421
 151:1aaa0     0 days 0:00:59.015
  28:17bc      0 days 0:00:58.796
  83:f3a4      0 days 0:00:55.828
 122:41964      0 days 0:00:55.578
 149:4101c      0 days 0:00:55.234
  10:aa4       0 days 0:00:52.453
 106:21b80     0 days 0:00:51.187
 132:62e5c     0 days 0:00:49.437
 160:3a3a8     0 days 0:00:48.875
 137:6bf90     0 days 0:00:48.687
 145:6f594     0 days 0:00:47.968
 143:58d60     0 days 0:00:45.703
  72:ba64     0 days 0:00:44.515
  41:19b0     0 days 0:00:44.000
 130:5d480     0 days 0:00:43.750
 139:6d090     0 days 0:00:42.062
 138:6d578     0 days 0:00:40.406
  91:17974    0 days 0:00:40.359
 152:37f80    0 days 0:00:39.781
  81:de68      0 days 0:00:39.265
 150:65b2c    0 days 0:00:36.625
 162:1f340    0 days 0:00:35.125
  85:10650     0 days 0:00:33.546
 131:614e8     0 days 0:00:33.093
 128:2eddc     0 days 0:00:33.000
 146:6f690     0 days 0:00:32.015
 161:3c4b4     0 days 0:00:30.421
 167:3cde4     0 days 0:00:29.390
 171:3979c     0 days 0:00:28.515
 166:3cd40     0 days 0:00:28.312
 168:68ef0     0 days 0:00:27.781
  65:aad0     0 days 0:00:26.593
 109:267f4     0 days 0:00:26.390
  88:13624    0 days 0:00:26.000
 173:5282c     0 days 0:00:24.640
 153:71e14     0 days 0:00:23.390
 112:322b4     0 days 0:00:22.812
 110:9578      0 days 0:00:22.125
 175:20230     0 days 0:00:20.250
  79:b458     0 days 0:00:20.218
  66:61b8     0 days 0:00:19.875
  62:9498     0 days 0:00:19.562
 156:d900      0 days 0:00:19.015
 121:5106c     0 days 0:00:18.687
 142:6bb28     0 days 0:00:18.562
  46:2cbc     0 days 0:00:17.796
 169:d920      0 days 0:00:16.875
 154:720b4     0 days 0:00:16.484
 170:4ac8c     0 days 0:00:15.968
  73:b010     0 days 0:00:13.609
  39:3224     0 days 0:00:13.406
 172:722e4     0 days 0:00:12.375
  63:9780     0 days 0:00:12.203
 177:8464      0 days 0:00:11.906
 184:22908     0 days 0:00:10.234
 140:5765c     0 days 0:00:09.750
 174:2f484     0 days 0:00:08.390
  50:7230     0 days 0:00:07.125
 187:3c324     0 days 0:00:06.765
 125:46cf0     0 days 0:00:06.296
 178:3a424     0 days 0:00:05.125
 114:33d20     0 days 0:00:03.734
 165:3ca74     0 days 0:00:01.203
 189:3c358     0 days 0:00:01.000
 164:3124c     0 days 0:00:00.578
  25:be4      0 days 0:00:00.515
  17:ba8      0 days 0:00:00.125
 104:5cf8     0 days 0:00:00.109
  26:e4c      0 days 0:00:00.109
  96:5d44     0 days 0:00:00.093
  99:5b18     0 days 0:00:00.078
  56:8a6c     0 days 0:00:00.078
  55:8a68     0 days 0:00:00.078
   6:a08      0 days 0:00:00.078
   4:a00      0 days 0:00:00.062
 103:5cfc     0 days 0:00:00.046
 100:5ab8     0 days 0:00:00.046
  68:bf34     0 days 0:00:00.046
  37:29d4     0 days 0:00:00.046
 101:5ab4     0 days 0:00:00.031
  98:5b44     0 days 0:00:00.031
  97:5d40     0 days 0:00:00.031
  57:8a70     0 days 0:00:00.031
  53:8a60     0 days 0:00:00.031
  36:29c0     0 days 0:00:00.031
  16:ac4      0 days 0:00:00.031
   1:9e4      0 days 0:00:00.031
  60:880c     0 days 0:00:00.015
  58:8a5c     0 days 0:00:00.015
  24:be0      0 days 0:00:00.015
  15:abc      0 days 0:00:00.015
 188:13044     0 days 0:00:00.000
 186:6530     0 days 0:00:00.000
 185:2013c     0 days 0:00:00.000
 183:6047c     0 days 0:00:00.000
 182:65400     0 days 0:00:00.000
 181:61560     0 days 0:00:00.000
 180:2b7a4     0 days 0:00:00.000
 179:56294     0 days 0:00:00.000
 176:20300     0 days 0:00:00.000
 163:2ab1c     0 days 0:00:00.000
 159:276cc     0 days 0:00:00.000
 158:72134     0 days 0:00:00.000
 155:6a078     0 days 0:00:00.000
 144:6ce98     0 days 0:00:00.000
 141:5404     0 days 0:00:00.000
 134:65718     0 days 0:00:00.000
 124:4bed4     0 days 0:00:00.000
 116:3c770     0 days 0:00:00.000
 113:b08      0 days 0:00:00.000
 111:28e54     0 days 0:00:00.000
 108:25fbc     0 days 0:00:00.000
 105:20504     0 days 0:00:00.000
 102:5cf4     0 days 0:00:00.000
  95:5c70     0 days 0:00:00.000
  94:5ed4     0 days 0:00:00.000
  93:18c2c     0 days 0:00:00.000
  92:19fd8     0 days 0:00:00.000
  90:c870     0 days 0:00:00.000
  87:7994     0 days 0:00:00.000
  86:124cc     0 days 0:00:00.000
  84:eab8     0 days 0:00:00.000
  82:f2a4     0 days 0:00:00.000
  78:d5c0     0 days 0:00:00.000
  76:cfd0     0 days 0:00:00.000
  75:cf64     0 days 0:00:00.000
  71:b4f8     0 days 0:00:00.000
  70:c628     0 days 0:00:00.000
  69:c484     0 days 0:00:00.000
  67:be84     0 days 0:00:00.000
  64:aa00     0 days 0:00:00.000
  61:93f0     0 days 0:00:00.000
  59:89e4     0 days 0:00:00.000
  54:8a64     0 days 0:00:00.000
  52:89a8     0 days 0:00:00.000
  47:4c64     0 days 0:00:00.000
  43:3fa0     0 days 0:00:00.000
  40:2c88     0 days 0:00:00.000
  38:2a28     0 days 0:00:00.000
  34:1928     0 days 0:00:00.000
  32:1668     0 days 0:00:00.000
  31:8dc      0 days 0:00:00.000
  30:15d4     0 days 0:00:00.000
  29:1044     0 days 0:00:00.000
  27:fb4      0 days 0:00:00.000
  23:bd8      0 days 0:00:00.000
  22:bd4      0 days 0:00:00.000
  21:bd0      0 days 0:00:00.000
  20:bc8      0 days 0:00:00.000
  19:bc4      0 days 0:00:00.000
  18:bc0      0 days 0:00:00.000
  14:ab8      0 days 0:00:00.000
  13:ab4      0 days 0:00:00.000
  12:ab0      0 days 0:00:00.000
   9:aa0      0 days 0:00:00.000
   8:a9c      0 days 0:00:00.000
   7:a98      0 days 0:00:00.000
   5:a04      0 days 0:00:00.000
   3:9f4      0 days 0:00:00.000
   2:9f0      0 days 0:00:00.000
   0:994      0 days 0:00:00.000
This is a real spike in the first service process as can be confirmed by a random non-waiting thread:
0:000> ~143k
ChildEBP RetAddr
050dfc68 7c82d6a4 ntdll!RtlEnterCriticalSection+0x1d
050dfc84 77c7bc50 ntdll!RtlInitializeCriticalSectionAndSpinCount+0x92
050dfc98 77c7bc7c rpcrt4!MUTEX::CommonConstructor+0x1b
050dfcac 77c7c000 rpcrt4!MUTEX::MUTEX+0x13
050dfcc8 77c6ff47 rpcrt4!BINDING_HANDLE::BINDING_HANDLE+0x2d
050dfcd8 77c6ff1f rpcrt4!SVR_BINDING_HANDLE::SVR_BINDING_HANDLE+0x10
050dfcfc 77c6d338 rpcrt4!RPC_ADDRESS::InquireBinding+0x8a
050dfd0c 77c6fd1d rpcrt4!LRPC_SCALL::ToStringBinding+0x16
050dfd1c 76554c83 rpcrt4!RpcBindingToStringBindingW+0x4d
050dfd5c 77c7c42a ServiceA!RpcSecurityCallback+0x1e
050dfdb4 77c7c4b0 rpcrt4!RPC_INTERFACE::CheckSecurityIfNecessary+0x6f
050dfdcc 77c7c46c rpcrt4!LRPC_SBINDING::CheckSecurity+0x4f
050dfdfc 77c812f0 rpcrt4!LRPC_SCALL::DealWithRequestMessage+0x2bb
050dfe20 77c88678 rpcrt4!LRPC_ADDRESS::DealWithLRPCRequest+0x127
050dff84 77c88792 rpcrt4!LRPC_ADDRESS::ReceiveLotsaCalls+0x430
050dff8c 77c8872d rpcrt4!RecvLotsaCallsWrapper+0xd
050dffac 77c7b110 rpcrt4!BaseCachedThreadRoutine+0x9d
050dffb8 77e64829 rpcrt4!ThreadStartRoutine+0x1b
050dffec 00000000 kernel32!BaseThreadStart+0x34

0:000> ~143r
eax=00000000 ebx=00000000 ecx=7c887784 edx=7c887780 esi=7c887784
edi=00163fb0
eip=7c81a37d esp=050dfc5c ebp=050dfc68 iopl=0 nv up ei ng nz na pe cy
cs=001b ss=0023 ds=0023 es=0023 fs=003b gs=0000 efl=00000287
ntdll!RtlEnterCriticalSection+0x1d:
7c81a37d 0f92c0          setb    al

0:000> .asm no_code_bytes
Assembly options: no_code_bytes

0:000> u 7c81a37d
ntdll!RtlEnterCriticalSection+0x1d:
7c81a37d setb    al
7c81a380 test    al,al
7c81a382 je      ntdll!RtlEnterCriticalSection+0x28 (7c82b096)
7c81a388 mov     ecx,dword ptr fs:[18h]
7c81a38f mov     eax,dword ptr [ecx+24h]
7c81a392 pop     edi
7c81a393 mov     dword ptr [edx+0Ch],eax
7c81a396 mov     dword ptr [edx+8],1
0:000> ub 7c81a37d
ntdll!RtlEnterCriticalSection+0x6:
7c81a366 mov     edx,dword ptr [ebp+8]
7c81a369 push    esi
7c81a36a lea     esi,[edx+4]
7c81a36d push    edi
7c81a36e mov     dword ptr [ebp-4],esi
7c81a371 mov     eax,0
7c81a376 mov     ecx,dword ptr [ebp-4]
7c81a379 lock btr dword ptr [ecx],eax
The second service is weakly (waiting for event notifications) coupled to the first service above:
0:000> !runaway
User Mode Time
Thread Time
5:dbec 0 days 0:01:50.031
8:46008 0 days 0:01:46.062
11:ad0c 0 days 0:01:13.921
17:932c 0 days 0:01:03.234
14:45d78 0 days 0:00:58.1090:000> ~17k ChildEBP RetAddr 0283fa68 7c82787b ntdll!KiFastSystemCallRet 0283fa6c 77c80a6e ntdll!NtRequestWaitReplyPort+0xc 0283fab8 77c7fcf0 rpcrt4!LRPC_CCALL::SendReceive+0x230 0283fac4 77c80673 rpcrt4!I_RpcSendReceive+0x24 0283fad8 77ce315a rpcrt4!NdrSendReceive+0x2b 0283fec0 771f4fbd rpcrt4!NdrClientCall2+0x22e 0283fed8 771f4f60 ServiceB!RpcWaitEvent+0x1c [...]
Sometimes, semantic process coupling (page 87) also results in distributed spikes and most often it is possible to predict another spiking process in such cases. In our example above both spiking processes were semantically coupled with another service and it was confirmed that it was spiking too:
0:000> !runaway
 User Mode Time
  Thread        Time
  89:10d4       0 days 0:03:03.500
  28:a94        0 days 0:00:39.562
  73:c10        0 days 0:00:37.531
  54:b88        0 days 0:00:37.140
  29:a98        0 days 0:00:35.906
  27:a90        0 days 0:00:35.500
  75:c2c        0 days 0:00:28.812
  90:10d8       0 days 0:00:27.000
  93:10e4       0 days 0:00:24.265
  32:aa4        0 days 0:00:12.906
  41:ac8        0 days 0:00:11.890
  35:ab0        0 days 0:00:11.875
  58:bc4        0 days 0:00:10.218
  42:acc        0 days 0:00:09.546
  85:e74        0 days 0:00:08.859
  36:ab4        0 days 0:00:08.578
  72:c0c        0 days 0:00:05.890
  70:c04        0 days 0:00:05.687
  33:aa8        0 days 0:00:05.046
  74:c14        0 days 0:00:04.953
  40:ac4        0 days 0:00:04.953
  38:abc        0 days 0:00:04.359
  39:ac0        0 days 0:00:04.312
  34:aac        0 days 0:00:04.140
  64:bec        0 days 0:00:03.812
  88:10d0       0 days 0:00:03.187
  30:a9c        0 days 0:00:02.859
   9:a10        0 days 0:00:01.968
  37:ab8        0 days 0:00:01.953
  92:10e0       0 days 0:00:01.718
  83:d00        0 days 0:00:01.125
  94:1150       0 days 0:00:01.031
  77:c54        0 days 0:00:00.890
  98:f2c0       0 days 0:00:00.265
  97:eb1c       0 days 0:00:00.265
  76:c50        0 days 0:00:00.265
  21:a48        0 days 0:00:00.187
  22:a4c        0 days 0:00:00.140
  63:be8        0 days 0:00:00.093
  23:a50        0 days 0:00:00.093
  53:af8        0 days 0:00:00.078
  24:a54        0 days 0:00:00.046
  71:c08        0 days 0:00:00.031
  65:bf0        0 days 0:00:00.031
  87:e8c        0 days 0:00:00.015
  57:bc0        0 days 0:00:00.015
 104:6454c       0 days 0:00:00.000
 103:63fb4       0 days 0:00:00.000
 102:3c5ec       0 days 0:00:00.000
 101:65178       0 days 0:00:00.000
 100:5d0e4       0 days 0:00:00.000
  99:5bae4       0 days 0:00:00.000
  96:574        0 days 0:00:00.000
  95:b84        0 days 0:00:00.000
  91:10dc       0 days 0:00:00.000
  86:e88        0 days 0:00:00.000
  84:e70        0 days 0:00:00.000
  82:c84        0 days 0:00:00.000
  81:c68        0 days 0:00:00.000
  80:c64        0 days 0:00:00.000
  79:c60        0 days 0:00:00.000
  78:c5c        0 days 0:00:00.000
  69:c00        0 days 0:00:00.000
  68:bfc        0 days 0:00:00.000
  67:bf8        0 days 0:00:00.000
  66:bf4        0 days 0:00:00.000
  62:bd8        0 days 0:00:00.000
  61:bd4        0 days 0:00:00.000
  60:bd0        0 days 0:00:00.000
  59:bcc        0 days 0:00:00.000
  56:bbc        0 days 0:00:00.000
  55:bb8        0 days 0:00:00.000
  52:af4        0 days 0:00:00.000
  51:af0        0 days 0:00:00.000
  50:aec        0 days 0:00:00.000
  49:ae8        0 days 0:00:00.000
  48:ae4        0 days 0:00:00.000
  47:ae0        0 days 0:00:00.000
  46:adc        0 days 0:00:00.000
  45:ad8        0 days 0:00:00.000
  44:ad4        0 days 0:00:00.000
  43:ad0        0 days 0:00:00.000
  31:aa0        0 days 0:00:00.000
  26:a8c        0 days 0:00:00.000
  25:a64        0 days 0:00:00.000
  20:a44        0 days 0:00:00.000
  19:a40        0 days 0:00:00.000
  18:a34        0 days 0:00:00.000
  17:a30        0 days 0:00:00.000
  16:a2c        0 days 0:00:00.000
  15:a28        0 days 0:00:00.000
  14:a24        0 days 0:00:00.000
  13:a20        0 days 0:00:00.000
  12:a1c        0 days 0:00:00.000
  11:a18        0 days 0:00:00.000
  10:a14        0 days 0:00:00.000
   8:a0c        0 days 0:00:00.000
   7:a08        0 days 0:00:00.000
   6:a04        0 days 0:00:00.000
   5:a00        0 days 0:00:00.000
   4:9fc        0 days 0:00:00.000
   3:9f8        0 days 0:00:00.000
   2:9f4        0 days 0:00:00.000
   1:9f0        0 days 0:00:00.000
   0:9e4        0 days 0:00:00.000
Application and Driver Verifiers (including gflags.exe tool from Debugging Tools for Windows) set flags that modify the behaviour of the system that is reflected in additional information being collected such as memory allocation history and in WinDbg output changes such as stack traces. These tools belong to a broad class of instrumentation tools. To check in a minidump, kernel and complete memory dumps whether Driver Verifier was enabled we use !verifier WinDbg command:
1: kd> !verifier

Verify Level 0 ... enabled options are:

Summary of All Verifier Statistics

RaiseIrqls                             0x0
AcquireSpinLocks                       0x0
Synch Executions                       0x0
Trims                                  0x0

Pool Allocations Attempted             0x0
Pool Allocations Succeeded             0x0
Pool Allocations Succeeded SpecialPool 0x0
Pool Allocations With NO TAG           0x0
Pool Allocations Failed                0x0
Resource Allocations Failed Deliberately   0x0

Current paged pool allocations         0x0 for 00000000 bytes
Peak paged pool allocations            0x0 for 00000000 bytes
Current nonpaged pool allocations      0x0 for 00000000 bytes
Peak nonpaged pool allocations         0x0 for 00000000 bytes

0: kd> !verifier

Verify Level 3 ... enabled options are:
       Special pool
       Special irql

Summary of All Verifier Statistics

RaiseIrqls                             0xdea5
AcquireSpinLocks                       0x87b5c
Synch Executions                       0x17b5
Trims                                  0xab36

Pool Allocations Attempted             0x8990e
Pool Allocations Succeeded             0x8990e
Pool Allocations Succeeded SpecialPool 0x29c0
Pool Allocations With NO TAG           0x1
Pool Allocations Failed                0x0
Resource Allocations Failed Deliberately   0x0

Current paged pool allocations         0x0 for 00000000 bytes
Peak paged pool allocations            0x0 for 00000000 bytes
Current nonpaged pool allocations      0x0 for 00000000 bytes
Peak nonpaged pool allocations         0x0 for 00000000 bytes
To check in a process user dump that Application Verifier (and gflags) was enabled we use !avrf and !gflags WinDbg extension commands:
0:001> !avrf
Application verifier is not enabled for this process.
Page heap has been enabled separately.

0:001> !gflag
Current NtGlobalFlag contents: 0x02000000
    hpa - Place heap allocations at ends of pages
Here is an example of an instrumented stack trace:
68546e88verifier!AVrfpDphFindBusyMemoryNoCheck+0xb8 68546f95 verifier!AVrfpDphFindBusyMemory+0×15 68547240 verifier!AVrfpDphFindBusyMemoryAndRemoveFromBusyList+0×20 68549080 verifier!AVrfDebugPageHeapFree+0×90 77190aac ntdll!RtlFreeHeap+0×2f 7714a8ff ntdll!RtlpFreeHeap+0×5d 770f2a32 ntdll!RtlFreeHeap+0×142 75fb14d1 kernel32!HeapFree+0×14 748d4c39 msvcr80!free+0xcd [...] 00a02bb2 ServiceA!ServiceMain+0×302 767175a8 sechost!ScSvcctrlThreadA+0×21 75fb3677 kernel32!BaseThreadInitThunk+0xe 770f9d42 ntdll!__RtlUserThreadStart+0×70 770f9d15 ntdll!_RtlUserThreadStart+0×1bDebug
Here is another example that shows instrumentation difference. We run double free fault modeling application and see its stack trace from a crash dump:
0:000> !gflag
Current NtGlobalFlag contents: 0×00000000
0:000> kL 100
Child-SP          RetAddr           Call Site
00000000`002dec38 00000000`77735ce2 ntdll!NtWaitForSingleObject+0xa
00000000`002dec40 00000000`77735e85 ntdll!RtlReportExceptionEx+0x1d2
00000000`002ded30 00000000`77735eea ntdll!RtlReportException+0xb5
00000000`002dedb0 00000000`77736d25 ntdll!RtlpTerminateFailureFilter+0x1a
00000000`002dede0 00000000`77685148 ntdll!RtlReportCriticalFailure+0x96
00000000`002dee10 00000000`776a554d ntdll!_C_specific_handler+0x8c
00000000`002dee80 00000000`77685d1c ntdll!RtlpExecuteHandlerForException+0xd
00000000`002deeb0 00000000`776862ee ntdll!RtlDispatchException+0x3cb
00000000`002df590 00000000`77736cd2 ntdll!RtlRaiseException+0x221
00000000`002dfbd0 00000000`77737396 ntdll!RtlReportCriticalFailure+0x62
00000000`002dfca0 00000000`777386c2 ntdll!RtlpReportHeapFailure+0x26
00000000`002dfcd0 00000000`7773a0c4 ntdll!RtlpHeapHandleError+0x12
00000000`002dfd00 00000000`776dd1cd ntdll!RtlpLogHeapFailure+0xa4
00000000`002dfd30 00000000`77472c7a ntdll! ?? ::FNODOBFM::`string'+0x123b4
00000000`002dfdb0 00000000`6243c7bc kernel32!HeapFree+0xa
00000000`002dfde0 00000001`3f8f1033 msvcr90!free+0x1c
00000000`002dfe10 00000001`3f8f11f2 InstrumentedApp!wmain+0x33
00000000`002dfe50 00000000`7746f56d InstrumentedApp!__tmainCRTStartup+0x11a
00000000`002dfe80 00000000`776a3281 kernel32!BaseThreadInitThunk+0xd
00000000`002dfeb0 00000000`00000000 ntdll!RtlUserThreadStart+0x1d
Then we enable Application Verifier and full page heap in gflags.exe GUI. Actually 2 crash dumps are saved LocalDumps (Volume 1, pageat the same 606) registry key on x64 W2K8 R2) with slightly different stack traces:
0:000> !gflag
Current NtGlobalFlag contents: 0x02000100
vrf - Enable application verifier
hpa - Place heap allocations at ends of pages
0:000> kL 100
Child-SP RetAddr Call Site
00000000`0022e438 00000000`77735ce2 ntdll!NtWaitForSingleObject+0xa
00000000`0022e440 00000000`77735e85 ntdll!RtlReportExceptionEx+0x1d2
00000000`0022e530 000007fe`f3ed26fb ntdll!RtlReportException+0xb5
00000000`0022e5b0 00000000`77688a8f verifier!AVrfpVectoredExceptionHandler+0×26b
00000000`0022e640 00000000`776859b2 ntdll!RtlpCallVectoredHandlers+0xa8
00000000`0022e6b0 00000000`776bfe48 ntdll!RtlDispatchException+0×22
00000000`0022ed90 000007fe`f3eca668 ntdll!KiUserExceptionDispatcher+0×2e
00000000`0022f350 000007fe`f3ec931d verifier!VerifierStopMessage+0×1f0
00000000`0022f400 000007fe`f3ec9736 verifier!AVrfpDphReportCorruptedBlock+0×155
00000000`0022f4c0 000007fe`f3ec99cd verifier!AVrfpDphCheckNormalHeapBlock+0xce
00000000`0022f530 000007fe`f3ec873a verifier!AVrfpDphNormalHeapFree+0×29
00000000`0022f560 00000000`7773c415 verifier!AVrfDebugPageHeapFree+0xb6
00000000`0022f5c0 00000000`776dd0fe ntdll!RtlDebug00000000`0022f9e0 00000000`77472c7a verifier!AVrfpRtlFreeHeap+0xa5
00000000`0022fa80 000007fe`f3ee09ae kernel32!HeapFree+0xa
00000000`0022fab0 00000000`642bc7bc verifier!AVrfpHeapFree+0xc6
00000000`0022fb40 00000001`3fac1033 msvcr90!free+0×1c
00000000`0022fb70 00000001`3fac11f2 InstrumentedApp!wmain+0×33
00000000`0022fbb0 00000000`7746f56d InstrumentedApp!__tmainCRTStartup+0×11a
00000000`0022fbe0 00000000`776a3281 kernel32!BaseThreadInitThunk+0xd
00000000`0022fc10 00000000`00000000 ntdll!RtlUserThreadStart+0×1d
0:000> kL 100 Child-SP RetAddr Call Site 00000000`0022e198 000007fe`f3ee0f82 ntdll!NtWaitForMultipleObjects+0xa00000000`0022e1a0 000007fe`fd8513a6 verifier!AVrfpNtWaitForMultipleObjects+0×4e00000000`0022e1e0 000007fe`f3ee0e2d KERNELBASE!WaitForMultipleObjectsEx+0xe800000000`0022e2e0 000007fe`f3ee0edd verifier!AVrfpWaitForMultipleObjectsExCommon+0xad 00000000`0022e320 00000000`77473143 verifier!AVrfpKernelbaseWaitForMultipleObjectsEx+0×2d00000000`0022e370 00000000`774e9025 kernel32!WaitForMultipleObjectsExImplementation+0xb3 00000000`0022e400 00000000`774e91a7 kernel32!WerpReportFaultInternal+0×215 00000000`0022e4a0 00000000`774e91ff kernel32!WerpReportFault+0×77 00000000`0022e4d0 00000000`774e941c kernel32!BasepReportFault+0×1f 00000000`0022e500 00000000`7770573c kernel32!UnhandledExceptionFilter+0×1fc 00000000`0022e5e0 00000000`77685148 ntdll! ?? 00000000`0022e610 00000000`776a554d ntdll!_C_specific_handler+0×8c 00000000`0022e680 00000000`77685d1c ntdll!RtlpExecuteHandlerForException+0xd 00000000`0022e6b0 00000000`776bfe48 ntdll!RtlDispatchException+0×3cb 00000000`0022ed90 000007fe`f3eca668 ntdll!KiUserExceptionDispatcher+0×2e00000000`0022f350 000007fe`f3ec931d verifier!VerifierStopMessage+0×1f0 00000000`0022f400 000007fe`f3ec9736 verifier!AVrfpDphReportCorruptedBlock+0×155 00000000`0022f4c0 000007fe`f3ec99cd verifier!AVrfpDphCheckNormalHeapBlock+0xce 00000000`0022f530 000007fe`f3ec873a verifier!AVrfpDphNormalHeapFree+0×29 00000000`0022f560 00000000`7773c415 verifier!AVrfDebugPageHeapFree+0xb600000000`0022f5c0 00000000`776dd0fe ntdll!RtlFreeHeap+0×35 00000000`0022f620 00000000`776c2075 ntdll! ?? ::FNODOBFM::`string'+0×122e2 00000000`0022f960 000007fe`f3edf4e1 ntdll!RtlFreeHeap+0×1a2Debug00000000`0022f9e0 00000000`77472c7a verifier!AVrfpRtlFreeHeap+0xa500000000`0022fa80 000007fe`f3ee09ae kernel32!HeapFree+0xa00000000`0022fab0 00000000`642bc7bc verifier!AVrfpHeapFree+0xc600000000`0022fb40 00000001`3fac1033 msvcr90!free+0×1c 00000000`0022fb70 00000001`3fac11f2 InstrumentedApp!wmain+0×33 00000000`0022fbb0 00000000`7746f56d InstrumentedApp!__tmainCRTStartup+0×11a 00000000`0022fbe0 00000000`776a3281 kernel32!BaseThreadInitThunk+0xd 00000000`0022fc10 00000000`00000000 ntdll!RtlUserThreadStart+0×1d
We also see above that enabling instrumentation triggers debug functions of run-time heap (RtlDebugFreeHeap).
It is a common technique in driver development to copy/paste an entire driver sample from WDK and modify it for a specific device or a filter valueadding functionality in a specific driver stack or framework. The problem here is that developers sometimes forget to change module resources and certain amount of detective work is required to find out the module vendor. Here is an example. In a spooler service there were many threads blocked in displaying a dialog box:
0:000> ~34kL 100 Child-SP RetAddr Call Site 00000000`08a49368 00000000`774c5118 user32!NtUserWaitMessage+0xa 00000000`08a49370 00000000`774c5770 user32!DialogBox2+0x261 00000000`08a493f0 00000000`774c57e6 user32!InternalDialogBox+0x134 00000000`08a49450 00000000`774c3e36 user32!DialogBoxIndirectParamAorW+0x58 00000000`08a49490 000007fe`fa27cc97 user32!DialogBoxParamW+0x66 00000000`08a494d0 000007fe`fa28832b unidrvui!ICheckConstraintsDlg+0xbf 00000000`08a49950 000007fe`fa29423d unidrvui!BUpdateUISettingForOEM+0x2f 00000000`08a49980 00000000`50036d2c unidrvui!CPrintOemDriverUI::DrvUpdateUISetting+0x1d[...] 00000000`08a4b250 000007fe`f759546b unidrvui!OEMDevicePropertySheets+0×56 00000000`08a4b280 000007fe`f759653e compstui!CallpfnPSUI+0×137 00000000`08a4b330 000007fe`f7596b84 compstui!InsertPSUIPage+0×24a 00000000`08a4b5f0 000007fe`fa2880e9 compstui!CPSUICallBack+0×3ec 00000000`08a4b6a0 000007fe`fa2836c4 unidrvui!BAddOemPluginPages+0×12d 00000000`08a4b6d0 000007fe`f759546b unidrvui!DrvDevicePropertySheets+0×2c8 00000000`08a4bb60 000007fe`f759653e compstui!CallpfnPSUI+0×137 00000000`08a4bc10 000007fe`f7596b84 compstui!InsertPSUIPage+0×24a 00000000`08a4bed0 000007fe`fb452838 compstui!CPSUICallBack+0×3ec 00000000`08a4bf80 000007fe`f759546b winspool!DevicePropertySheets+0×108 00000000`08a4bfb0 000007fe`f759653e compstui!CallpfnPSUI+0×137 00000000`08a4c060 000007fe`f7596b84 compstui!InsertPSUIPage+0×24a 00000000`08a4c320 000007fe`f759758e compstui!CPSUICallBack+0×3ec 00000000`08a4c3d0 000007fe`f75976b2 compstui!DoCommonPropertySheetUI+0xbe 00000000`08a4c430 000007fe`fb446339 compstui!CommonPropertySheetUIW+0xe 00000000`08a4c470 000007fe`fb44b425 winspool!CallCommonPropertySheetUI+0×65 00000000`08a4c4c0 00000000`5003623c winspool!PrinterPropertiesNative+0×12100000000`08a499b0 00000000`50038a1d ModuleZ!DllGetClassObject+0×1fe74[...] 00000000`08a4dd70 000007fe`fb4472d8 unidrvui!DrvPrinterEvent+0×419 00000000`08a4de00 000007fe`fb44737f winspool!SpoolerPrinterEventNative+0×84 00000000`08a4de60 000007fe`faedc957 winspool!SpoolerPrinterEvent+0×13 00000000`08a4dea0 000007fe`faedc8c7 localspl!SplDriverEvent+0×4f 00000000`08a4def0 000007fe`faec3d74 localspl!PrinterDriverEvent+0xcf 00000000`08a4df30 000007fe`fa771f20 localspl!SplAddPrinter+0xae0 00000000`08a4e4e0 000007fe`fa7491d8 win32spl!NCSRCommon::TLocalPrinter::AddPrinterW+0xb4 00000000`08a4e5b0 000007fe`fa747511 win32spl!TPrintOpen::AddLocalPrinter+0xb8 00000000`08a4e6b0 000007fe`fa746dfb win32spl!TPrintOpen::AddAndInstallLocalPrinter+0×34d 00000000`08a4e830 000007fe`fa746bb0 win32spl!TPrintOpen::ReEstablishCacheConnectionNoGuidPrinter+0×157 00000000`08a4e900 000007fe`fa7467d1 win32spl!TPrintOpen::ReEstablishCacheConnection+0×178 00000000`08a4e980 000007fe`fa7465c1 win32spl!TPrintOpen::ReEstablishPrinterConnection+0×16d 00000000`08a4ea30 000007fe`fa73e5ad win32spl!TPrintOpen::ReEstablishConnectionFromKey+0×1fd 00000000`08a4eb30 000007fe`fa733492 win32spl!TPrintOpen::RediscoverPrinterConnections+0xd7 00000000`08a4ebe0 000007fe`fb3f2332 win32spl!TPrintProviderTable::forwardEnumPrinters+0×47 00000000`08a4ec70 00000000`ff3414c8 spoolss!EnumPrintersW+0×176 00000000`08a4ed20 00000000`ff3413cc spoolsv!YEnumPrinters+0×112 00000000`08a4eda0 000007fe`fe225ec5 spoolsv!RpcEnumPrinters+0×30 00000000`08a4edf0 000007fe`fe2bebed rpcrt4!Invoke+0×6500000000`08a4c950 00000000`50035d16 ModuleZ!DllGetClassObject+0×1f384
00000000`08a4ee70 000007fe`fe1f5df0 rpcrt4!Ndr64StubWorker+0×5a9
00000000`08a4f440 000007fe`fe2268d4 rpcrt4!NdrServerCallAll+0×40
00000000`08a4f490 000007fe`fe2269f0 rpcrt4!DispatchToStubInCNoAvrf+0×14
00000000`08a4f4c0 000007fe`fe227402 rpcrt4!RPC_INTERFACE::DispatchToStubWorker+0×100
00000000`08a4f5b0 000007fe`fe227080 rpcrt4!LRPC_SCALL::DispatchRequest+0×1c2
00000000`08a4f620 000007fe`fe2262bb rpcrt4!LRPC_SCALL::HandleRequest+0×200
00000000`08a4f740 000007fe`fe225e1a rpcrt4!LRPC_ADDRESS::ProcessIO+0×44a
00000000`08a4f860 000007fe`fe207769 rpcrt4!LOADABLE_TRANSPORT::ProcessIOEvents+0×24a
00000000`08a4f910 000007fe`fe207714 rpcrt4!ProcessIOEventsWrapper+0×9
00000000`08a4f940 000007fe`fe2077a4 rpcrt4!BaseCachedThreadRoutine+0×94
00000000`08a4f980 00000000`7758be3d rpcrt4!ThreadStartRoutine+0×24
00000000`08a4f9b0 00000000`776c6a51 kernel32!BaseThreadInitThunk+0xd
00000000`08a4f9e0 00000000`00000000 ntdll!RtlUserThreadStart+0×1d
We suspect ModuleZ but its module information points to Microsoft:
0:000> lmv m ModuleZ
start end module name
00000000`50000000 00000000`500a4000 ModuleZ (export
symbols) ModuleZ.DLL
Loaded symbol image file: ModuleZ.DLL
Image path: C:WindowsSystem32spooldriversx643ModuleZ.DLL
Image name: ModuleZ.DLL
Timestamp: Feb [...] 2010CompanyName: Microsoft Corp.
ProductName: Microsoft PS UI ReplacementSampleSample
LegalCopyright: Copyright © 1998 - 2009 Microsoft Corp.
LegalTrademarks: Microsoft⌋ is a registered trademark of Microsoft
Corporation. Windows(TM) is a trademark of Microsoft Corporation
Comments: Written by Windows Printing & Imaging Team
Having never seen ModuleZ in Microsoft module lists and suspecting the word "Sample" in a file and product description we did Internet search and found the module name on various "DLL fixing" websites but still pointing to Microsoft in module descrip-tion. However, in a full module list (lmt WinDbg command) we found more modules having Module* name structure:
0:000> lmv m ModuleC
start                end              module name
00000000`10000000 00000000`100b7000   ModuleC   (deferred)
    Image path: C:WindowsSystem32spooldriversx643ModuleC.DLL
    Image name: ModuleC.DLL
    Timestamp:        Feb [...] 2010
    [...]
    File version:     20.1.0.0
    Product version:  20.1.0.0
    File flags:       0 (Mask 17)
    File OS:          4 Unknown Win32
    File type:        2.0 Dll
    File date:        00000000.00000000
    Translations:     0409.04b0
    CompanyName:
    ProductName:      Printer Driver
    InternalName:     MC.dll
    OriginalFilename: MC.dll
    ProductVersion:   20.1.0.0
    FileVersion:      20.1.0.0
    FileDescription:  Printer Driver
    LegalCopyright:

0:000> lmv m ModuleO
start                end                  module name
00000000`6f280000    00000000`6f2e2000    ModuleO   (deferred)
    Image path: C:WindowsSystem32spooldriversx643ModuleO.DLL
    Image name: ModuleO.DLL
    Timestamp:        Feb [...] 2010
    [...]
    File version:     2.4.0.0
    Product version:  2.4.0.0
    File flags:       8 (Mask 3F) Private
    File OS:          40004 NT Win32
    File type:        3.1 Driver
    File date:        00000000.00000000
    Translations:     0409.04b0
    CompanyName:      CompanyA
    ProductName:      CompanyA Printer driver
    InternalName:     ModuleO.dll
    OriginalFilename: ModuleO.dll
    ProductVersion:   2.4
    FileVersion:      2.4.0.0
    FileDescription:  CompanyA Printer driver
    LegalCopyright:   Copyright © CompanyA
    Comments:
We see that both module names and time stamps follow the same pattern so our "Microsoft" ModuleZ is definitely We also check more detailed from information:
0:000> !lmi 00000000`50000000
Loaded Module Info: [00000000`50000000]
Module: ModuleZ
[...]
Pdb: N:ServerQ[...]Pdb: N:ServerQ[...]Pdb: N:ServerQ[...]All three modules have the same build server in their PDB file name path. We advise to contact CompanyA for updates.
Here we show how to recognize this pattern and get a stack trace right when a debugger is not able to locate a crash point. For example, WinDbg default analysis command is not able to locate the exception context for a crash and provides a heuristic stack trace:
0:000> !analyze -v [...] EXCEPTION_RECORD: 001150fc -- (.exr 0x1150fc) ExceptionAddress: 7c7e2afb (kernel32!RaiseException+0x00000053) ExceptionCode: 0eedfade ExceptionFlags: 00000001 NumberParameters: 7 Parameter[0]: 0098fa49 Parameter[1]: 0374c200 Parameter[2]: 00000000 Parameter[3]: 005919b4 Parameter[4]: 01d80010 Parameter[5]: 00115704 Parameter[6]: 001154a4 [...]eax=00000000 ebx=00000000 ecx=0000019c edx=00000214 esi=00000000 edi=00000000 eip=000003b0 esp=000002d8 ebp=2d59495b iopl=0 nv up ei ng zr na pe ncCONTEXT: 0012ffb4 – (.cxr 0×12ffb4)0032:000003b0 ?? ??? [...] STACK_TEXT: 7c910328 ntdll!`string'+0x4 7c7db7d0 kernel32!ConsoleApp+0xe 7c7db7a4 kernel32!ConDllInitialize+0x20f 7c7db7b9 kernel32!ConDllInitialize+0x224 7c915239 ntdll!bsearch+0x42 7c91542b ntdll!RtlpLocateActivationContextSection+0x15a 7c915474 ntdll!RtlpCompareActivationContextDataTOCEntryById+0x0 7c916104 ntdll!RtlpFindUnicodeStringInSection+0x23d 7c91534a ntdll!RtlpFindNextActivationContextSection+0x61 7c915742 ntdll!RtlFindNextActivationContextSection+0x46 7c9155ed ntdll!RtlFindActivationContextSectionString+0xde 7c915ce9 ntdll!RtlDecodeSystemPointer+0x9e7 7c915d47 ntdll!RtlDecodeSystemPointer+0xb0b 7c9158ff ntdll!RtlDecodeSystemPointer+0x45b 7c915bf8 ntdll!RtlDosApplyFileIsolationRedirection_Ustr+0x346 7c915c5d ntdll!RtlDosApplyFileIsolationRedirection_Ustr+0x3de 7c97e214 ntdll!DllExtension+0xc 00800000 ApplicationA+0x400000 7c910000 ntdll!RtlFreeHeap+0x1a4 7c914a53 ntdll!LdrLockLoaderLock+0x146 7c912d04 ntdll!LdrLockLoaderLock+0x1d2cs=0032 ss=0010 ds=0002 es=0000 fs=0000 gs=0000 efl=000003e4
7c912d71 ntdll!LdrUnlockLoaderLock+0x88
7c916768 ntdll!LdrGetDllHandleEx+0xc9
7c912d80 ntdll!`string'+0x84
7c91690e ntdll!LdrGetDllHandleEx+0x2f1
7c912d78 ntdll!LdrUnlockLoaderLock+0xb1
7c97ecc0 ntdll!LdrpHotpatchCount+0x8
7c9167e8 ntdll!`string'+0xc4
7c9168d6 ntdll!LdrGetDllHandleEx+0x2de
7c9166b8 ntdll!LdrGetDllHandle+0x18
7c7de534 kernel32!GetModuleHandleForUnicodeString+0x1d
7c7de544 kernel32!GetModuleHandleForUnicodeString+0xa0
7c7de64b kernel32!BasepGetModuleHandleExW+0x18e
7c7de6cb kernel32!BasepGetModuleHandleExW+0x250
79000000 mscoree!_imp__EnterCriticalSection <PERF> +0x0
7c809ad8 kernel32!_except_handler3+0x0
7c7de548 kernel32!`string'+0x28
79002280 mscoree!`string'+0x0
02080000 xpsp2res+0xc0000
7c7db6d4 kernel32!_BaseDllInitialize+0x7a
7c7db6e9 kernel32!_BaseDllInitialize+0x488
7c917ef3 ntdll!LdrpSnapThunk+0xbd
7c9048b8 ntdll!$$VProc_ImageExportDirectory+0x14b8
7c9000d0 ntdll!RtlDosPathSeperatorsString <PERF> +0x0
7c905d48 ntdll!$$VProc_ImageExportDirectory+0x2948
7c910228 ntdll!RtlpRunTable+0x448
7c910222 ntdll!RtlpAllocateFromHeapLookaside+0x42
7c911086 ntdll!RtlAllocateHeap+0x43d
7c903400 ntdll!$$VProc_ImageExportDirectory+0x0
7c7d9036 kernel32!$$VProc_ImageExportDirectory+0x6a0a
791c6f2d mscorwks!DllMain+0x117
7c917e10 ntdll!`string'+0xc
7c918047 ntdll!LdrpSnapThunk+0x317
7c7d00f0 kernel32!_imp___ wcsnicmp <PERF> +0x0
7c7d903c kernel32!$$VProc_ImageExportDirectory+0x6a10
7c917dba ntdll!LdrpGetProcedureAddress+0x186
7c900000 ntdll!RtlDosPathSeperatorsString <PERF> +0x0
7c917e5f ntdll!LdrpGetProcedureAddress+0x29b
7c7d262c kernel32!$$VProc_ImageExportDirectory+0x0
7c7d0000 kernel32!_imp___ wcsnicmp <PERF> +0x0
79513870 mscorsn!DllMain+0x119
7c913425 ntdll!RtlDecodePointer+0x0
00726574 ApplicationA+0x326574
7c917e09 ntdll!LdrpGetProcedureAddress+0xa6
7c917ec0 ntdll!LdrGetProcedureAddress+0x18
7c9101e0 ntdll!CheckHeapFillPattern+0x54
7c9101db ntdll!RtlAllocateHeap+0xeac
40ae17ea msxml6!calloc+0xa9
40ae181f msxml6!calloc+0xde
40a30000 msxml6!_imp__OpenThreadToken <PERF> +0x0
7c910323 ntdll!RtlpImageNtHeader+0x56
7c910385 ntdll!RtlImageDirectoryEntryToData+0x57
00400100 ApplicationA+0x100
7c928595 ntdll!LdrpCallTlsInitializers+0x1d
00400000 ApplicationA+0x0
7c9285c7 ntdll!LdrpCallTlsInitializers+0xd8
7c90118a ntdll!LdrpCallInitRoutine+0x14
00a23010 ApplicationA+0x623010
7c9285d0 ntdll!`string'+0x18
7c935e24 ntdll!LdrpInitializeThread+0x147
7c91b1b7 ntdll!LdrpInitializeThread+0x13b
778e159a SETUPAPI!_DllMainCRTStartup+0x0
7c91b100 ntdll!`string'+0x88
7c91b0a4 ntdll!_LdrpInitialize+0x25b
7c90de9a ntdll!NtTestAlert+0xc
7c91b030 ntdll!`string'+0xc8
7c91b02a ntdll!_LdrpInitialize+0x246
7c90d06a ntdll!NtContinue+0xc
7c90e45f ntdll!KiUserApcDispatcher+0xf
00780010 ApplicationA+0x380010
7c951e13 ntdll!DbgUiRemoteBreakin+0x0
7c97e178 ntdll!LdrpLoaderLock+0x0
00d10000 ApplicationA+0x910000
7c951e40 ntdll!DbgUiRemoteBreakin+0x2d
7c90e920 ntdll!_except_handler3+0x0
7c951e60 ntdll!`string'+0x7c
Compare our invalid context data with the normal one having good efl and segment register values:
cs=0023 ss=002b ds=002b es=002b fs=0053 gs=002b efl=00010206
We look at our stack trace after resetting the context and using kv command. We see that KiUserExceptionDispatcher has the valid exception context but exception pointers for UnhandledExceptionFilter are not valid:
0:000> .ecxr 0:000> kv ChildEBP RetAddr Args to Child 001132d0 7c90df4a 7c7d9590 00000002 001132fc ntdll!KiFastSystemCallRet 001132d4 7c7d9590 00000002 001132fc 00000001 ntdll!ZwWaitForMultipleObjects+0xc 00113370 7c7da115 00000002 001134a0 00000000 kernel32!WaitForMultipleObjectsEx+0x12c 0011338c 6993763c 00000002 001134a0 00000000 kernel32!WaitForMultipleObjects+0x18 00113d20 699382b1 00115018 00000001 00198312 faultrep!StartDWException+0x5df 00114d94 7c834526 00115018 00000001 00000000 faultrep!ReportFault+0x533 00115008 0040550c001150187c9032a8 001150fc kernel32!UnhandledExceptionFilter+0×55b WARNING: Stack unwind information not available. Following frames may be wrong. 00115034 7c90327a 001150fc 0012ffb4 0011512c ApplicationA+0×550c 001150e4 7c90e48a 00000000 0011512c 001150fc ntdll!ExecuteHandler+0×24 001150e4 7c7e2afb 00000000 0011512c 001150fc ntdll!KiUserExceptionDispatcher+0xe(CONTEXT @ 0011512c)0011544c 0057ac37 0eedfade 00000001 00000007 kernel32!RaiseException+0×53 00115470 0098fa49 0eedfade 00000001 00000007 ApplicationA+0×17ac37 [...] 0012268c 7e398816 017d0f87 000607e8 0000001a USER32!InternalCallWinProc+0×28 001226f4 7e3a8ea0 00000000 017d0f87 000607e8 USER32!UserCallWinProcCheckWow+0×150 0:000>dd 00115018L4 00115018001150fc 0012ffb40011512c 001150d0
0:000> .cxr 0011512c
eax=001153fc ebx=0eedfade ecx=00000000 edx=001537a8 esi=001154a4 edi=00000007
eip=7c7e2afb esp=001153f8 ebp=0011544c iopl=0         nv up ei pl nz na po nc
cs=001b  ss=0023  ds=0023  es=0023  fs=003b  gs=0000             efl=00200202
kernel32!RaiseException+0×53:
7c7e2afb 5e              pop     esi

0:000> kv
  *** Stack trace for last set context - .thread/.cxr resets it
ChildEBP RetAddr  Args to Child
0011544c 0057ac37 0eedfade 00000001 00000007 kernel32!RaiseException+0x53
WARNING: Stack unwind information not available. Following frames may be wrong.
00115470 0098fa49 0eedfade 00000001 00000007 ApplicationA+0x17ac37
[...]
0012268c 7e398816 017d0f87 000607e8 0000001a USER32!InternalCallWinProc+0x28
001226f4 7e3a8ea0 00000000 017d0f87 000607e8 USER32!UserCallWinProcCheckWow+0x150
00122748 7e3aacd1 00fd2ad0 0000001a 00000000 USER32!DispatchClientMessage+0xa3
00122778 7c90e473 00122788 00000030 00000030 USER32!__fnINSTRING+0x37
001227b4 7e3993e9 7e3993a8 00122840 00000000 ntdll!KiUserCallbackDispatcher+0x13
001227e0 7e3aa43b 00122840 00000000 00000000 USER32!NtUserPeekMessage+0xc
0012280c 004794d9 00122840 00000000 00000000 USER32!PeekMessageA+0xeb
001228bc 00461667 0012ff7c 00461680 001228e0 ApplicationA+0x794d9
[...]
This pattern differs from Local Buffer Overflow (Volume 1, page 461) and heap (Volume 1, page 257) / pool (Volume 2, page 204) memory corruption patterns in not writing over control structures situated at dynamically allocated memory or procedure frame (local call stack) boundaries. Its effect is visible when the buffer data contains pointers that become wild (Volume 2, page 202) after overwrite and are later dereferenced resulting in a crash. For example, when the overwriting data contains UNICODE and /or ASCII characters we see them in a pointer data:
1: kd> !analyze -v [...] SYSTEM_THREAD_EXCEPTION_NOT_HANDLED (7e) This is a very common bugcheck. Usually the exception address pinpoints the driver/function that caused the problem. Always note this address as well as the link date of the driver/image that contains this address. Arguments: Arg1: c0000005, The exception code that was not handled Arg2: 8086c949, The address that the exception occurred at Arg3: f78eec54, Exception Record Address Arg4: f78ee950, Context Record Address [...] EXCEPTION_RECORD: f78eec54 -- (.exr 0xfffffffff78eec54) ExceptionAddress: 8086c949 (nt!ObfDereferenceObject+0x00000023) ExceptionCode: c0000005 (Access violation) ExceptionFlags: 00000000 NumberParameters: 2 Parameter[0]: 00000001Parameter[1]: 006f0058Attempt to write to address 006f0058 CONTEXT: f78ee950 -- (.cxr 0xfffffffff78ee950) eax=f78e0001 ebx=ffffffff ecx=006f0070 edx=00000000esi=006f0058edi=8087cdae eip=8086c949 esp=f78eed1c ebp=f78eed2c iopl=0 nv up ei ng nz na pe nc cs=0008 ss=0010 ds=0023 es=0023 fs=0030 gs=0000 efl=00010286 nt!ObfDereferenceObject+0×23: 8086c949 f00fc11e lock xadd dword ptr [esi],ebx ds:0023:006f0058=???????? [...]
STACK_TEXT: f78eed2c f707212e 886e6530 f78eed80 f706e04e nt!ObfDereferenceObject+0x23 f78eed38 f706e04e e47b1258 8b2fcb40 808ae5c0 DriverA!CloseConnection+0x16 f78eed80 80880475 8835f248 00000000 8b2fcb40 DriverA!Resume+0x9f f78eedac 80949c5a 8835f248 00000000 00000000 nt!ExpWorkerThread+0xeb f78eeddc 8088e0c2 8088038a 00000000 00000000 nt!PspSystemThreadStartup+0x2e 00000000 00000000 00000000 00000000 00000000 nt!KiThreadStartup+0x16 1: kd> ub f707212e DriverA!CloseConnection+0x2: f707211a push ebp f707211b mov ebp,esp f707211d push esi f707211e mov esi,dword ptr [ebp+8] f7072121 mov ecx,dword ptr [esi+14h] f7072124 test ecx,ecx f7072126 je DriverA!CloseConnection+0x1a (f7072132) f7072128 call dword ptr [DriverA!_imp_ObfDereferenceObject (f70610f4)] 1: kd> db e47b1258 L20 e47b1258 61 67 65 20 57 72 69 74-65 72 00 05 77 00 69 00age Writer..w.i.e47b1268 6e 00 73 00 70 00 6f 00-6f 00 6c 00 2c 00 4e 00n.s.p.o.o.l.,.N.1: kd> !pool e47b1258 Pool page e47b1258 region is Paged pool e47b1000 size: 108 previous size: 0 (Allocated) CM39 e47b1108 size: 38 previous size: 108 (Free) CMVa e47b1140 size: 28 previous size: 38 (Allocated) NtFs e47b1168 size: 8 previous size: 28 (Free) CMDa e47b1170 size: 80 previous size: 8 (Allocated) FSim e47b11f0 size: 28 previous size: 80 (Allocated) CMNb (Protected)*e47b1218 size: 70 previous size: 28 (Allocated) *CMDa Pooltag CMDa : value data cache pool tag, Binary : nt!cme47b1288 size: 58 previous size: 70 (Allocated) Sect (Protected) e47b12e0 size: 18 previous size: 58 (Allocated) Ntf0 e47b12f8 size: 28 previous size: 18 (Allocated) NtFs e47b1320 size: 20 previous size: 28 (Allocated) CMNb (Protected) e47b1340 size: 48 previous size: 20 (Allocated) Ntfc e47b1388 size: 68 previous size: 48 (Allocated) Sect (Protected) e47b13f0 size: 30 previous size: 68 (Allocated) CMVa e47b1420 size: 38 previous size: 30 (Allocated) CMVa e47b1458 size: 8 previous size: 38 (Free) CMVa e47b1460 size: 48 previous size: 8 (Allocated) CMVa e47b14a8 size: d0 previous size: 48 (Allocated) Ntfo e47b1578 size: 330 previous size: d0 (Allocated) Ntff e47b18a8 size: 10 previous size: 330 (Free) NtfE e47b18b8 size: e0 previous size: 10 (Allocated) Ntfo e47b1998 size: 40 previous size: e0 (Allocated) MmSm e47b19d8 size: 8 previous size: 40 (Free) Ica e47b19e0 size: 18 previous size: 8 (Allocated) Ntf0 e47b19f8 size: 68 previous size: 18 (Allocated) CMDa e47b1a60 size: 28 previous size: 68 (Allocated) ObNm
 e47b1a88 size:   b8 previous size:    28  (Allocated)  Port (Protected)
 e47b1b40 size:   58 previous size:    b8  (Allocated)  Sect (Protected)
 e47b1b98 size:   30 previous size:    58  (Allocated)  CMVa
 e47b1bc8 size:    8 previous size:    30  (Free)        NtFA
 e47b1bd0 size:  100 previous size:     8  (Allocated)  IoNm
 e47b1cd0 size:   18 previous size:   100  (Allocated)  ObDi
 e47b1ce8 size:   38 previous size:    18  (Allocated)  CMnb Process:
88469928
 e47b1d20 size:   78 previous size:    38  (Free )  NtFI
 e47b1d98 size:   68 previous size:    78  (Allocated)  CMDa
 e47b1e00 size:   18 previous size:    68  (Allocated)  PsIm (Protected)
 e47b1e18 size:   e8 previous size:    18  (Free )  TunP
 e47b1f00 size:  100 previous size:    e8  (Allocated)  IoNm
Another example:
0: kd> !analyze -v [...] SYSTEM_THREAD_EXCEPTION_NOT_HANDLED (7e) This is a very common bugcheck. Usually the exception address pinpoints the driver/function that caused the problem. Always note this address as well as the link date of the driver/image that contains this address. Arguments: Arg1: c0000005, The exception code that was not handled Arg2: 8083e4d6, The address that the exception occurred at Arg3: f78cec54, Exception Record Address Arg4: f78ce950, Context Record Address [...] EXCEPTION_RECORD: f78cec54 -- (.exr 0xfffffffff78cec54) ExceptionAddress: 8083e4d6 (nt!ObfDereferenceObject+0x00000023) ExceptionCode: c0000005 (Access violation) ExceptionFlags: 00000000 NumberParameters: 2 Parameter[0]: 00000001Parameter[1]: 65696c2bAttempt to write to address 65696c2b CONTEXT: f78ce950 -- (.cxr 0xfffffffff78ce950) eax=f78c0001 ebx=ffffffff ecx=65696c43 edx=00000000esi=65696c2bedi=8083e407 eip=8083e4d6 esp=f78ced1c ebp=f78ced2c iopl=0 nv up ei ng nz na pe nc cs=0008 ss=0010 ds=0023 es=0023 fs=0030 gs=0000 efl=00010286 nt!ObfDereferenceObject+0×23: 8083e4d6 f00fc11e lock xadd dword ptr [esi],ebx ds:0023:65696c2b=???????? Resetting default scope [...]
STACK_TEXT: f78ced2c f71bd12e 87216470 f78ced80 f71b904e nt!ObfDereferenceObject+0x23 f78ced38 f71b904e e49afb90 8a38eb40 808b70e0 DriverA!CloseConnection+0x16 f78ced80 8082db10 868989e0 00000000 8a38eb40 DriverA!Resume+0x9f f78cedac 809208bb 868989e0 00000000 00000000 nt!ExpWorkerThread+0xeb f78ceddc 8083fe9f 8082da53 00000000 00000000 nt!PspSystemThreadStartup+0x2e 00000000 00000000 00000000 00000000 00000000 nt!KiThreadStartup+0x16 [...] 0: kd> .formats 65696c2b Evaluate expression: Hex: 65696c2b Decimal: 1701407787 Octal: 14532266053 Binary: 01100101 01101001 01101100 00101011 Chars: eil+ Time: Fri Dec 01 05:16:27 2023 Float: low 6.88942e+022 high 0 Double: 8.40607e-315 0: kd> db e49afb90 L20 e49afb90 41 41 22 00 1e 00 00 00-00 5f 07 00 01 00 00 00AA"......_...... e49afba0 01 00 00 00 43 6c 69 65-6e 74 41 2f 41 41 41 41 ....ClientA/AAAA0: kd> !pool e49afb90 Pool page e49afb90 region is Paged pool e49af000 size: 330 previous size: 0 (Allocated) Ntff e49af330 size: 2c0 previous size: 330 (Allocated) Toke (Protected) e49af5f0 size: 78 previous size: 2c0 (Allocated) NtFU e49af668 size: 10 previous size: 78 (Free) CMVI e49af678 size: a8 previous size: 10 (Allocated) Ntfo e49af720 size: 80 previous size: a8 (Allocated) NtFU e49af7a0 size: 78 previous size: 80 (Allocated) NtFU e49af818 size: 18 previous size: 78 (Allocated) Ntf0 e49af830 size: 20 previous size: 18 (Allocated) ObHd e49af850 size: 38 previous size: 20 (Allocated) MmSm e49af888 size: 78 previous size: 38 (Allocated) NtFU e49af900 size: 28 previous size: 78 (Allocated) NtFs e49af928 size: 48 previous size: 28 (Allocated) Ntfc e49af970 size: 40 previous size: 48 (Allocated) CMNb (Protected) e49af9b0 size: 28 previous size: 40 (Allocated) NtFs e49af9d8 size: 30 previous size: 28 (Allocated) AtmA e49afa08 size: 108 previous size: 30 (Allocated) CM39 e49afb10 size: 18 previous size: 108 (Allocated) Ntf0 e49afb28 size: 30 previous size: 18 (Allocated) CMVw (Protected) e49afb58 size: 28 previous size: 30 (Allocated) MPXC*e49afb80 size: 70 previous size: 28 (Free) *CMDa Pooltag CMDa : value data cache pool tag, Binary : nt!cme49afbf0 size: b8 previous size: 70 (Allocated) Port (Protected)
 e49afca8 size:   28 previous size:    b8  (Allocated)  CMNb (Protected)
 e49afcd0 size:  330 previous size:    28  (Allocated)  Ntff
Notice that in the latter example the pointer references a freed pool element. If a pointer points to an overwritten buffer the result is similar to a dangling pointer[12] pointing to a reallocated freed buffer. If an object was located in a shared buffer and its data becomes overwritten we can also observe Random Object pattern (Volume 4, page 150).
Sometimes when looking at a module list (lmv WinDbg command) we see the whole presence of this pattern. It is not just a module that does function (Volume 1, page 469) and / or message (page 76) hooking but the whole system of modules from a single vendor that is context-aware (for example, reads its configuration from registry) and consists of several components that communicate with other processes. The penetrated system is supposed to add some additional value or to coexist peacefully in a larger environment. The system thus becomes coupled strongly (Volume 1, page 419) and / or weekly (page 60) with other processes it was never intended to work with as opposed to intended module variety (Volume 1, page 310). At one extreme, modules from pervasive system can be ubiquitous (Volume 4, page 94) and, at the other end, hidden (Volume 2, page 339). In such cases troubleshooting consists of the total removal of the pervasive modules and, if the problem disappears, their exclusion one by one to find the problem component.
This pattern usually happens with custom exception handlers that are not written according to the prescribed rules (for example, a handler for a non-continuable exception[13]) or have other defects common to normal code. Please refer to the case study that models the former[14].
In the example below we have a different stack trace epilogue for a similar issue that shows a relationship with a custom exception handler:
0:000> kv 1000 ChildEBP RetAddr Args to Child 0003300c 77af9904 77b8929c 792ea99b 00000000 ntdll!RtlAcquireSRWLockShared+0x1a 00033058 77af986700406ef800033098 000330a0 ntdll!RtlLookupFunctionTable+0×2a 000330a8 77af97f900406ef800000000 00000000 ntdll!RtlIsValidHandler+0×26 00033128 77b25dd7 01033140 00033154 00033140 ntdll!RtlDispatchException+0×10b 00033128 77b40726 01033140 00033154 00033140 ntdll!KiUserExceptionDispatcher+0xf (CONTEXT @ 00033154) 00033490 77b25dd7 010334a8 000334bc 000334a8 ntdll!RtlDispatchException+0×18a 00033490 77b40726 010334a8 000334bc 000334a8 ntdll!KiUserExceptionDispatcher+0xf (CONTEXT @ 000334bc) 000337f8 77b25dd7 01033810 00033824 00033810 ntdll!RtlDispatchException+0×18a [...] 0012f228 77b40726 0112f240 0012f254 0012f240 ntdll!KiUserExceptionDispatcher+0xf (CONTEXT @ 0012f254) 0012f590 77b25dd7 0112f5a8 0012f5d8 0012f5a8 ntdll!RtlDispatchException+0×18a 0012f590 768bfbae 0112f5a8 0012f5d8 0012f5a8 ntdll!KiUserExceptionDispatcher+0xf (CONTEXT @ 0012f5d8) 0012f8f4 0059ecad 0eedfade00000007 kernel32!RaiseException+0×58 WARNING: Stack unwind information not available. Following frames may be wrong. 0012f918 00473599 0eedfade 00000001 00000007 Application+0×19ecad [...] 0012ff88 768cd0e9 7ffdf000 0012ffd4 77b019bb Application+0×70f8 0012ff94 77b019bb 7ffdf000 793f6617 00000000 kernel32!BaseThreadInitThunk+0xe 0012ffd4 77b0198e 011263c0 7ffdf000 ffffffff ntdll!__RtlUserThreadStart+0×23 0012ffec 00000000 011263c0 7ffdf000 00000000 ntdll!_RtlUserThreadStart+0×1b 0:000> !exchain 00033048: ntdll!_except_handler4+0 (77ac99fa)000000010012ff78: Application+6ef8 (00406ef8)0012ffc4: ntdll!_except_handler4+0 (77ac99fa) 0012ffe4: ntdll!FinalExceptionHandler+0 (77b66f9b) Invalid exception stack at ffffffff
This is a variation of a deadlock pattern (Volume 3, page 388) where a thread that owns a resource (either in shared or exclusive mode) attempts to acquire it exclusively again. This results in a self-deadlock:
Resource @ 0x85d9c018    Shared 1 owning threads
    Contention Count = 2
    NumberOfExclusiveWaiters = 2
     Threads: 85db0030-02<*>
     Threads Waiting On Exclusive Access:
              85f07d78       85db0030
Sometimes we have very similar abnormal software behaviour dispositions (like crashes with similar stack traces) for different applications or services. In such cases we should also check application or service vendor and copyright in the output of lmv command. Similar to Template Module (page 112) Same Vendor pattern can be useful to relate such different incidents. Usually, in the same company, code and people reuse tends to distribute code fragments and code construction styles across different product lines and software defects might surface in different images. For example:
0:000> lmv m ApplicationA
start    end         module name
00400000 00d99000    ApplicationA   (deferred)
[...]
    Image name: ApplicationA.exe
    Timestamp:        [...]
    CheckSum:         00000000
[...]
    CompanyName:      CompanyA
    ProductName:      CompanyA Application
    LegalCopyright:   Copyright (c) CompanyA
[...]

0:000> lmv m ApplicationB
start    end         module name
00400000 019d0000   ApplicationB  C (no symbols)
    Image name: ApplicationB.exe
[...]
    CompanyName:      CompanyA
    ProductName:      ApplicationB
    LegalCopyright:   Copyright (c) CompanyA
[...]
[10] http://msdn.microsoft.com/en-us/library/ff540586(VS.85).aspx
[11] http://msdn.microsoft.com/en-us/library/ms632589(VS.85).aspx
[12] http://en.wikipedia.org/wiki/Dangling_pointer
[13] http://msdn.microsoft.com/en-us/library/aa259964.aspx
[14] http://www.debuggingexperts.com/modeling-exception-handling