Chapter 13
Management with OMS
This chapter will introduce you to Operations Management Suite (OMS), which is a management solution designed to manage and protect your on-premises and cloud infrastructures. Rather than deploying and managing on-premises resources, OMS components are entirely hosted in Azure. Configuration is minimum, and you can be up and running literally in a matter of minutes. In this chapter, we will cover the basics of OMS and how can you use it to monitor and get notifications from your Windows Server 2016 servers.
What Is Operations Management Suite?
Microsoft has long been providing products for managing enterprise environments. Multiple products were consolidated into the System Center suite of management products in 2007. This includes the family of products that were covered in Chapter 12.
With more computing resources moving to the cloud, System Center products gained more cloud features such as Operations Manager. However, those features were still fundamentally designed as on-premise solutions and required significant investment when being deployed and maintained in an on-premises management environment. To completely leverage the cloud and support future applications, a new approach to management was required.
Operations Management Suite is a set of components designed to deliver a unified IT management solution that brings together multiple IT operations and challenges with a suite of solutions that can resolve those challenges.
OMS is built on these four areas, as shown in Figure 13.1.

FIGURE 13.1 Types of solutions
A Brief History
Microsoft Operations Management Suite was released in January 2012 with System Center Advisor (formerly Microsoft codename Atlanta), and it enabled IT professionals to proactively avoid server configuration problems by assessing static, runtime, and operational data to identify potential issues that could cause outages or poor performance. Initially, Advisor provided support for Windows Server and SQL Server workloads and extended support to additional server products.
However, the Advisor product team realized that customers wanted more insight into their data. Their solution became what was called Azure Log Analytics. The program was then called Azure Operational Insights during a limited preview in 2014.
As a massive amount of machine data was captured by Ops Insights, customers wanted their problems remediated and sought solutions on top of the insights they had found. Those customer needs triggered the creation of Operations Management Suite. In May 2015, at Microsoft Ignite, it became generally available.
This service was built from the ground up to support hybrid cloud scenarios.
OMS Services
The core functionality of OMS is provided by a set of services that run in Azure. Each service provides a specific management function, as you can see in Table 13.1, and you can combine services to achieve different management scenarios.
TABLE 13.1: OMS Services and Description
| SERVICES | DESCRIPTION |
| Insight & Analytics | This platform helps you collect, correlate, search, and act on logs and data. It offers real-time operational insights using integrated search to readily analyze millions of records across all of your workloads and servers regardless of their physical location. Solutions can be easily added to Log Analytics that define data to be collected and specify the logic for its analysis. |
| Automation & Control | Azure Automation automates administrative processes with runbooks that are based on PowerShell and run in the Azure cloud. Runbooks can access any product or service that can be managed with PowerShell, including resources in other clouds such as Amazon Web Services (AWS). Runbooks can also be executed on a server in your local data center to manage local resources. Azure Automation provides configuration management with PowerShell DSC (Desired State Configuration). You can create and manage DSC resources hosted in Azure and apply them to cloud and on-premises systems to define and automatically enforce their configuration. |
| Backup and Recovery | Azure Backup protects your application data and retains it for years with no capital investment and with minimal operating costs. Azure Site Recovery contributes to your business continuity and disaster recovery (BCDR) strategy by orchestrating replication, failover, and recovery of on-premises Hyper-V virtual machines, VMware virtual machines, and physical Windows/Linux servers. |
| Security & Compliance | Security & Compliance has solutions designed to expose security risks and act decisively to resolve those risks. The Security and Audit solution collects and analyzes security events on managed systems to identify suspicious activity. The Antimalware solution reports on the status of anti-malware protection on managed systems. The System Updates solution performs an analysis of the security updates and other updates on your managed systems so that you easily identify systems requiring patching. |
Because of the complexity of the tools, the focus of this chapter will be on describing functionality for just the security and analytics features.
OMS Pricing
Operations Management Suite has a free trial with no expiration. It can be used as long as needed. The free trial comes with a 500 MB upload per day and keep data for 7 days, but it is and will be a free service. However, there are paid options. The different management solutions are part of the different services, which also include different pricing tiers.
These offers change at a very fast pace. To check the current pricing structure and identify the various solutions and services, go to the following link: https://docs.microsoft.com/en-us/azure/log-analytics/log-analytics-add-solutions#offers-and-pricing-tiers.
SLA Details
For paid tiers, Microsoft guarantees that at least 99.9 percent of the time, log data will be indexed within six hours of the data being queued for indexing by the Operations Management Suite Log Analytics Service. However, no service level agreement (SLA) is provided for the free tier of Operations Management Suite Log Analytics.
Monthly Uptime Percentage for the Operational Insights service is calculated as Total Queued Batches less Delayed Batches divided by Total Queued Batches in a billing month for a given Microsoft Azure subscription. Monthly Uptime Percentage is represented by the following formula:
- Monthly Uptime Percentage = (Total Queued Batches – Delayed Batches) / Total Queued Batches
Table 13.2 lists the different SLAs for Operations Management Suite.
TABLE 13.2: Service Level Agreements for Operations Management Suite
| MONTHLY UPTIME PERCENTAGE | SERVICE CREDIT |
| < 99.9% | 10% |
| < 99% | 25% |
For more information, please visit https://azure.microsoft.com/en-us/support/legal/sla/log-analytics/v1_1/.
Operations Management Suite can enable multiple types of data. For example, the following can be used as data sources for OMS:
- Windows event logs
- Windows performance counters
- Linux performance counters
- IIS logs
- Custom fields
- Syslog
Data is aggregated approximately 60 minutes after data collection is initialized. However, keep in mind that Operations Management Suite is a log analytics tool by design, and it is not designed to provide real-time monitoring. Once data is inserted, the Service Level Agreement today is six hours. For reactive (almost) real-time monitoring, System Center Operations Manager can be the better fitting tool from a workload and alert management standpoint.
System Requirements
Table 13.3 lists the requirements for Operations Management Suite.
TABLE 13.3: Connected Sources and Data Sources
| TYPE OF DATA | TYPE OF SOURCE | DESCRIPTION |
| Connected Sources | Windows agents | Windows Server 2008 SP1 or later, or Windows 7 SP1 or later. |
| Linux agents | Amazon Linux 2012.09 to 2015.09; CentOS Linux 5, 6, and 7; Oracle Linux 5, 6, and 7; Red Hat Enterprise Linux Server 5, 6 and 7; Debian GNU/Linux 6, 7, and 8; Ubuntu 12.04 LTS, 14.04 LTS, 15.04, 15.10, 16.04 LTS; SUSE Linux Enterprise Server 11 and 12. | |
| Azure Virtual Machines | Enable the Log Analytics VM Extension. | |
| Azure resources | Collecting logs and metrics for Azure Services: Azure diagnostics direct to Log Analytics, Azure diagnostics to Azure storage to Log Analytics, Connectors for Azure services, Scripts to collect and then post data into Log Analytics. | |
| Diagnostic or log data from Azure storage | Log Analytics can read the logs for Service Fabric clusters, Virtual Machines, Web/Worker roles. | |
| Operations Manager | SCOM can extend capabilities with Log Analytics. | |
| Configuration Manager | SCCM can be connected to OMS to sync device collection data. | |
| OMS Gateway | Monitored computers can send data to the OMS service when they do not have Internet access. | |
| Data Sources | Custom logs | Text files on Windows or Linux agents containing log information. |
| Windows event logs | Events collected from the event log on Windows computers. | |
| Windows performance counters | Performance counters collected from Windows computers. | |
| Linux performance counters | Performance counters collected from Linux computers. | |
| IIS logs | Internet Information Services logs in W3C format. | |
| Syslog | Syslog events on Windows or Linux computers. |
While the different features in Operations Management Suite will collect the data from the connected sources, the data sources will collect data from the connected sources as well. For example, a connected source running Red Hat Enterprise Linux Server will be collecting (if selected) the data sources for Linux performance counters.
You will also need an Azure subscription. For more information, see https://docs.microsoft.com/en-us/azure/log-analytics/log-analytics-get-started.
The following browsers are supported:
- Internet Explorer (10 and up)
- Chrome (latest)
- Firefox (Latest)
- Safari (7 and up)
Safari 6 and lower is not supported. If you're using macOS, you can use either Chrome or Firefox or you can upgrade to OS X Mavericks to get Safari 7.
The agent needs to use TCP port 443 for various resources. Table 13.4 lists the URLs needed to communicate.
TABLE 13.4: URL Access Needed for OMS
| AGENT RESOURCE | PORTS | BYPASS HTTPS INSPECTION |
*.ods.opinsights.azure.com |
443 | Yes |
*.oms.opinsights.azure.com |
443 | Yes |
*.blob.core.windows.net |
443 | Yes |
*.azure-automation.net |
443 | Yes |
Log Analytics
While the process required to deploy Operations Management Suite is simple, keep in mind that it can (eventually) be as complex as your organization requires. In anyway, the benefit is that this solution is designed in a way that data is collected in almost real time, which will help you perform ad hoc exploration, slice and dice, search and correlate through different sources, and ultimately get insight data that is unique to your organization, which will help achieve complete visibility of IT Operations.
The process of onboarding OMS into an organization is as follows:
- Create an Azure account. (If you don't have an Azure account already, you must create an Azure Pass. It is a free account that you'll need to integrate into OMS. To get a free pass, navigate to
https://azure.microsoft.com/en-us/free.) - You must create an Operations Management Suite workspace, so navigate to
https://portal.azure.comand log in with the Live Account associated with the Azure account referenced in the previous step. - In the Azure portal, click More Services, and typing log or analytics will show Log Analytics, as shown in Figure 13.2.

FIGURE 13.2 The Azure portal
- In the Log Analytics box, Click Add, as shown in Figure 13.3.

FIGURE 13.3 The Log Analytics box in Azure
- Select a name for the OMS Workspace or enter a name for your workspace; it must be unique.
- Select a subscription. (If you have more than one, make sure it is the one that was just created.)
- Select (or create) a resource group.
- Select a location.
- Select a pricing tier.
- Click OK, as shown in Figure 13.4.

FIGURE 13.4 Create a workspace.
- You should receive the message “Deployment succeeded,” as shown in Figure 13.5.

FIGURE 13.5 Deployment succeeded
- Once the workspace is created, select it to see its details in the Azure portal.
- Navigate to the Azure portal and verify that the portal is available, as shown in Figure 13.6.

FIGURE 13.6 Microsoft Azure Log Analytics
- Click the Log Analytics workspace that was created.
- Click the arrow to upgrade the Azure Log Analytics portal, as shown in Figure 13.7. At the time of this writing, some regions are still running the legacy query language.

FIGURE 13.7 The OMS portal with Azure Log Analytics
- Click on the purple banner that says Learn More and Upgrade.
- Review the information about the upgrade on the upgrade information page.
- Click Upgrade Now, as shown in Figure 13.8.

FIGURE 13.8 Azure Log Analytics is now enhanced.
- Wait for the notification in the upper-right corner with the upgrade status, as shown in Figure 13.9.

FIGURE 13.9 The workspace upgrade is completed successfully.
Now you can deploy solutions to leverage efforts by Microsoft (to use the built-in dashboards instead of spending time creating queries).
- In the Azure portal, click the OMS Portal link, as shown in Figure 13.10.

FIGURE 13.10 The OMS Portal link
- Click the gear icon, as shown in Figure 13.11.
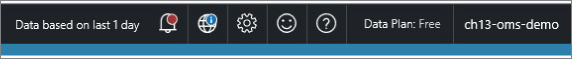
FIGURE 13.11 The Data Based on Last 1 Day box
- Select Data ⇨ Windows Performance Counters and click to Add the Selected Performance Counters, and then click the Save icon to complete, as shown in Figure 13.12.

FIGURE 13.12 Data Overview
- Add the Security and Audit solution.
- Navigate to the OMS portal and click the Solutions Gallery, which is displayed as a shopping bag, as shown in Figure 13.13.

FIGURE 13.13 OMS Portal Solutions Gallery
- On the Solutions Gallery, click the Security and Audit Solution, as shown in Figure 13.14.

FIGURE 13.14 Security and Audit Solution
- Click the Add button, as shown in Figure 13.15.

FIGURE 13.15 Solutions Gallery Add - Security and Audit
Now you can connect the sources.
- Is it a windows agent connected to my OMS workspace? Please review
https://docs.microsoft.com/en-us/azure/log-analytics/log-analytics-windows-agents. - Is SCOM being integrated and forwarding data into OMS? Please review
https://docs.microsoft.com/en-us/azure/log-analytics/log-analytics-om-agents.
Finally, review data by sending queries into OMS.
Performance Queries
Here is a list of sample queries in OMS using the latest version of the OMS Query Language.
The following query will show the top processor-utilizations in the agents sending data to the workspace; you can rename the y-axis as needed, as shown in Figure 13.16.

FIGURE 13.16 Azure Log Analytics processorutilization query
Perf
| where ObjectName == "Processor"
| summarize Average_CPU = avg(CounterValue) by Computer, CounterName
| where Average_CPU > 1
| render barchart
The following query will show the disk latency for the workspace, as shown in Figure 13.17.
Perf
| where CounterName == "Avg. Disk sec/Read"
| summarize Average_Latency = avg(CounterValue) by Computer, CounterName
| sort by Average_Latency desc

FIGURE 13.17 Azure Log Analytics disklatency query
The following query will show the overall performance data for the environment, as shown in Figure 13.18.
Perf
| where TimeGenerated >=ago (7d)
| where ObjectName == "Processor"
| where CounterName == "% Processor Time"
| summarize avg(CounterValue) by bin(TimeGenerated, 1h)
| render timechart

FIGURE 13.18 Azure Log Analytics performance query
Once you find the one using most of the resources, you can drill down and expose data quickly.
The following query will show the performance data for all the computers we have, as shown in Figure 13.19.
let endTime=now();let timerange =1d;let startTime=now() - timerange;let mInterval=4;let mAvgParm= repeat(1, mInterval);Perf
| where ObjectName == "Processor"
| where CounterName == "% Processor Time"
| make-series avgCpu=avg(CounterValue) default=0 on TimeGenerated in range(startTime, endTime, 15m) by Computer
| extend moving_avgCpu = series_fir(avgCpu, mAvgParm)
| render timechart

FIGURE 13.19 Azure Log Analytics totalperformance query
You could highlight the one you see using the most data.
Event Queries
The following query will show all the security events, as shown in Figure 13.20.
SecurityEvent
| project Activity
| parse Activity with activityID " - " activityDesc
| summarize count() by activityID

FIGURE 13.20 Azure Log Analytics securityevents query
You can also query for the last time a specific computer was rebooted. In this case, the computer contains the clt keyword , as shown in Figure 13.21.
Event
| where Computer containscs "clt" and EventID == 6005 and EventLog == "System" and Source == "EventLog"
| project Computer, TimeGenerated
| sort by Computer

FIGURE 13.21 Azure Log Analytics query for a specific reboot
The Bottom Line
- Manage hybrid environments. We are transitioning the current approach to IT, keeping workloads on-premises and in the cloud, and implementing hybrid environments. Managing these environments involves identifying new challenges and a collection of solutions from multiple vendors. That creates an integration challenge that could affect how troubleshooting and remediation actions are taken.
- Master It The solutions included in Insight & Analytics help customers leverage a new cloud-based platform that is designed to help deliver assistance using a simplified experience unique to the environment, in order to gain full visibility into operations.
- Solution Here is the list of solutions offered in Insight & Analytics. For the most updated version of this list, please visit
https://docs.microsoft.com/en-us/azure/log-analytics/log-analytics-add-solutions.
MANAGEMENT SOLUTION PRICING TIERS NOTES Activity Log Analytics Free Ninety days of data are available free of charge. AD Assessment Free AD Replication Status Free Not available to add from Azure portal/marketplace. Agent Health Free Data is not subject to the Free tier cap. Alert Management Free Not available to add from Azure portal/marketplace. Application Insights Connector (Preview) Free Azure Application Gateway Analytics Free Azure Network Security Group Analytics Free Azure SQL Analytics (Preview) Free Requires your Log Analytics workspace to be linked to an Automation account. Azure Web Apps Analytics Free Backup Free Requires a classic Backup vault. Capacity and Performance (Preview) Free Containers Free IT Service Management Connector (Preview) Free HDInsight HBase Monitoring Free Key Vault Analytics Free Logic Apps B2B Free Not available to add from Azure portal/marketplace. Network Performance Monitor Free Office 365 Analytics (Preview) Free Service Fabric Analytics (Preview) Free Service Map (Preview) Free Available in East US, West Europe, and West Central US. Site Recovery Free Requires a classic Site Recovery vault. SQL Assessment Free Start/Stop VMs during off-hours Free Requires your Log Analytics workspace to be linked to an Automation account. SurfaceHub Free Not available to add from Azure portal/marketplace. System Center Operations Manager Assessment (Preview) Free Update Compliance (Preview) Free No charge for data or nodes. Upgrade Readiness Free No charge for data or nodes. VMware Monitoring (Preview) Free Wire Data 2.0 (Preview) Free Available in East US, West Europe, and West Central US. - Expose security threats. Managing highly complex, hybrid-cloud, cross-platform infrastructure involves finding ways to quickly identify any security threat to the environment, in a cost and time-effective way.
- Master It The solutions included in Security & Compliance help customers evaluate the current security exposure in managed objects. Security & Compliance provides tools to quickly and easily identify possible threats. That is done by integrating the research done by Microsoft and partners in order to ensure a quick and efficient way to resolve possible security issues.
- Solution Here is the list of solutions offered in Security & Compliance. For the most updated version of this list, please visit
https://docs.microsoft.com/en-us/azure/log-analytics/log-analytics-add-solutions.
MANAGEMENT SOLUTION PRICING TIERS NOTES Malware Assessment Free If you add the Security and Compliance solutions after June 19, 2017, billing is per node, regardless of the workspace pricing tier. The first 60 days are free. Security and Audit Free This solution is required to collect security event logs. - Maintain automated configuration updates. From the ground up, Operations Management Suite is designed to manage workloads in a hybrid cloud, which includes AWS and Linux support.
- Master It The Automation & Control solutions let you automate and configure activities from a centralized platform. That is implemented by controlling and auditing timeframes for updates, by ensuring that configurations are automatically applied, and by leveraging solutions to ensure high availability of the infrastructure.
- Solution Here is the list of solutions offered in Automation & Control. For the most updated version of this list, please visit
https://docs.microsoft.com/en-us/azure/log-analytics/log-analytics-add-solutions.
MANAGEMENT SOLUTION PRICING TIERS NOTES Automation Hybrid Worker Free Requires your Log Analytics workspace to be linked to an Automation account. Change Tracking Free Requires your Log Analytics workspace to be linked to an Automation account. Update Management Free Requires your Log Analytics workspace to be linked to an Automation account.