
The Anatomy of An Intent Based Search and Crawler Engine for the Web of Things
Ali Shemshadi⁎; Quan Z. Sheng†; Yongrui Qin‡ ⁎School of Computer Science, The University of Adelaide, Adelaide, SA, Australia
†Department of Computing, Macquarie University, Sydney, NSW, Australia
‡School of Computing and Engineering, University of Huddersfield, Huddersfield, United Kingdom
Abstract
Web of Things (WoT) is becoming increasingly interesting for researchers and professionals over the past few years. It provides numerous opportunities by disseminating the data that is generated by physical things and fills the gap between the physical and the virtual world. Despite its importance, WoT search has not been studied enough in the past. Given the dynamic challenge of the WoT, collecting data from WoT resources is not well developed. Furthermore, the effectiveness of WoT search can be significantly improved if the users' intention of the search is also considered. This can be facilitated by knowing the existing status of the WoT in real-world. In this chapter, we address multiple challenges in this area. Firstly, we depict the analytical structure of the future WoT which facilitate crawling, indexing and searching the data from physical things. Secondly, we show how we can identify WoT and extract the data from it. Thirdly, we use our crawler to crawl and analyse WoT data on the Internet. Furthermore, we provide a showcase in the analysis of the flights delay data. Finally, we provide a discussion on future research in this area.
Keywords
Web of Things; Internet of Things; Big Data; Search engine; Flight delay
2.1 Introduction
Web of Thing (WoT) is a new paradigm in designing Web pages and making them suitable for the dissemination of the data that originates from things rather than people. WoT is one of the enabling technologies which facilitate the dissemination of things data affordable and efficient. Thus, the number of everyday physical objects which use WoT is sharply increasing. WoT is one of the main enablers of the emerging paradigms such as the Internet of Things (IoT). WoT enables the IoT paradigm to be applied in a variety of areas of applications including healthcare, mining industry, environmental sensing, transportation and logistics, and so on [8,24]. For example, through the use of the WoT infrastructure, users can track the location and schedule of aeroplanes in real-time.1
With the increasingly diverse range of resources on the Internet, identifying, crawling and searching of the data that is disseminated by WoT remains a challenge. Today, the options for this purpose are extremely limited. To the best of our knowledge, the only working example of the WoT search engine is Thingful2 and none of the WoT search engines in the literature have been deployed for real-world or large-scale data. Furthermore, the Thingful initiation itself is still limited and significant progress is needed to expand this area. One instance of such limitations is the public availability of the collected data. For example, Thingful provides access to its data only via a dedicated UI. Another example of the limitations is the quick expiration of the data due to the highly dynamic nature of the IoT [29,28]. Graph of Things3 is another interesting project which aims to provide live things data in real-time, which is still limited and can be potentially expanded in terms of scope and capabilities.
There is another search engine, namely Shodan4 which also claims to be a search engine for IoT. The main difference between Shodan and WoT search engines such as Thingful, is that Shodan is basically designed as a search engine for hackers. It identifies and hacks into password protected devices connected to the Internet. However, it does not support the Web interface at all. Moreover, servers and routers as well as other Internet-connected devices have been archived with their IP addresses in its database. The website itself does not process sensor outputs. Due to its large and broad scope, catching everyday objects on this website is still difficult while servers and network devices constitute the majority of the things in its database. Due to ethical issues and scope matters, we do not include Shodan in our study.
The Intent based search, which is also known as intent oriented, is a popular trend in designing new search engines [48]. The existing approaches propose to either identify the intent of the search based on a set of features [14] or diversify the search results based on the known set of intentions [6]. For example, when a user searches for a product with given brand we can assume that they are looking to buy it as the same user has done it multiple times in the pas. On the other hand, the second approach can diversify the results over the set of possible intentions such as purchasing, reading reviews or finding similar products. However, the challenging issue in intent based search for WoT is to identify the set of possible intentions in the first place. One way to tackle this challenge, is to analyze the users and the contextual features of the things data. In the context of the previous example, the first step is to identify the possible/popular use cases for the page that contains product information. Then we would be able to apply different approaches to index the search intentions and prepare the results.
In this chapter, we conduct an extensive study on the current status of the WoT search and crawling and conduct an experiment to emphasize its applications in real-world scenarios. Our main contributions are summarized as follows:
• We propose a novel crawler and search engine, namely ThingSeek, that enables the collection of data from heterogeneous data sources. We address the needs of the future WoT search engines in our architecture. We demonstrate that how the data that is flowing between the frontend and the backend of WoT resources.
• We identify different data sources and crawl them. We use our ThingSeek crawler to collect a large dataset of things data. To address the intent based search, we propose the case scenario of flight delay analysis which can emphasize the application of WoT in our lives everyday.
• We study the general user interests on things data by using a real world query log dataset from an WoT search engine. We also analyze the characteristics of the collected things data including spatio-temporal distributions of things, data dynamics, and data quality.
• Based on the collected real-world things data and our analysis, we discuss future research challenges and identify open research problems to shed light on the future WoT research and development.
The rest of this paper is organized as follows. We provide a motivating scenario for WoT search in Section 2.2. We discuss the potential places to look for WoT over the Internet in Section 2.3. In Section 2.4, we discuss the best practices that we learn in things data acquisition and in Section 2.5 we demonstrate how the search engine can present the data for the users. In Section 2.6, we showcase an intention of search in flights data and demonstrate a possible use case for this data. Then in Section 2.7, we present the analytical results of the collected things data. We discuss some of the opportunities for further IoT research in Section 2.8. In Section 2.9, we overview the related works and Section 2.10 concludes the paper.
2.2 Motivating Scenario
We use the scenario illustrated in Fig. 2.1 to inspire the role of future engines for crawling and searching the WoT.

In our scenario, we focus on two types of users including smart devices and human users. Specifically, two types of search queries can be identified in this scenario, which are described as follows:
• Correlation based search: based on Yao et al. [45], searching and recommending things using heterogeneous correlations is a promising and interesting trend in WoT research. This type of search queries can be used by both smart devices and human clients to find the things of interest.
• Intent based search: another trend in WoT research emphasizes the role of the knowledge that is acquired from things in real-world applications. Ragget proposes intent based search as a promising research opportunity for WoT search [30]. Accordingly, this would provide the footpath for smarter search in IoT. Thus, application specific search queries can be manipulated to improve the effectiveness of WoT search in application. Yet, this type of query is mainly useful for human clients only as the knowledge or domain specific applications cannot be easily deployed by things.
We describe each part of the motivating scenario of Fig. 2.1 as follows:
1. Initially, sensor enabled physical things propagate their data such as sensor readings and meta-data through different mediums on the Internet. This includes, real-time maps, real time Web pages which use WoT technology and WoT platforms. A crawler engine in the next level would only have access to the visible WoT data sources on the Internet. The following steps are all activated by a user's request, which is submitted to the system as a search query. The format of the search query can be different based on the particular application.
2. A crawler engine identifies data sources and crawls them based on a pre-constructed crawling pattern. The purpose of the crawling pattern is to specify the amount of resources required to crawl the data. In addition, due to the heterogeneity of the data sources and deployed technologies, the crawler must be tuned to support, then integrate the used data formats.
3. Due to the lack of interconnection between data sources on the Internet, heterogeneous correlations are identified and used to construct networks of things. The key elements in the data, which enable us to create edges, are location, ownership meta-data and descriptive tags.
4. Pattern matching is the core of our analytic engine. It has a number of applications in our scenario. For example, it can be used to find matches for complex queries on correlation graphs. Furthermore, given the Things Correlations Graphs (TCG) from the previous steps, pattern matching can be applied to identify matching nodes from different data sources to form a larger enterprise TCG.
5. Smart devices have limited resources in terms of processing power and memory. In addition, providing unprocessed sets of all existing things that match a query, is not useful for human clients. Thus, in our scenario, the size of the search result is limited to contain k things only. Due to the ambiguity in the purpose of the search, we can select either a set of k closest things, k things with closest owners, k things that have the closest set of tags or a diversified result set. Results diversification can improve the quality of results in this stage, before they are presented to the users.
6. Alternatively, human users may use the search engine to either find things or search the knowledge that is acquired by the sensory data over the Internet. In this scenario, considering a case where a client is looking for things, two human users (John and Bob) searches for the flights to a specific destination. Assuming that they find at least two options with different airlines, they may pick one randomly. Assume that John's flight encounters a delay on the specified day and as he knows John, he wishes that he had booked the same flight as Bob. Thus, by predicting and indexing flight delays, the search engine can enable Bob to select the flight with possibility of delay.
7. Final results can be tailored and presented to the users based on the intent of search or types of things. For instance, a smart device receives a message that contains the list of top k things and a human client can receive a visualized result set instead.
This motivating scenario poses several major concerns including: (i) due to the limited capacity of machine users, the size of the response should be limited to k and thus, preparing the best response may require finding the most relevant and/or diversifying the things in the result set; (ii) based on the previous issue, given that the WoT resources are presented in singular form and are not correlated to each other, we are interested in digging the correlations and establishing a heterogeneous network of things using a scalable approach; and (iii) we are specifically interested to deploy the role of the WoT search engine in two use cases including taxi ridesharing and flight delay analysis.
2.3 Identifying Data Sources
The interactions with IoT can be realized in Machine-to-Machine (M2M) as well as Machine-to-Human (M2H) [43]. The M2M approach is mainly used for smart things and enabled by predefined APIs, e.g., RESTful APIs [16,5]. In contrast, M2H can include almost every object that are connected to the Internet and enabled using current Web protocols and existing IoT middleware. Pioneering IoT cloud services such as Xively,5 Paraimpu [26], ThingSpeak6 and Sen.se7 are some of the examples of IoT dedicated cloud services which provide infrastructure to store and share things data for various types of sensors. Nowadays, there are numerous examples of websites which focus on a specific type of applications such as tracking aircrafts,8 marine traffic,9 traffic jams10 or Raspberry Pi board.11
The number of cloud IoT platforms with open access data is limited and thus, identifying them is not difficult. For WoT enabled data sources, one can check the traces of existing WoT packages such as the ones from WeIO,12 WoT Code Forge13 and WoT Project Directory.14
In principle, not all things data appears in the form of Web Mapping and not every Web based map is related to things data. Web based maps have been used for a variety of purposes including presenting things data. From our experience, those Web pages that visualize things data have the following requirements: 1) containing an interactive map; 2) being publicly available; 3) being real-time; 4) being real-world; and 5) being within valid ranges.
IoT is usually updated in real-time and vintage maps are not very useful in this case. The real-world data is a key to find real physical things, thus, maps of virtual worlds such as game maps do not provide things data. Finally, key features of the data should contain proper values. Maps with encrypted data cannot be very useful for things data collection.
Based on the features of things data, which are mentioned above, we use the following procedure to identify the data sources: 1) the Web page should contain an interactive map; 2) data is presented inside the XMLHttpRequest (XHR) response of the requests that the page makes; 3) the response in the XHR may continuously be updated; and 4) data contains coordinates which are within the valid boundaries.
We leverage Web Mapping such as Google Maps which is the most dominant way of visualizing spatial data on the Web, to achieve the goal. Thus, we limit our search scope to the sources which contain a map. We use a set of keywords to narrow our search results to find such sources such as “real-time map of [application]”, “live map of [application]” and “tracker map of [application]”. In the search query, the term “application” can be replaced with any application of IoT such as flight. We also include some of the available IoT platforms such as Xively15 to the initial set of data sources.
2.3.1 WoT Enabled Platforms
The WoT concept describes approaches, frameworks and programming patterns that allow things to share their data through the World Wide Web. Currently, WoT is an active research area with a range of challenges and opportunities including security, resilience, intent oriented search, legal implications and so on [30]. Backed by existing WoT packages,16 these data sources create mashups to publish things data. One of the most popular WoT packages is the WoTKit [4]. Although some WoT packages have been used by IoT cloud services, we distinguish them from other cloud services (e.g., Xively) that are not developed based on the WoT. WoT can be applied in both of the traditional server (such as WeIO examples17) and the cloud based (such as SenseTecnic18) environments.
2.3.2 Web Mapping Enabled Data Sources
Web Mapping is the process of using online maps to browse and visualize geospatial data in a Web environment (e.g., Google Maps) [11]. Web Mapping is more than just Web cartography. There exist a wide variety of use cases for Web Mapping presentation of the data. In fact, we realize that a considerable number of Web pages with maps are providing things data and thus, include them in our list of data sources. The main categories of such data sources are as follows:
• Real-time Transportation Information Services: Real-time tracking services (e.g., FlightRadar2419 and Arrivebus20) are designed to process and share the coordination of public transport services generated by embedded GPS devices. Unlike IoT cloud platforms, these services are often publicly available and data is visualized via Web Mapping. The most dynamic attributes of the objects in these networks are location-related including latitude and longitude.
• Urban Crowdsensing Services: Urban crowdsourcing services provide a platform for people to report and share their observations of things around them. For example, Waze21 provides a mobile phone application for users to report their locations, traffic jams, roadworks or police attendances. Although the collected data from this type of platforms is not originated from embedded physical sensors, the information is still related to physical or virtual things that people observe around themselves. Most often, the data is available through a Web based map.
• Public Environmental Sensing Services: These services include platforms that share the data originated by environmental sensors such as weather stations and pollution metrics. The data is available through a Web based map interface available to public.
2.4 ThingSeek Crawler Engine
To minimize the required amount of work when collecting data from a new source, we have broken down the crawling procedure into a certain set of steps in a unified framework.
Fig. 2.2 illustrates the main features of the ThingSeek crawler engine. In the first step, a URL generator initializes the queue of queries. Each entry in the queue is supplied with certain parameters to construct a query to a page or a specific location. The parameters can be the time window, the boundaries of the querying region and/or other parameters. Then for each entity in the queue, a reader function reads the selected part of the page, and the contents are converted to a set of vectors and refined using a refiner. The data for each subset is separately held until all subsets are refined where we merge all of the subsets of the resource's data. In this step, a specific enricher can be used to collect the missing information, if any, from other sources. This can, for example, fill the incomplete fields such as IP address by acquiring them from Shodan. Finally, the collected data from different sources are integrated and stored on a distributed backend.
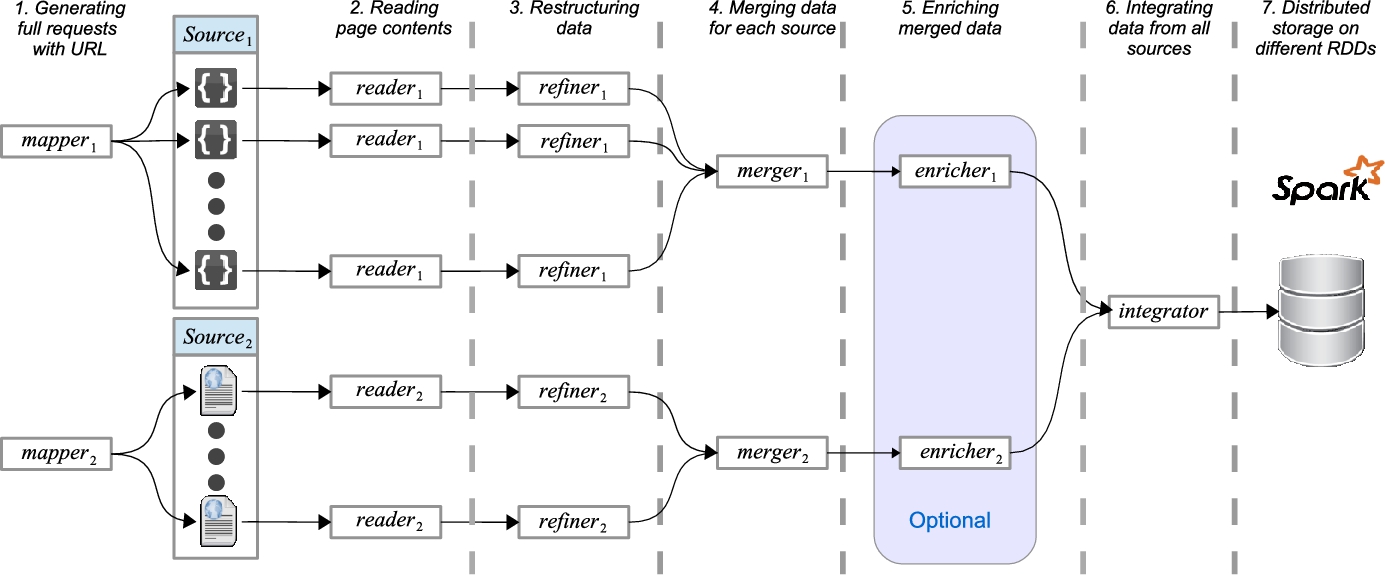
Due to the size and dynamics of the sensor-generated data, things data sources often provide a subset of their data with a call to their API. Thus, pagination techniques such as location-based queries are deployed to present the data. We use the same mechanism through implementing the URL generator. The URL generator plays a key role in adjusting the workload on the data source. It converts a set of spatial segments to a sequence of queries which can be submitted via the API of the data source. Thus, a highly populated area can be placed multiple times in the processing queue while an empty area may appear only once (or not appear) in the queue. For example, through a URL generator, URL b will be repeated three times for others during a scan as it contains more dynamic objects than others:

We have developed ThingSeek using a set of tools to collect, process and visualize the dataset. Some of the tools we used are as follows: R programming language, SparkR, Apache Spark 1.4.1 and Rails framework.
To show how the data can be collected from a given data source, we can refer to Fig. 2.3. As shown, the data is flowing between two main parts: a frontend which resides on user's side and a backend which resides on the server. The frontened, generates the queries and send them to the service through a pre-designed API. The queries are for example the existing records within a given area. The queries are resolved through the given model and the data is extracted from the database. Then, it is send to the user and a javascript function updates the given div on user's page. The API address and the structure of the XMLhttpRequest that is sent to the server can be identified and used by the crawler engine.

2.5 ThingSeek Search Engine
In this section, we demonstrate the functionality of the proposed ThingSeek framework.
2.5.1 Search by Human Users
Through a Web-based user interface, a human user uses the search engine to acquire information from sensors. For example, a user would like to get information from nearby weather sensors. Fig. 2.4 shows a screen shot of our Web-based interface where each red spot denotes an object in the result set. Users can use the query panel to generate new queries and the result can be shown as a list of sensors or through an interactive map as shown. However, users would be more interested in acquiring knowledge from the data streams rather than finding the sensors. Thus, we added an interactive plot maker to generate real-time plots.

2.5.2 Search by Smart Machines
In this scenario, we consider a smart object querying our search engine. We developed a Machine-to-Machine (M2M) interface based on the architecture in Fig. 2.6 to enable things to use CoAP to connect to our server and submit their queries. To use the interface, on the client side, users can use any of CoAP implementations on CoAP website22 to send a GET or POST message to our server. The message payload contains keywords followed the desired number of the result set at the end. The server would provide the results in response.
2.5.3 Query Results Preparation
2.5.3.1 Human User
In this section, we propose our approach for query resolution and the indexing approach to enable large-scale search for IoT. Fig. 2.5 shows the procedure of retrieving query results in ThingSeek. As the figure shows, the query processing workflow works as follows.
1. Queries, which are formed as pairs of keywords and locations, are fed into the system. The query structure is inspired from the Thingful search engine.
2. The Queries are processed in two steps: location based filtering and keyword based filtering and finally the results are updated with the most recent values before being presented to the user.
3. We use approximate values based on indexed data in the location filtering step. The location filtering is facilitated using the R-Tree data structure to enhance the flexibility and the performance of the system.
4. In the keyword filtering, the results of location filtering are processed for each given keyword accordingly.
5. Before presenting the results to the user, we update the results with the most recent values using the data source index for each object in the result set. After preparing the final result set, we update the result continuously when presenting to the user. This would provide a better user experience of real-time data.

Due to the highly dynamic nature of the things data, analytical result may change promptly. In addition, raw things data are often meaningless and not very useful by themselves. Thus, we also designed a Web-based interface to visualize the things data as well as query the things data.
2.5.3.2 Smart Objects Interface
As objects are becoming smarter, they become the main producers and consumers of information. Thus, we created an interface for smart objects to enable them to query the dataset. To cope with the existing standards, we used Constrained Application Protocol (CoAP), which is a protocol for simple electronic devices to allow them to communicate interactively over the Internet. We initialize a CoAP based RESTful interface for smart objects to search for things in our database. Although CoAP contains a discovery tool, its scope is limited and lacks flexibility.
Fig. 2.6 compares our architecture with CoAP discovery and illustrates how the ThingSeek's machine interface serves queries. For example, a smart air conditioning system searches objects related to air or weather to plan its cooling strategy. As shown, with the use of CoAP, a querying object can only enquire objects on the same network via distributing discovery messages to all objects on the network. Following this, the issuer gets objects' responses if they match to the query. However, this approach can limit the scope and effectiveness of the search. To resolve this issue, in our ThingSeek architecture, the smart object uses a service to send its query directly to the search engine with a POST or GET message. Due to the power, network and computing limits of things, ThingSeek should respond the query with a number of messages containing only a small number of results. In this regard, we use the ECS approach [33] (Extract-Cluster-Select) to provide the best response with limited size. The ECS approach extracts co-location (objects in the same location or very close to each other) and co-ownered (objects with the same owner) correlations between things and forms a unified Things Correlation Graph. Then, the nodes are clustered into k groups and finally a number of things from each cluster are selected and returned. It is designed to rank objects based on their correlations and responds the query with a limited number of the top-k results based on the weight of their correlations with the query issuer. Finally, the URI of the corresponding data source is located and crawled to get the latest sensor readings. If the object is not found in the index, the latest cached records will be supplied.

2.6 ThingSeek in Application: Flight Delay Analysis
In the previous chapters we already presented a number of examples of the search results for searching things. In this chapter, we present results for a novel application in the aviation industry. Specifically we focus on flight delay analysis. For our case study, we use three different data sources including a real-time flight data, air quality index and real-time weather data. While finding the trajectories of aeroplanes in real-time can be interesting for aviation professional, value added results such as flight delay predictions can be widely used.
The results of our study fall into two categories. First, a search result can provide the list of contextual features that can be identified based on the selected things data sources. Secondly, additional results can precisely show that the extent of effectiveness for a given feature such as temperature. We briefly present the results as follows.
2.6.1 Model Features
Due to the heterogeneity of things data, the semi-structured or unstructured sensor reading data that is provided by different data sources can widely vary based on our selection of the dataset. An intra-source feature model is an interesting showcase to demonstrate the correlation between different data sources. Accordingly, Fig. 2.7 shows the list of the features that we have extracted from our case study.

In order to provide a clearer image, we describe the characteristics of each feature in Table 2.1.
Table 2.1
Feature Description for Flight Delay Search
| Source | Feature | Description |
| Flight | Time of day | Represents the time of the flight during the day. |
| Day of week | Represents the day of the flight during the week. | |
| Departure/Arrival Delay | Represents the departure delay and the arrival delay of the flight in minutes. | |
| Origin/Destination | Represents the origin airport, city, country of the flight. | |
| Airport | Represents the airport where the flight departs or arrives. | |
| Airline | Represents the airline that operates the flight. | |
| Scheduled/Actual Departure | Represents the scheduled/actual departure time of the flight. | |
| Scheduled/Actual Arrival | Represents the scheduled/actual arrival time of the flight. | |
| Aircraft Type | Represents the airplane type of the flight. | |
| Flight Number | Represents the flight number. | |
| International/Domestic | Represents if the flight domestic or international. | |
| Weather | Temperature | Represents the current temperature of the weather at the airport where the flight departs or arrive. |
| Dew | Represents the dew at the airport. | |
| Humidity | Represents the Humidity at the airport. | |
| Wind Direction | Represents the Wind Direction at the airport. | |
| Wind Speed | Represents the Wind Speed at the airport. | |
| Wind Gust | Represents the Wind Gust at the airport. | |
| Wind Chill | Represents the Wind Chill at the airport. | |
| Raining | Represents the Raining at the airport. | |
| Snowing | Represents the Snowing at the airport. | |
| Visibility | Represents the Visibility at the airport. | |
| Pressure | Represents the Pressure at the airport. | |
| Heat Index | Represents the Heat Index at the airport. | |
| Air Quality | aqi | Represents the air quality index at the airport. |
| PM2.5 | Represents Particulate Matter 2.5 micrometers. It is a for particles found in the air, including dust, dirt, smoke, etc. | |
| PM10 | Represents particulate matter 10 micrometers or less in diameter | |
| NO2 | Represents the chemical compound Nitrogen dioxide. | |
| SO2 | Represents the chemical compound Sulfur dioxide. | |
| O3 | Represents the Ozone. | |
| CO | Represents the Carbon monoxide. |

2.6.2 Feature Analysis Results
For this case study, we select seven airports from the largest cities of China. The cities are: Beijing (PEK), Shanghai (SHA), Guangzhou (CAN), Wuhan (WUH), Chengdu (CTU), Harbin (HRB), and Dalian (DLC). In our case study, we collect the data of all flights between these cities. The distribution of the number of flights varies according to the city size and the population number. The airlines operate the flight between these cities are: China Air (CA), Shanghai Airlines (FM), China Eastern Airlines (MU), China Southern Airlines (CZ), Juneyao Airlines (HO), Hainan Airlines (HU), Xiamen Airlines (MF), Sichuan Airlines (3U), Shandong Airlines (SC), Chongqing Airlines(OQ), Grand China Air (CN), Shenzhen Airlines (ZH), Spring Airlines (9C), Tibet Airlines (TV), Beijing Capital Airlines (JD), Chengdu Airlines (EU).
In our study we focus on China, where environmental factors can be concerning due to the industrial development. We get around 14,000 records for more than 800 flights between the selected cities. Fig. 2.8 shows a screenshot of a few records from the flights dataset.

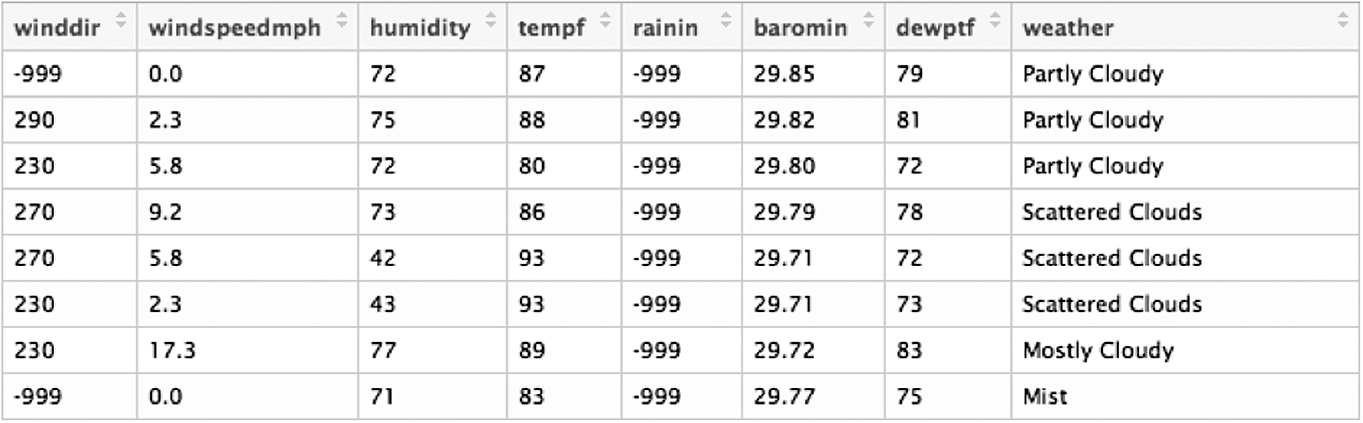
We also crawl 2091 records for weather data from public and private weather stations. Fig. 2.9 shows a screenshot from a number of records in our dataset.
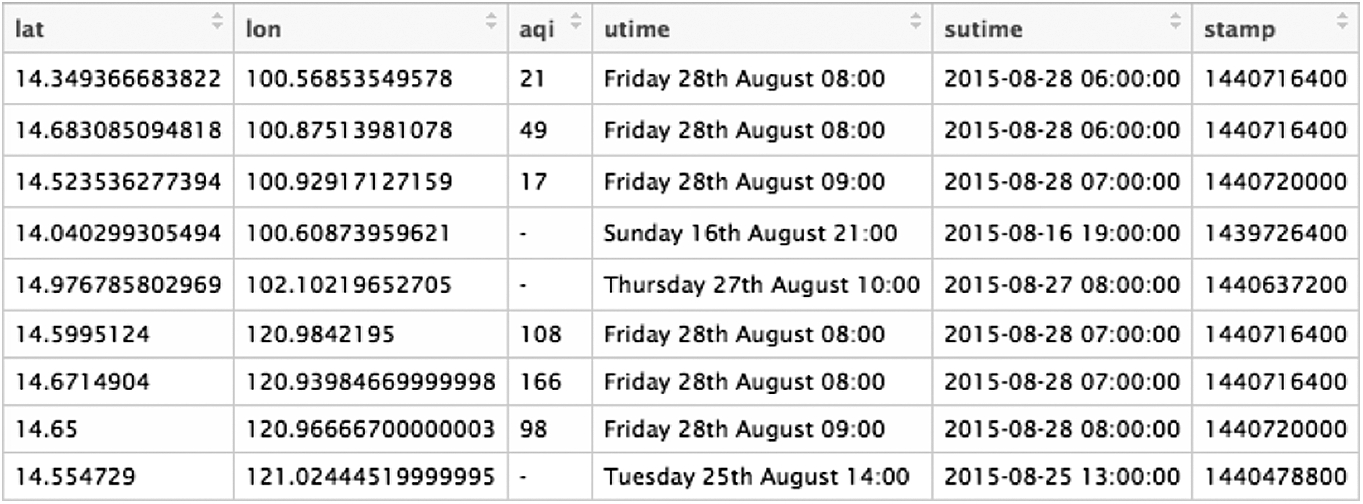
We also collect 3084 records for air quality data near the airports. Fig. 2.10 shows a screenshot from a number of records.
The following results would be shown to the user after a search for the flights data. Fig. 2.11 compares the delay at departure for different airlines. Therefore, the user can easily identify the airlines which have the least and the most delay in real-time.

Another interesting output from this case study is shown in Fig. 2.12, which can be used by the user to identify the airports which have the least and the most amount of delay for the flights departing from them.

Finally, Fig. 2.13 shows the results of a multiple linear regression analysis which shows the identified features and the extent that each feature contributes towards the delay at departure from the our dataset. These results are prepared and displayed in almost real-time and would enable the users to not only find things from performing search in IoT, but also acquire more knowledge and deploying it for their application.

2.7 Things Data Analysis
In this section, we present the result and statistical analysis of things data and queries collected during multiple routine crawling rounds. We investigate the results from user-related and things-related points of view and then we compare the distribution of IoT and queries data.
2.7.1 User Interests
We investigate user interests from different angles including Popularity Trends, Search Queries Statistics and comparing the Things vs Query Distribution.
2.7.1.1 Popularity Trends
A glimpse into IoT keyword trends over Google Trends,23 suggests that the public interest towards IoT with its most popular abbreviations has been steadily increasing over the past few years.
To further understand this trend, we select some of the most cited IoT platforms (i.e., Xively, ThingSpeak, sensetecnic.com, and Thingful) from the literature and compare their popularity using Alexa Web Ranking.24 Fig. 2.14 shows the results for the selected websites during six months from 16 Apr., 2015 to 15 Oct., 2015. Accordingly, the popularity of cloud based IoT platforms (e.g., Xively) have been gradually decreasing throughout the last six months while the popularity of Thingful search engine has been increasing during the same period. Clearly, a powerful search engine for IoT can help attract users' interests.

2.7.1.2 Search Queries Statistics
Analyzing real-world WoT search queries can provide valuable insights for the design and development of future WoT search engines. To get the statistics, we use a dataset of search queries from the Thingful search engine. Fig. 2.15 shows the number of WoT search queries per day. It has been gradually increasing through the time and the average number of queries have been tripled since the beginning. However, in three points of time, during May, June and October, 2014, an abrupt increase in the number of queries per day can be observed. One of the reasons for such increase can be the introduction of new features by the search engine such as embedding and the release of the beta version. This also denotes that any novel improvement in this area can attract many users in a relatively short period of time.

According to the query logs, 84.9% of queries are associated with keywords. An investigation over the popular keywords yields Table 2.2. The category is selected from Thingful's predefined categories including Energy, Home, Health, Environment, Flora and Fauna, Transport, Experiment, Miscellaneous. Apparently, environmental sensing related keywords such as “air quality” and “radiation” have been very popular amongst users.
Table 2.2
Most Popular Keywords and Their Categories
| Keyword | Freq | Category | % | |
| 1 | air quality | 71,700 | environment | 61.7 |
| 2 | sensor | 3348 | misc. | 2.8 |
| 3 | ship | 1851 | transport | 1.6 |
| 4 | radiation | 1825 | environment | 1.5 |
| 5 | earthquake | 1601 | environment | 1.4 |
| 6 | gamma | 1131 | environment | 1.0 |
| 7 | weather | 876 | environment | 0.8 |
| 8 | shark | 851 | flora and fauna | 0.7 |
| 9 | temperature | 581 | environment | 0.5 |
| 10 | camera | 397 | home | 0.3 |
| 11 | car | 392 | transport | 0.3 |
| 12 | iphone | 271 | home | 0.2 |
| 13 | fridge | 259 | home | 0.2 |
| 14 | webcam | 255 | home | 0.2 |
| 15 | aircraft | 247 | transport | 0.2 |
| 16 | sharks | 245 | flora and fauna | 0.2 |
| 17 | energy | 242 | energy | 0.2 |
| 18 | food | 239 | home | 0.2 |
| 19 | netatmo | 216 | environment | 0.2 |
| 20 | coffee | 177 | home | 0.2 |
| 21 | traffic | 168 | transport | 0.1 |
| 22 | transport | 166 | transport | 0.1 |
| 23 | cars | 163 | transport | 0.1 |
| 24 | raspberry pi | 159 | experiment | 0.1 |
| – | other keywords | 28,771 | – | 24.6 |
| – | Total | 116,131 | – | 100 |

The category analysis in Table 2.2 shows that for the majority of the queries, transportation related keywords constitute less than 3% of the search queries. On the other hand, keywords that are related to the environmental scanning, constitute more than 67% of the search queries. Thus, in assigning computing resources, environmental data sources should receive more attention. That is, more effort is needed to make the environmental data sources updated and in this way, we can use our computing resources more efficiently.
2.7.2 Data Characteristics
Things data is semi-structured as the popular format in things data transmission is JSON. To provide a more detailed vision over things data characteristics, we investigate data source types and the dynamics and the quality of things data.
To grasp a more detailed image of IoT clouds and WoT, Table 2.3 shows WoT and IoT clouds and the number of non-private things which use these technologies.
Table 2.3
WoT vs. IoT cloud services
| Data Source | Public Sensors (Things) | Type |
| Xively | 67,000 | IoT Cloud |
| WoTkit | 4065 | WoT |
| ThingSpeak | 3571 | WoT |
| WikiBeacon | 30,052 | WoT |
| ISMNa | 2080 | WoT |
a International Soil Moisture Network
2.7.2.1 Spatial and Temporal Distribution of Things
Understanding the spatial and temporal distribution of IoT and query updates is valuable for identifying the existing gaps, which can help in predicting the trends of searches and updates. To model the spatial gaps between IoT and queries, we use the Earth Mover's Distance (EMD) measure. EMD describes the normalized minimum amount of work required to transform one distribution to the other. In our case, given the two distributions matrices of things, ![]() and
and ![]() , which have been taken in timestamps
, which have been taken in timestamps ![]() and
and ![]() respectively, we want to measure the amount of changes in the latter distribution (
respectively, we want to measure the amount of changes in the latter distribution (![]() ) from the initial distribution
) from the initial distribution ![]() using
using ![]() measure. Therefore, we can monitor the changes in distribution over the time.
measure. Therefore, we can monitor the changes in distribution over the time.
We summarize the two datasets into a list of density indices shown in Fig. 2.17. The length and width of each record density index is 5 degrees of longitude and 5 degrees of latitude, respectively. The EMD yields 0.4338619 for an image of things data and the whole queries dataset.
In the next step, we want to know whether the patterns in Fig. 2.16 and changes in the distribution of things recur over the time. Thus, we perform the same analysis over a period of time on how the spatial distribution of things changes through the time. In particular, we use the emdist [38] implementation to approximate the EMD score for each transition. Fig. 2.18 shows the EMD score for a given period of time in 48 timestamps which we have collected within 48 hours. The curve shows that in each given timestamp ![]() , the value of
, the value of ![]() . Thus, the EMD score for
. Thus, the EMD score for ![]() is 0 since there is no difference between the distribution matrix in
is 0 since there is no difference between the distribution matrix in ![]() and itself. Shortly, a huge amount of change is observed between
and itself. Shortly, a huge amount of change is observed between ![]() to
to ![]() and later the EMD score continuously decreases as the distribution returns to its initial status. The very same pattern recurs on the next period of time. As a result, we understand that the geospatial distribution of things goes back to its original state over a period of time (in this case, after 24 hours). This result can assist in setting up new strategies for saving computing resources when updating the things dataset. For example, during an update process, we can scan the areas with higher densities more often than the lesser dense areas.
and later the EMD score continuously decreases as the distribution returns to its initial status. The very same pattern recurs on the next period of time. As a result, we understand that the geospatial distribution of things goes back to its original state over a period of time (in this case, after 24 hours). This result can assist in setting up new strategies for saving computing resources when updating the things dataset. For example, during an update process, we can scan the areas with higher densities more often than the lesser dense areas.


2.7.2.2 Data Dynamics
Things data are widely regarded as highly dynamic and volatile [29]. Although several approaches have been proposed to tackle various problems caused by the dynamic nature of IoT, no other work investigates the real-world things data on their dynamics. With our first-hand dataset collected, we observe the following interesting aspects on things data:
• Only a small portion of things data changes frequently. This finding can be easily checked by measuring the number of things and the amount of data that is being updated (new sensor reading during the next IoT scan). For instance, Fig. 2.19 shows the ratio of things which have updated their previous readings from nearly 70,000 objects on the Xively network, which is a part of our things dataset. The ratio of updated rows ![]() , is obtained from the following equation:
, is obtained from the following equation:

where if D is the domain of sensor readings, ![]() denotes sensor readings in timestamp i,
denotes sensor readings in timestamp i, ![]() is a function which returns the new rows in
is a function which returns the new rows in ![]() and also
and also ![]() . Here, the time difference between each
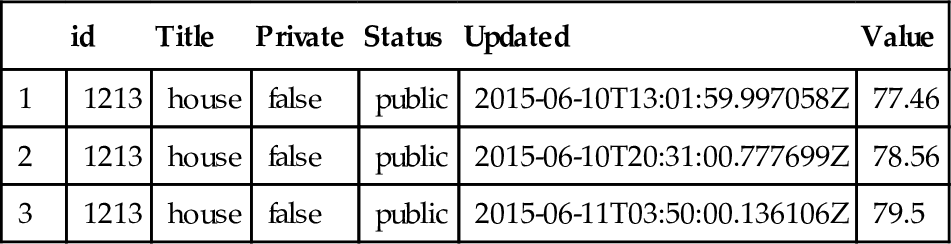
. Here, the time difference between each ![]() and j is 6 hours. As shown, up to 23% of objects have new sensor outputs during the experiment. Furthermore, only a small part of each tuple gets updated each time. Table 2.4 shows an example from the Xively platform. We only select a small subset of the attributes (77 attributes in the original version) for the illustration purpose. As it shows, only the value attributed is being updated every time.
and j is 6 hours. As shown, up to 23% of objects have new sensor outputs during the experiment. Furthermore, only a small part of each tuple gets updated each time. Table 2.4 shows an example from the Xively platform. We only select a small subset of the attributes (77 attributes in the original version) for the illustration purpose. As it shows, only the value attributed is being updated every time.

Table 2.4
Example of Selected Parameters from a Set of Readings of a Specific Sensor in Xively
| id | Title | Private | Status | Updated | Value | |
| 1 | 1213 | house | false | public | 2015-06-10T13:01:59.997058Z | 77.46 |
| 2 | 1213 | house | false | public | 2015-06-10T20:31:00.777699Z | 78.56 |
| 3 | 1213 | house | false | public | 2015-06-11T03:50:00.136106Z | 79.5 |
• Frequencies of updates for the same object from different data sources can be highly variant. For instance, with every flight tracker website the sensor readings for flights are updated several times per second, while in MarineTraffic the sensor readings for ships and vessels are updated every three minutes.
• Similar to the geographical distribution of objects, IoT dynamics may follow patterns over the time. As Fig. 2.19 shows, the ratio of updated values decreases when increasing the number of steps. This indicates that many of the updated tuples return to their initial values after a while. For example, an air quality egg, which is an egg shaped device to measure indoor temperature and air quality, may report the similar temperature in 24 hours.
2.7.2.3 Data Quality
We observe that different data sources, may share the data that is being generated by the same sensors. One of the interesting points in the integration of things data would be knowing the redundancy. Also consistency of the redundant data will be an interesting topic for researchers.
Table 2.5 shows a list of redundant sources of things data and the type of the things that they cover. We select a few data sources which seem to be more popular from three different categories: flight tracking and marine traffic tracking. Every object from these sources is associated with an identifier which can distinguish it from other objects. We merge the data from all websites in each category to get the ratio of inclusiveness. This measure denotes the rate of the objects which exist in the data source and the union set of objects for the corresponding category.
Table 2.5
Transportation Data Sources with Overlapping Set of Objects
| Application | URL | Scope | Novel Data | Inclusiveness | Delay |
| Flight tracking | http://www.flightradar24.com | Worldwide | ✓ | 99.99% | – |
| https://flightaware.com/live/ | ✓ | 0.01% | ✓ | ||
| https://planefinder.net | ✓ | 0.01% | ✓ | ||
| http://www.radarbox24.com | ✓ | 0.01% | ✓ | ||
| http://www.radarvirtuel.com | ✓ | 0.01% | ✓ | ||
| http://tinyurl.com/klmliv | Airline | ✓ | 0.01% | ✓ | |
| http://tinyurl.com/perthliv | Airport | ✓ | 0.01% | ✓ | |
| Marine traffic tracking | http://www.marinetraffic.com | Worldwide | ✓ | 100% | – |
| http://www.shipspotting.com/ais/ | ✓ | 0.01% | ✓ | ||
| http://ship.gr/map/index.htm | × | 100% | × | ||
| http://www.cruisemapper.com | Cruise | ✓ | 0.01% | × | |
| http://www.cruisin.me/cruise-ship-tracker/ | × | 100% | × |

For the captured flight data, the objects information from different sources is quite different. There are two main reasons associated with this issue. The first reason is the delay in updating the information. The second reason is the loss of some values for some flights. For example, the flight registration is provided by a data source while the same attribute for the same flight is not set in other websites. For the marine traffic tracking websites, we observe that the majority of niche websites are using the same techniques and data as the source website. No delay is observed while the ratio of overlapped data is higher than flight trackers.
2.7.3 WoT vs. User Interests
As mentioned, the analysis of the distribution of things and queries can lead to finding more efficient strategies for storing and retrieving things data.
Our observation shows that in many cases, there is a huge difference between the distribution of the queries and the distribution of the things data. Figs. 2.16(D), 2.16(H) and 2.16(P) show the local distribution of the queries from Thingful in Asia, Australia and the Europe, respectively. We do not include other continents such as the Americas and the Africa as their results do not add new information on top of the selected regions. As the figures show, in each region most of the queries are focused on specific regions such as India, East Coast of Australia and London.
We also investigate the distribution of the things and its changes over the time in each region separately. We randomly pick a 12-hour time frame and conduct the analysis over three snapshots all over the world. Due to the space limit, we select three snapshots and investigate the distribution of the things in each region. The first snapshot is during evening, the second is during early morning and the third is around noon. The snapshots are all based on the Australian Central Standard Time (ACST). In Asia, during the afternoon most of the things are concentrated on East Asia (Fig. 2.16(A)) while later in the morning the concentration of the things transfers to the South West Asia (Fig. 2.16(B)). In the next snapshot, the concentration moves towards South East Asia again (Fig. 2.16(C)). A large part of this change is due to the existing large ratio of flight data comparing to the other types of things data in Asia. However, in Asia, no record demonstrates a good match between the distribution of things and the distribution of the queries, while most queries are concentrated on India (see Fig. 2.16(D)).
In Australia, things are mostly concentrated on the east coast of Australia during evening time (Fig. 2.16(E)) which is a good match for the distribution of the queries (Fig. 2.16(H)). Later as Figs. 2.16(F) and 2.16(G) show, many things are present in other places as well as around the capital cities of Sydney and Melbourne. Thus, a huge gap exists between the distribution of things and queries in this region. However, unlike Asia, the distribution of the things partially matches with the distribution of the queries over the two cities.
In the US, the snapshots demonstrate the change of distribution throughout the time during daylight. The distribution of things continuously spreads from the east coast to the west coast as Figs. 2.16(I), 2.16(J) and 2.16(K) illustrate. However, there is a loose connection between the queries distribution 2.16(L) and things distribution over the New York.
The situation is quite different in Europe. As Figs. 2.16(M), 2.16(N) and 2.16(O) show, a large number of things are constantly concentrated over London area and partially over Germany which is a very good match with the distribution of the queries in this part of the world (Fig. 2.16(P)).
In overall, results show that the distribution of the things trajectories in Asia is mostly around the East Asia while the distribution of queries is utmost around South Asia, which creates a gap between the supply and the demand of data in terms of geographical distribution. Another evidence which also shows that this result is plausible, comes from Google Trends. It suggests that IoT is more popular in India rather than East Asia as well. Thus, enormous amount of resources could be saved through saving update frequency for objects located in East Asia.
2.8 Discussions
In this section, we provide further discussions on the challenges and opportunities for IoT research and development.
2.8.1 Challenges in WoT Data Discovery
Things data discovery is important towards establishing the next step in the life of the Internet. Since the early days of IoT, several technologies have been specifically proposed to share things data. There have been several successful stories for cloud based IoT platforms such as Xively and Paraimpu. They are often designed to provide global support for almost any type of sensors or actuators.
However, the community of users does not restrict themselves to what these IoT platforms provide. An increasing number of techniques are being used to publish sensory data on the Web. The number of sensors, various types of applications and the increasing demand for real time data have driven to reinvent various techniques which are previously used for other purposes (e.g., Web Mapping). In this case, a large number of niche websites have been developed to publish the data that are generated by specific sensors or for specific applications. In fact, the volume of the publicly available information provided by these websites is much more than the general purpose IoT cloud platforms. However, identifying these websites is similar to finding a needle in haystack as there is no comprehensive list of such websites, many of which have been created recently after the success of similar applications such as the flight trackers.
Another challenge is the structure of the data that is provided on the Web. For a large portion of the websites, the data should be collected from the deep Web. For example, to obtain the results from a flight tracker website, several parameters need to be set and passed. Otherwise, a small subset of the data or an empty set will be provided by the server. In some cases, authentication may also be required as a part of the process when accessing the data.
Unlike other types of the information on the Web, things data mostly are presented in a structured or semi-structured format. The structure of the data widely varies from one website to another. In addition, in many cases, the parameter names are not self descriptive and these parameters need to be demystified manually.
2.8.2 Other Challenges
Our dataset can be used for a variety of purposes in the IoT research and development, including correlation discovery between things [44], things data storage [21,15], context aware computing for IoT [25] by merging sensor readings from different sources such as environmental and transportation sensors, point of interest recommendation [46] and other active IoT research areas which may need real-world data.
2.8.2.1 Data Integration
Continuous retrieval of things data is very challenging. Some of the sources demand authentication before providing the access. In many cases, data for the same object (e.g., an aircraft) is being broadcasted by different data sources. Furthermore, in some cases, each available source may only provide partial information for an object. The similar issue affects merging data for the same resource. For example, the results of parsing objects data for a single resource have different length and parameters which need to be integrated at the end. Lastly, many data sources limit their response length due to load balancing concerns. We do not fully resolve all challenges in the integration but rather, we use an efficient approach to integrate the data from different sources for the purpose of our research. However, the integration of things data is more challenging than what is believed and more research in this area is required in the future.
2.8.2.2 Scalability
Collecting, processing and storing WoT data can be a time consuming procedure, particularly if the size of the dataset is large. As the number of sources and objects increases, which might count in billions, using one instance of the crawler would be very inefficient. In particular, dramatic difference between the update rate of different data sources which also partially depends on their size, can be challenging. Furthermore, technical failures of one resource may affect collecting data from other data sources in the same chain. Thus, we use a distribution strategy to coordinate different instances of the crawler running on different machines.
2.8.2.3 Archiving WoT Data
WoT is the main channel for disseminating Big Data generated by things. The volume, velocity and the variety of the data generated by things are enormous. The amount of the data that is already being published from 20 things data sources on the Web, which we estimate to be more than 100 TB a day, is already comparable to the amount of data that is being generated by users on social networks. With the rapid growth of the IoT, in the near future, new techniques will be required to effectively and efficiently process and store things data.
Currently, to the best of our knowledge, there is no popular website for archiving the publicly available things data. In this regard, the traditional approaches need to be revised for the new era of the IoT. The result can be valuable to many core applications such as WoT search while we compromise on some issues to make the impossibles possible. For instance, we discover that based on the changes in the geographical distribution of objects, a crawling strategy can be issued to capture the most updated data in the least amount of time. Through creating spatial and per resource indexes, the process can also become more optimized.
2.8.3 Research Issues
Based on our observation, correlation based search for WoT search and data management services should tackle the following issues:
• Discovery. Indeed, there is no universal directory of IoT connected devices due to a number of reasons. Firstly, IoT is not a unified network or platform as heterogeneous types of sensory data are publicized using a variety of technologies and thus, it is not straightforward to identify things data sources on the Internet. Secondly, most works on WoT search have used simulated or small scale datasets and, as yet, the current status of IoT is not investigated by other works [49]. Thirdly, given the security and privacy concerns of the IoT, the majority of sensory data sources are kept private and not revealed to the public, making it impossible to collect and process that data.
• Correlation extraction. The heterogeneity of the nodes of the IoT network implies a variety of correlations which can be defined across those nodes. However, unlike the traditional Web documents, which are correlated using hyperlinks, all of the correlations in IoT are implicit and none is explicitly demonstrated. Given the scale of the streaming sensory data in IoT, it would be very complex to capture all types of correlations on the fly. Moreover, in correlation based WoT search the correlation of the querying user with other nodes is required to provide the best results.
• Network matching. It is defined as finding the top-k matches in a data graph for a given subgraph. Network matching is a core function that lies at the heart of things data management and querying due to a number of reasons. Firstly, open linked data and service descriptions are widely deployed for Wireless Sensor Network as well as the IoT [36,12]. Resource Description Framework (RDF) descriptions are useful in providing semantic foundations for the dynamic networks of things, where each node is provided with a set of descriptions [3]. Secondly, merging different networks to create an enterprise correlation graph is a challenging task. Having the network of networks where each sub-network is a collection of things in IoT, finding the best matches to integrate all networks is NP-Hard. Thirdly, in the IoT, things may have more than one service description and very often, different things can share the same description. Thus, assigning unique labels to things based on their service description in a semantic network is not viable in the real-world.
• Query resolution for smart machines. Due to the limits in the processing power and memory of the smart machines, the size of the response to the query made by a smart machine should be limited. Thus, only a subset of the result set should be returned to the machine user. In this case, as well as other scenarios when the user is a human being, a good result subset is a subset of correlated things. One example is the search locality concept where only things in the same area are returned as a result. However, due to the heterogeneity of the correlations in the IoT, a combination of the correlations can be selected to prepare the result set. In this case, rather than returning the things that are locally correlated with the query maker, we need to balance the correlations in order to get the best result set. However, due to the lack of things data, this problem yet has not been studied in detail.
• Intent based search. Intent based search is proposed as one of the strong application areas for searching the IoT [30]. It is difficult to identify the users' search intention only by using the query keywords and the ambiguity can cause high degree of fuzziness in the result set [35]. Modelling the user's intention can vary significantly across different applications. Given a sub-scenario of taxi ridesharing, taxi search engines, which are equivalent to ridesharing applications, are designed to find the nearest taxi. However, the intention of users in this case is not only to find the nearest taxi, but rather find the most economical taxi which can be booked conveniently, while traditionally it is assumed that when the nearest taxi is found, it is then booked. Considering the consequences of selecting taxis that cannot be easily booked can change the solution fundamentally and thus, increase the complexity of finding the optimal taxi.
• Knowledge acquisition from things data. In addition to acquiring the most relevant things in query results or finding the most optimal solution for an intention search, from the motivating scenario we know that users are more interested in acquiring knowledge from sensory data. In the case of flight tracking and management, one of the major intentions of flight data analysis is to understand the parameters that affect flight delays in order to predict flight delays beforehand. However, previous work in this area either consider only one dataset and/or rely on using historical data [37]. Nowadays there are a variety of online tools available. For instance, flight tracking software such as the website FlightRadar24 [1] are currently very popular. Using the real-time sensory data from heterogeneous data sources requires more complex and deeper analysis of the parameters that affect flight delays.
2.9 Related Work
Over the past few years, the WoT has received increasing attention from researchers and practitioners. In the earlier days, Atzori et al. [2] offers an initial survey on the IoT research. Accordingly, there exist manifold definitions of the IoT paradigm within the research community. Each definition may view this paradigm from a specific angle including things oriented, Internet oriented and semantic oriented definitions. More specifically, based on all these definitions, a wide variety of networking and sharing technologies have been used to enable the future IoT including but not limited to the Web of Things (WoT) [30], RFID, Near-Field Communication (NFC), middleware and the Wireless Identification and Sensing Platform (WISP).25
Some researchers have claimed that the IoT is implemented with the technologies specifically designed for the purpose of being deployed in IoT [40]. Thus, it is argued that the IoT already exists but only a small number of experiments and as a result, yet many researchers consider as inaccessible [40]. Restricting IoT with this point of view is contrary to the spirit of open systems at the heart of the original Internet standards. Moreover, within the technologies which have been applied to facilitate IoT, open Web technologies including HTML, Ajax, HTTPS, OpenID and structured data apply equally well to IoT. However, yet there is no advanced mechanism to be able to effectively search and retrieve things from the Web.
The very diverse range of the objects, approaches and technologies used to implement IoT have contributed in broadening the definition of this paradigm. For instance, the IoT can be realized through deploying an RFID ecosystem consisting of objects tagged with numerous RFID labels [41]. Another option is to build the IoT using smart objects [17] which in turn can be divided into activity-aware, policy-aware and process-aware smart objects.
Currently WoT search is a trending research direction [42] with stress over some major goals such as real-time search [23], context-awareness [25] and relationship support [22].
Researchers have complained about the lack of real-world things data in the past [44]. Although some of the previous works have claimed testing their proposed solutions for large scale things data, such as meta-heuristic [9] or context aware sensor search [25], all these previous works mainly deal with small or simulated datasets. To the best of our knowledge, no work has ever collected or analyzed large scale things data. In addition, none of the existing works use real WoT search query dataset. Moreover, we could not find any other work that has deployed or analyzed a large real-world IoT query dataset for mining user interests in the IoT domain. By combining the user interests and the things data, we can analyze the gap of what people look for and what currently the WoT presents.
To illustrate the future of search engines, [7] identified some of the challenging issues for searching within IoT as search locality and real-time search. Furthermore, based on IoT characteristics such as networked interconnection, real-time, semantic coherence and spontaneous interaction will result in raising issues such as architectural design, search locality, scalability and real-time for designing and implementing WoT search engines [13]. However, due to the existing differences in the nature of Web of Things (WoT) with the IoT, WoT may even strike additional different challenges.
In order to design the next generation of search engines, many components of current search engines from data collection methods to user experience and semantics should be redesigned. In this section, some of the previous initiations in this area are categorized and reviewed. MAX [47], Microsearch [34] and Snoogle [39] are developed based on this idea. In keyword search approach, keywords are extracted from a given term and top query results are ranked based on a score derived from the percentage of similarity between the given query term and the keyword-based description on sensors. The result is a list of sensors and thus, it might not be very useful particularly for human users.
In the following, we also address the works that are related to flight delay analysis. Flight delay is not a new problem, and it has been considered by many researchers. In [27] the authors analyzed the time factor influence of the flight delay in twenty airports in the US. They observed the changes of the delay rate using historical data. Their investigation aim was to predict the delay of each period based on their mode. They used ANOVA and k-means clustering model in order to demonstrate the periodic of the delay rate. After that they applied the Fast Furious Transform to find the period of the delay. Although their model was able to predict accurately for the first airport they were studying, they found out that their model should be improved in order to be applied to the other 19 airports. However, they did not consider the airline influence.
Liu and Yang studied in [18] the flight delay propagation in the flight chain. So they proposed a new algorithm that could estimate the delay from the beginning in order to determine how much time the flights in chain could be delayed. Authors of [18] did not focus on the potential causes of the delay. They only modelled the problem utilizing the Bayesian Network.
Liu and Ma (2009) [20] analyzed how flight delay is influenced by delay propagation using Bayesian Network. First, they investigated the correlation between the departure delay and the arrival delay at a particular airport. They found that the majority of delays happens in the period between 8 am and 9 pm. They measured the delays as light, medium, or heavy. They proposed that cancelling flights when there is a heavy delay in the chin will relief the problem. Even though cancelling the flights will definitely help other subsequent flights in the chain to be on-time, other factors that may cause the flight delay should be taken in account.
In the study in [37], authors studied the major factors that contribute to flight delay. They developed a model to predict the flight delay using historical records of Denver International Airport. Basically, their model considers two types of delays. First is daily propagation patterns that might be caused by crew connection problems, propagated delay from previous flights, or other factors. Second is seasonal trend where weather or seasonal demand have impact on it. However, as in [27] predicting the status of the flight in the future would require additional dynamic resources that could enrich the model.
In [19] the authors looked at how the arrival delay could be propagated and impact the other subsequent flights in the stream. They believe all these types of delay only happen in busy hub-airports. They created three models. First, they had a propagation model after they investigated the relationships among flights. After that, they came up with an arrival delay model using Bayesian Network. Then they discussed the propagation delay in the hub-airport. They claim that the arrival delay is the source that mainly cause the departure delay.
Geng in his paper [10] provided statistical analysis of the flight delay. He listed all potential factors that may cause the flight delay. Some of these factors are airports, airlines, passengers, public safety, weather, fuel, departure control system, and air force. All these factors are actually play a role on the flight delay. Then he discussed some countermeasures in order to deal with the flight delay.
Another study [32] focused on study the flight delay problem based on the random flight point delays. They used series analysis on airline data and presented an influence factor model of the random flight points. The basic idea of this model is to combine the Bayesian Network with the Gaussian Matrix Model using expectation maximization algorithm. This model can predict the delay of the downstream.
As the best of our knowledge, there is no study has considered the real-time data to investigate the flight delay. In [27] the authors recommend for the future work to combine the analysis of historical data with real time data. That would predict the on-time performance of any airport. Our work will consider the real time data to predict the performance of individual flights.
Rebollo and Balakrishnan [31] presented a new model to predict the flight delay. They consider the temporal and the spatial delay states as explanatory variables. Their approach is to predict the delay sometime in the future between 2 to 24 hours. They use the Random Forest algorithm to do so. Although this model predicts the flight status in the future, the aforementioned interval seems too short because people require time more than that when they book their flights.
2.10 Conclusion
In this chapter, we overview the analytical architecture of a search and crawler engine framework, namely ThingSeek, which enables us to crawl, process and search things data that is disseminated by technologies such as WoT. Technically, our framework is capable of supporting other technologies in addition to WoT but we are interested in the cases that implement WoT. We discuss how the data sources can be selected. Moreover, we discuss the technical approach in collecting and integrating the data.
However, using the ThingSeek crawler, we also provide a statistical overview of things data. We provide a user interface that can be used by two different types of users including human users and smart machines. Furthermore, we use this architecture to address the needs of users in domain specific applications such as flight delay analysis. We provide an analytical discussion for the possible future directions in this area and the challenges that need to be tackled in related research.