7
WSN‐ and IoT‐Based Smart Surveillance Systems for Patients with Closed‐Loop Alarm
Amit Sundas1, Sumit Badotra2, Shalli Rani3, and Chhabildas Madhukar Gajare1
1 School of Engineering, Ajeenkya DY Patil University, Pune, India
2 School of Computer Science & Engineering, Faculty of Engineering & Technology, Jain University, Karnataka, India
3 Chitkara University Institute of Engineering and Technology, Chitkara University, Punjab, India
7.1 Introduction
IoT is an extremely large network; it contains and consists of each electronic device such as mobile phones and home phones, connected home appliances, connected vehicles, and many more smart electronic objects. IoT has emerged as one of the most important technologies of the 21st century. IoT is now being used in every research area, security system, health science, or manufacturing of any objects or devices[1]. In short, we can say that IoT has made our daily life more reliable and easier. The most important features of IoT include receiving, storing, sending, and accessing different sensor data in real time from anywhere. The sensors are basically used to collect the information, such as time, temperature, humidity, body mass index (BMI), acceleration, and many more depending on the different kinds of sensors [2]. The sensor receives and stores information in real time and then sends that information to the cloud by using any kind of Wi‐Fi module such as D1 mini NodeMCU, ESP8266 NodeMCU, or Bluetooth modules HC‐05, with the help of a microprocessor or microcontroller.
7.1.1 Working of IoT
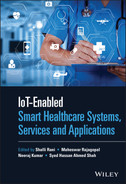
The working of the entire IoT process depends on its devices, such as smart watches, smartphones, Internet‐connected washing machines, Internet‐connected TVs, and many other electronic appliances; all these devices help each other to communicate with the IoT platform, which is shown in Figure 7.1 [3]. Further, the working of the entire IoT system depends on the following four fundamental components:
- Devices or sensors: In IoT, devices or sensors are the main components, which help us to collect data in real time from various environments. Data complexity depend upon their nature, whether it is an audio/video feed or a simple humidity‐monitoring sensor. Many sensors consist of a single device, but they can perform multiple jobs. For example, a computer is a device consisting of multiple sensors in it, such as a camera, touchpad, and GPS, but it cannot sense these things [4].
- Connectivity: All the data collected from various devices or sensors is sent to a cloud platform. Further, to send the data to the cloud, the device needs to be connected through a communications medium. The mediums could be Wi‐Fi, satellite, or mobile networks, WAN, Bluetooth, or Infrared [2–3].
- Data or information processing: Once the data is collected from the sensor, it is sent to the cloud, and then software performs the processing of the data. This whole process checking from taking humidity, temperature readings from the devices like heaters or AC. Even so, sometimes it can get complex, such as identifying motion of objects on videos using computer vision [5].
- User interface: The data or information needs to be visible to the end user, for further operation. The data can be shown in terms of trigger alarms or by sending a text or email notification on their phones. In some cases, the user requires an IoT‐based system interface, which is continuously monitoring and active. For example, a doctor wants to monitor patients from a remote location. If she wants to access the vital signs information of the patients, she can fetch this data in her phone using an application or web‐based portal [4].
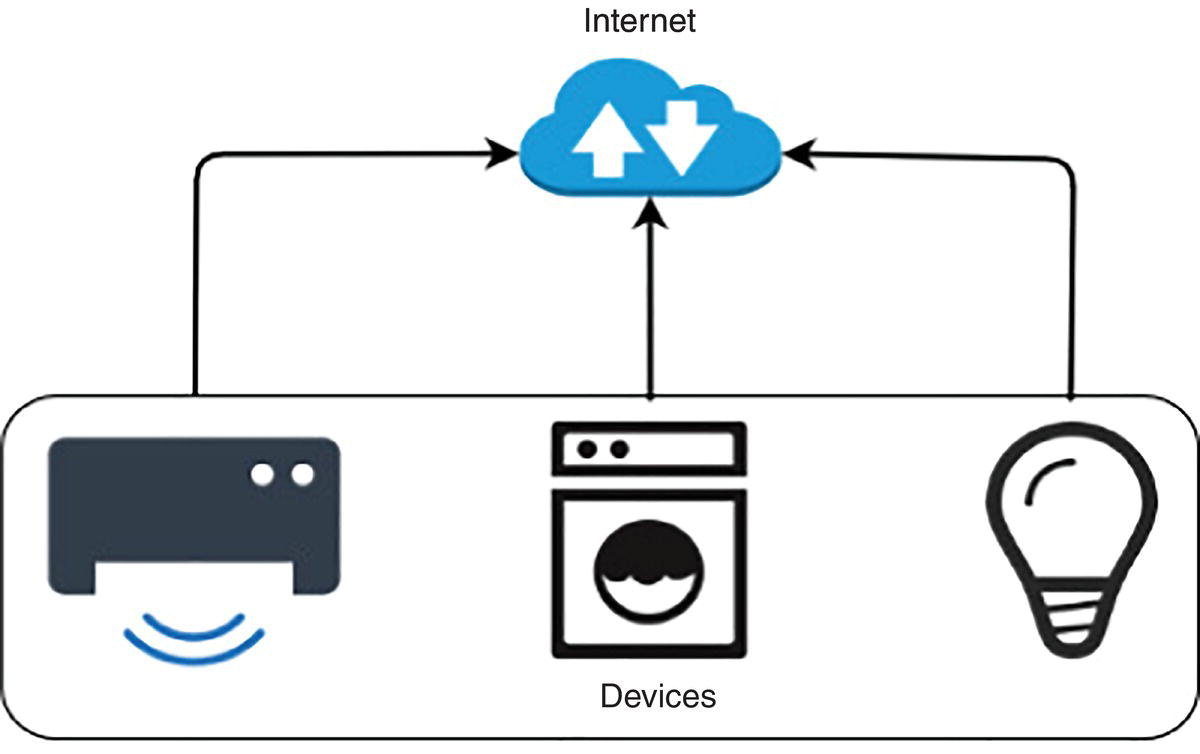
Figure 7.1 Working of IoT.
However, in some cases it can be two‐way communication; basically, it all depends on the IoT system or application we are using. In this case, the user performs a task or action in a similar way, so the system also wants to perform the action, which can create a cascading effect. Put another way, the user only gives instructions to the device or system to perform that instruction. The device receives the commands and performs the task and gives output according to the instruction.
However, in some cases, it may also be two‐way communication; basically, it depends on the IoT system or the application we use or want. In this case, the user does a task or action in the same way that the system also wants to do the action, which can create a cascading effect. Put another way, the user only gives instruction to the device or system to perform that instruction. The device receives the controls and performs their task and delivers the output as instructed.
7.1.2 Wireless Sensor Networks (WSNs)
As IoT surged as a prominent technology, the use of wireless sensor networks (WSNs) has grown rapidly. WSNs are webs of objects or devices that exchange data or information collected from the system field or a monitored ground via an over‐the‐air network [6]. The processed information is redirected via various nodes of the network, and with a gateway, the processed information or data is linked by each node to other networks such as a Wi‐Fi network, also known as Wireless Ethernet.
A WSN is a wireless, or Wi‐Fi‐based, network that comprises a root, or base station, where the data is collected and organized (center location), and several wireless sensors. WSNs are used to continuously monitor and record emotional and physical environmental conditions and then send the collected information to the base station [7]. They are used to measure conditions or variables such as sound or pressure and send the corresponding data to the base station, as shown in Figure 7.2.

Figure 7.2 Wireless sensor network.
7.1.2.1 Types of Different WSNs
Based on the surroundings, the different types of WSN networks needed are determined on the basis of where they are employed such as land, underwater, or underground. The various types of WSNs include [8]:
7.1.2.1.1 Terrestrial WSNs
This type of WSNs has the ability to communicate mean exchange or share with gateway productively. It essentially includes pre‐planned (structured) or ad hoc (unstructured) ways 100 to 1000 wireless sensor nodes. In a pre‐planned manner consider are organized in 2D, 3D, grid, and optimal placement patterns, and in Ad hoc, i.e. In an unstructured manner, the sensor is arranged randomly towards the target area, further in a fixed plane.
In this type of WSN, the battery capacity is very small or limited, and the batteries receive secondary power from solar cells. The consumption of low energy of these types of WSNs can be achieved further using reduce delays, optimal routing, low duty cycle, and so on [9].
7.1.2.1.2 Underground WSNs
To detect underground movement or conditions, several types of sensor nodes are hidden under the ground in this type of WSNs system. Further, to transfer the data to the base station via sensor nodes, additional nodes are added as sink nodes above the surface of the ground, as shown in Figure 7.3. The terrestrial types of WSN are cheaper than the alternative underground WSNs, as in underground WSNs deployment and maintenance are costly.

Figure 7.3 Underground WSNs.
In this, the batteries are difficult to recharge as they are underground; this is especially problematic for the sensors, which have limited battery power. It is a big challenge to maintain the network as there is a substantial signal loss and attenuation problems [8].
7.1.2.1.3 Underwater WSNs
As we all know, 70% of our earth is covered with water. In underwater WSNs, the sensor nodes and vehicles are employed underwater, to keep an eye on the underwater conditions, as shown in Figure 7.4. Autonomous vehicles help in gathering data or information from the sensor link nodes and sending it to the base station. Underwater communication is very challenging, which leads to risks such as bandwidth and long propagation delay and sometimes sensor failures too.

Figure 7.4 Underwater WSNs.
In these networks, a big disadvantage is that we cannot replace or recharge batteries easily. Further energy conservation issues in underwater WSNs involve the developments in networking techniques and underwater communication techniques.
7.1.2.1.4 Multimedia WSNs
In this type of WSNs, the monitoring and tracking of events are done in the form of multimedia, such as audio, imaging, and video, as shown in Figure 7.5. In these networks low‐rate cost sensors are employed, which are equipped with cameras and microphones; this makes these networks cheap. Through a wireless connection, nodes can communicate with each other for data compression, retrieval, and correlation. The challenge with these networks is that their energy consumption is very high, due to their high bandwidth, data processing, and compressing techniques. High bandwidth is used to deliver content easily and efficiently [9].
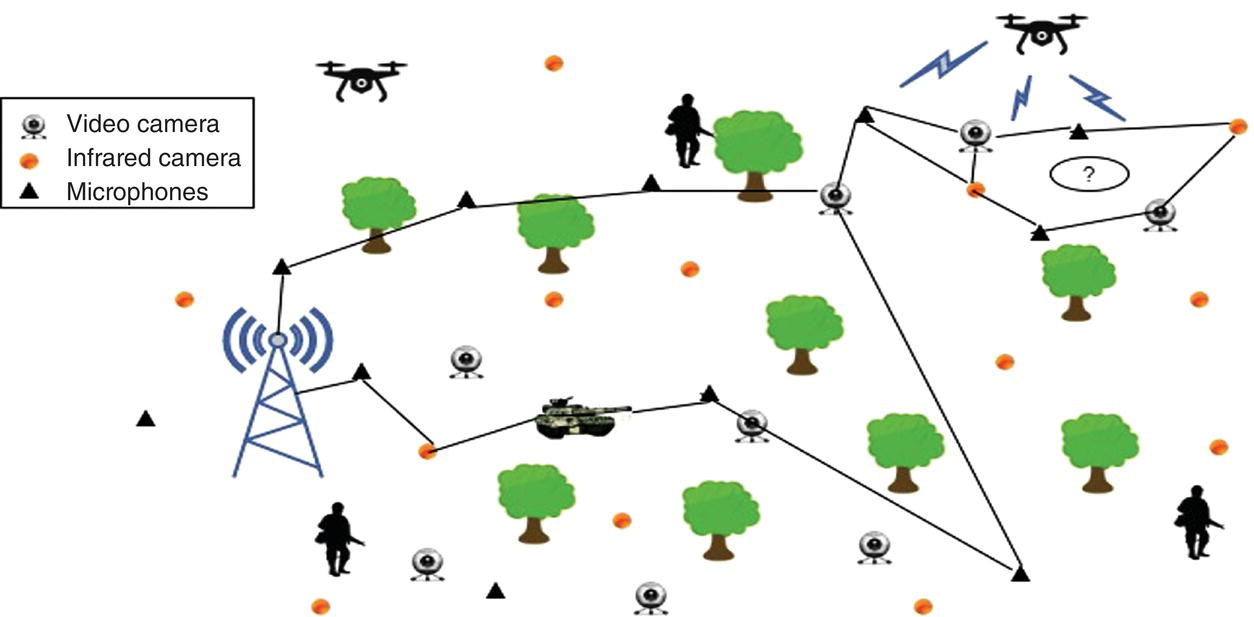
Figure 7.5 Multimedia WSNs.
7.1.2.1.5 Mobile WSNs
As the word “mobile” means moveable, in mobile WSNs (MWSNs) the sensors can move autonomously to interact with the different physical environments. Further, these networks have the capability to communicate and compute independently.
As compared to a fixed wireless network, mobile wireless networks are more versatile. The advantage of MWSNs as compared to static or fixed networks is that their coverage is better, they have superior channel capacity, and they have better energy efficiency, among others [7].
7.1.2.2 Constraints of Wireless Sensor Networks
- Very limited storage capacity (up to 100 KB)
- Modest processing power (up to 8 MHz)
- Consumes more power in communication over a short range
- Requires minimum energy with constrain in the protocol
- Short battery life
- Inactive devices deliver minute energy
7.1.2.3 Applications of Wireless Sensor Networks
Applications of WSNs include the following, which are shown in Figure 7.6.
- WSNs are used for environment monitoring and tracking, such as tracking of animals, forest detection, weather forecasting, and flood detection. Further, they are also used as commercial applications for prediction, monitoring, and detection of seismic activities [10].
- Military‐based application of WSNs include environment monitoring, temperature, humidity, and tracking of objects, which act as a surveillance system. The user can remotely control the sensor links using a sensor‐based network, which is dropped to a field of investigation; from this network, the enemy can be easily tracked, and any movement of the object can be detected [11].
- Health‐based applications of these networks are tracking and monitoring of patients; these networks are used by doctors [10–12].
- The most recurrent use of WSN‐based applications is in the field of transport or vehicle systems, which include parking monitoring, traffic monitoring, and dynamic routing management. [10].
- The other varieties of this network include industrial process monitoring, rapid emergency response, ecosystem and habitat monitoring, automated building climate control, civil infrastructure structural health monitoring. [11–12].

Figure 7.6 Applications of wireless sensor networks.
7.1.3 WSNs as a Subset of IoT
IoT is at a higher stage of development than WSNs; sometimes, WSN technology can also be used within an IoT system. As in a mesh network, a large number of sensors are employed to gather data individually and transfer this data to the Internet via the router in an IoT system.
The work should not consider the “wireless sensor or Wi‐Fi” as the “Internet of things.” Wireless networks include only the wireless sensor, but any network that includes the wired sensor is no longer known as a wireless sensor or Wi‐Fi network. It is unlike IoT. Any object or device connected to or related to the Internet is considered an IoT device. An IoT system is thus elucidated as a group of multiple IoT devices [13].
Examples
- A fridge having the capacity of sending temperature readings to the Internet should not be considered as a WSN, but it is an IoT device.
- A large collection of sensors used to monitor rain on an acre of land is likely to be considered a WSN, as all the sensors are wireless. This system may or may not be connected to an IoT system.
Today’s applications based on network computing are faced with a huge demand for powerful functionalities networks. The reach of the functional network is central to customer satisfaction both in cloud computing and mobile network environments. WSN is a wireless or Wi‐Fi network containing objects or stand‐alone spatial diffusion devices using sensors for careful physical monitoring or environmental conditions, such as sound, humidity, temperature, pressure, vibration, motion or pollutants, at various different area or locations.
A WSN is a collection of sensing devices that can communicate wirelessly. By this generation of technology, sensing elements have become the most important object. Sensors are small and perfect for the features of sensing motion, pressure, and human touch and even the atmospheric temperature. The small size and light weight are the best advantages of sensors that help to design a device. The fetched data of sensors are processed with the help of open‐source license platform Arduino IDE (integrated development environment). Arduino IDE is open‐source license computer software. ThingSpeak is a cloud‐based platform used to store the sensor data in the cloud and is also an open‐source license platform.
7.1.4 Motivation and Organization of the Chapter
Our motivation is the lack of sufficient research in the area of smart surveillance systems for patients with closed‐loop alarm in the field of WSNs. This motivation helps us to implement experimentation based on IoT‐ and WSNs‐based smart surveillance systems for patients with closed‐loop alarm.
Implementing real‐time data recovery from various wireless sensors and storing this data on a cloud‐based platform called ThingSpeak. Various sensors are used to measure pulse, acceleration, SpO2 (oxygen saturation), and temperature for this experiment. The purpose of using the pulse sensor is to detect the heart rate. Acceleration sensors are used to detect movement or acceleration of the individual. SpO2 sensors are used to measure the amount of oxygen present in the blood, or simply the percentage of hemoglobin containing oxygen. The temperature sensor is used to detect the body temperature. Before sending any data to the cloud, first the data need to be fetched from the sensors in real time. In our experiment, the output of fetched data in real time were stored in the cloud and shown in the Android application in a closed loop. The experimental results are explained briefly in the next section.
This chapter is divided into five sections. Section 7.1 illustrates the introduction of the IoT and WSNs with its applications and working principles. Section 7.2 constitutes the literature review related to different phases and techniques of health‐monitoring systems (HMSs) and their relation to IoT and WSNs for choosing the correct vital sign sensors for patients’ HMSs. Section 7.3 describes the proposed research of WSNs and IoT‐based smart surveillance systems for patients with closed‐loop alarms; it also describes the research methodology. Section 7.4 provides an evaluation of the proposed methodology; it discusses the entire experimental environments. Further, the results and outcomes of patient‐monitoring smart surveillance systems are clearly shown graphically and diagrammatically. Section 7.5 includes the conclusion and future scope in the results in terms of a patient‐monitoring smart surveillance system based on WSNs and IoT devices.
7.2 Literature Review
The literature studied for this chapter mainly focused on the application of IoT and WSNs based on patient‐monitoring systems; the literature concludes that these technologies improve real‐time monitoring systems for the patient in removed locations. In the literature review, the authors have discussed all the modern as well as old techniques applied in the field of IoT and WSNs for monitoring from 2012 to 2020.
7.2.1 Literature Review: Toward the Application of IoT and WSNs
Mitra et al. [14] discuss a system that is based on the KNOWME platform for real‐time health monitoring. KNOWME is further integrated with the N95 Nokia phone. The main purpose of the paper was to evaluate and monitor four major challenges. These four challenges are as follows: (i) achieving strength in the subject‐induced changeability in terms of sensor placement or mobility for the environment operates, (ii) minimizing the consumption of network energy and balancing the strain while acquiring top fidelity information, (iii) using modest sensors enabling precise physical movement detection, and (iv) at last designing WBANs to resolve the physiological quantity of the concentration similar to energy expenditures.
Patel et al. [15] review the technology based on wireless systems and sensors in the field of treatment. The study is focused on wearable sensors systems and their various applications such as disorders detection at an early age, safety, wellness and health, assessment of treatment efficacy, and home treatment. The authors have also described the monitoring of adults of older age groups with unrelieved conditions in terms of ambient and wearable sensors.
Kothari et al. [16] review the developments in the field of WSNs, its applications, and design constraints, which also include a lifetime evaluation model. The model is based on a multi‐parameter monitoring system in real time, with the help of LabView graphical programming language and a microcontroller such as ZigBee. Distance and temperature are the two‐parameter analog information gained by the system; with the help of ZigBee the information is transmitted to the other end, i.e., the receiver side.
Hackmann et al. [17] discuss the deterioration of civil infrastructure, the need for structural health monitoring, and the critical challenge of localization and detection of damage. Further, the discussion results in two conclusions: (i) there is a trade‐off between resolution and various sensors in terms of localization damage process based on elasticity, and (ii) based on energy efficiency based on elasticity, multi‐level planned calculation structural design. The authors also perform a simulation to explain the complete structure that displays the effectiveness of the system in damage localization and energy‐effectiveness as well as truss structure.
Misra et al. [18] present a theoretical model of the cloud‐sensor platform and a mathematical formulation cloud‐based sensor according to their virtualization characteristics. The researchers mainly focus on the challenges and ideology of WSN applications and their behavior in terms of a cloud‐sensor platform. At last, in the results, the authors confirm the lifecycle of the sensors, which increase by 3.25%, energy consumption decreases by 36.68%.
Simoes and de Souza [19] discuss a communication technique known as data acquisition system (DAS) in place of north 52° SOS execution of OGC SWE specification. Further, this enables interoperability and interaction of web sensors. At last, the authors come with the result of a low‐cost programmed DAS system for town sites humidity and a temperature‐monitoring system build in IoT. For the future, the authors also provide a complete infrastructure for visualizing information in the concrete background of Big Data and derived from IoT.
Zakaria and Michael [20] present a prototype to monitor pH, the dissolved parameter of oxygen, and conductivity from water waste, which is discharged into water sources, with the help of a cloud‐based integrated WSNs environment. It uses the capability of IoT, which provides the system the ability to online monitor it in real time and upload the sensor data or information in the cloud‐based platform, named ThingSpeak. The authors use the GPRS service to transfer the data into the cloud with the help of AT commands in combination with the HTTP GET protocol. The prototype used a Telerivet SMS gateway to report experiential or acknowledged water pollution using alert notification by SMS.
Xie et al. [21] propose a routing implementation of efficient energy that introduces mobility of the objects with WSNs for collection information of mobile data. The term used for sensing moveable sensors is mobile data collectors (MDCs). MDCs start the movement of data from its initial place‐based station and transfer the data periodically to all the stations and finally return to the base station again. This whole movement of data from one station to another is decided using the Floyd‐Warshall complete graph algorithm.
Chandra et al. [22] discuss data‐driven techniques that help improve yields in agriculture. Moreover, this technology has a high rate of manual information gathering in bare implementation and gives a limited connectivity result. The authors present an uninterrupted IoT platform known as FarmBeats for agriculture solutions to collect data from various drones, cameras, and sensors. FareBeats is a method that helps in monitoring cabs through the Internet and has been implemented six months ago in two US farms.
Miqdad et al. [23] developed a real‐time low‐cost WSNs monitoring system for sensing building space. The monitoring system collects data such as temperature, illumination, quality of air, and humidity. The collection of data is taken from all corners of the building to balance the amount of energy and client comfort to accomplish the goal. In the experiment, the authors use the NodeMCU module with a DHT11 sensor for measuring humidity and temperature. 6 V power supply sources are used to supply power to the NodeMCU module.
AlSkaif et al. [24] compare environment monitoring of smart cities in four specific areas: smart building/house, smart animal and agriculture farming, and municipal resilience. The main aim of the research is to carry out a comparative analysis of the MAC protocol, the use of energy in low‐throughput MSN data networks (wireless multimedia sensor networks). In comparison, the analysis includes the multi‐class traffic model for analyzing the energy usage of the MAC protocol in low‐speed data.
Modieginyane et al. [25] review the challenges faced in applications for environmental monitoring by WSNs in addition to challenges faced by opportunities and approaches. The study elaborates on how an application released helps to resolve the opportunities and approaches related to WSNs with the help of SDN.
Sethi and Sahoo [26] propose an application based on a health‐monitoring system (HMS). The application is purely based on WSNs, which help to monitor the medical information or record in real time. The role of the application is to collect data from adult patients, ICU, and industrial uses. In the experiment the authors use ZigBee and Wi‐Fi to transfer the data to the application.
Kaur et al. [27] discuss the effective role of IoT in the field of healthcare devices. The IoT‐based devices provide patient health state and track their activities according to the current time and situation. Further, given a viewpoint in the field of electronics and technology, which is fussing together into the Internet of healthcare Things (IoHT). Finally, the authors aim to provide benefits of IoHT in the medical sector.
7.3 Proposed Work: WSN and IoT‐Based Smart Surveillance System for Patients with Closed‐Loop Alarm
Numerous studies have been conducted on HMS but not much has been published on closed‐loop real‐time patients’ HMS. This study will propose and focus on an enhanced monitoring system for patients based on IoT and WSNs with closed‐loop alarm. This implementation of a closed‐loop patient‐monitoring system was done using four vital sign sensors (SpO2 sensor, accelerometer, thermometer, and pulse sensor), as shown in Figure 7.7. The closed‐loop patient‐monitoring system consists of three different phases. The first phase is to connect the entire vital sensor together in a device to measure different parameters. The temperature sensor is used to measure the body temperature in degrees Celsius as well as Fahrenheit. SpO2 (oxygen saturation) is used to measure the amount of oxygen present in hemoglobin in the blood of the person’s body in percentage units. The accelerometer sensor is used to measure the acceleration of the body and to determine the state that the body is in. At last, a pulse sensor is used in the experiment to measure the heart rate of the person in beats per minute (BPM).

Figure 7.7 Sensors used in experiments.
The second phase is to send the sensors data into the cloud platform. The cloud platform used in the experiment is ThingSpeak. The reason for choosing the ThingSpeak web‐based cloud is that it is open source for used till four channels and is provided by MathWorks, the company that makes MATLAB. In ThingSpeak, data can easily be transferred using an application programming interface (API) key and channels ID. Finally, the final phase of the experiment is to create an Android‐based application, which uses the ParseInt method to collect the sensors data from the cloud into an Android application in real time. Figure 7.8 shows the proposed architecture model.

Figure 7.8 The proposed model architecture.
7.3.1 Methodology
There are basically four phases that will be used to complete the research objectives.
The first phase is identifying all wireless sensors used in vital signs according to their efficiency of giving constant results, cost, reliability, and power consumption. Choosing each sensor was done using various experiments. After the selection process, the data of the sensors first view in the serial monitor of the Arduino IDE. Then the data are sent to the ThingSpeak cloud platform.
The second phase is to interface all the sensors together in a compact device. This device basically consists of one D1 WeMos mini microcontroller, also known as Mini NodeMCU, along with four vital sign sensors.
The third phase is to fetch all the sensor data from the ThingSpeak cloud platform to an Android application in a closed loop. The closed‐loop alarm is a process in which two thresholds are set (upper and lower), and if the actual value is in between them, that means it’s in normal condition; otherwise it will activate an alert. The application used the parseInt method to fetch the JSON format data from the cloud.
The fourth and final phase is to implement and test the device in real time by attaching the four sensors together in the body of a person, to check the accuracy, efficiency, and reliability of the device in different conditions.
Altogether the above phases are now shown and explained in Figure 7.9 using a flowchart.

Figure 7.9 Methodology flowchart.
The steps of Figure 7.9 start with the related survey in the field of WSNs and IoT. In the survey, the authors explore existing WSNs and IoT‐based VST (vital sign transmission) concerning cloud having a closed‐loop application. In the conclusion, the authors identified the four sensors needed in VST for patient‐monitoring systems; these are an SpO2 sensor, accelerometer, temperature sensor, and pulse sensor. The sensors are attached to a device in a compact form; all the sensors are connected to a D1‐mini NodeMCU microcontroller. The controller has an built‐in Wi‐Fi module; the module helps to transfer the data of the sensor to the cloud using the Arduino IDE. The ThingSpeak a web‐based cloud platform is used to store the data of the sensors. The data is further sent to an Android‐based application using the parseInt method; the application also consists of a closed‐loop alert system. Closed loop is set based on the thresholds for both upper and lower bounds so that if the value is below or above the min or max thresholds, respectively, it will give an alert. Different threshold values are set according to the sensor so that each sensor has its own thresholds. The alert can be viewed as color‐changing effects in a text box, where sensor data, if seen in the application, is displayed in the results and discussion section of the following chapter. The data is on JSON format when it is stored in the ThingSpeak cloud platform. Using the API key and channel ID of the ThingSpeak server of an individual, the data is shared in a link, as shown in Figures 7.10–7.12. Further, the link is used in the Android application to fetch the data from the cloud.
Figure 7.10 Channel details.

Figure 7.11 Raw data.

Figure 7.12 Link to read a channel feed [28].
The ParseInt method is used to extract the value of each JSON format data of each sensor. This data can be viewed anywhere using the application; it will help the doctor to view the details of the patients in real time from anywhere. The doctor can take necessary action before the patient reaches the medical.
The testing of the devices is done based on their compatibility, usability, security, reliability and scalability, performance, and data integrity. Let’s explore each testing type one by one.
- Usability of the Device
The user interface of the application is checked, considering one too many users, according to their comfort to read the data and the ease to access the application.
- Compatibility Testing
As the system is composed of hardware as well as software, the configuration of both together is tested so that it can give an accurate result. Compatibility is one of the most important parts of an IoT‐based device.
- Scalability and Reliability Testing
Scalability and reliability of the sensor are tested continuously running the devices for a long time. Basically, in this test the breaking point of the sensor is found out so that when it runs in real time it won’t face any problem.
- The Integrity of Data Testing
In IoT device testing, it is very important to test the integrity of the data, as a large amount of data is involved in the application, continuously checking whether the data measured by the sensor is the same or not.
- Security Testing of the Device
Security in terms of accessing the application of the device, security should be provided so that only the authenticated user can see the data or access the application. Providing validation to the user can solve this kind of issue.
- Performance Testing
Testing should be performed in each step of the IoT‐based device to make sure that it is running correctly and giving accurate result in each phase.
7.4 Implementation and Evaluation of the WSN and IoT‐Based Smart Surveillance System for Patients with Closed‐Loop Alarm
7.4.1 Experimental Environment
An experimental environment plays a very important part in performing the experiment. Each experiment depends entirely on the subject of the experiment, since it is the primary source of all the results. This experience involves a number of components such as sensors, Wi‐Fi modules, Arduino IDE; cloud‐based open‐source platform. A brief description of all requirements can be found below.
7.4.1.1 Wi‐Fi Module
Among many Wi‐Fi modules, WeMos D1 mini – Mini NodeMCU is used for this experiment. As shown in Figure 7.13, D1 mini NodeMCU is small and functional, but here the purpose of using this module is sending sensor data to the cloud. One of the great features of the Wi‐Fi module is its wireless Internet connection. D1 mini NodeMCU is an IoT‐based ready‐made open‐source platform. The power supply required to run this controller is 5 V or 3.3 V.

Figure 7.13 WeMos D1 mini – Mini NodeMcu [29].
7.4.1.2 Sensors
This experiment includes various sensors to measure variables such as SpO2, pulse, temperature, and acceleration.
The temperature sensor model number MAX6675 is used to measure the body temperature in degrees Celsius and as well as Fahrenheit. SpO2 (oxygen saturation) module number MAX30102 is used to measure the amount of oxygen present in hemoglobin in the blood, as previously explained. An accelerometer is used to detect the acceleration in all three axes, i.e., the x‐, y‐, and z‐axis. At last, a pulse sensor is used in the experiment to measure the heart rate of the person.
7.4.1.3 Arduino IDE
This software is open‐source, user‐friendly, and free. All real‐time data of various sensors are fetched in Arduino IDE using computer programming, as shown in Figure 7.14

Figure 7.14 Ardunio IDE software [30].
7.4.1.4 ThingSpeak
This is a cloud‐based, open‐source platform. It is shown in Figure 7.15. In this platform, real‐time data of any objects can be sent and stored as a representation of a graph. Sending and storing data on this platform requires any Wi‐Fi or Bluetooth modules. According to the requirement, D1 mini WeMos NodeMCU was chosen as a Wi‐Fi module to implement this experiment.

Figure 7.15 ThingSpeak IoT platform [31].
7.4.2 Results and Discussion
This implementation was done using four sensors (SpO2, acceleration, temperature, and pulse) in two different steps. The first step was to perform individual connectivity of all sensors one by one with their individual outputs. The second step was to make one connection with all four sensors to get one output with different sensors in the cloud. The real‐time data was fetched by WeMos D1 mini and stored in ThingSpeak. The authors studied all the resources and technology before starting the implementation. Figure 7.16 shows the architecture of all the components and how the connection is made. All the steps of this experiment are explained with their results.

Figure 7.16 Connection architecture of all the components.
7.4.2.1 SpO2
The experiment began with SpO2 and followed by the three other variables, i.e., pulse, temperature, and acceleration. The use of SpO2 is to measure the amount of oxygen present in the blood, or simply the percentage of hemoglobin contains oxygen.
The SpO2 data is fetched in real time, and then the output is shown in the Arduino IDE. Figures 7.17 and 7.18 show the connection of the SpO2 sensor with the WeMos D1 mini‐module and the output in the Arduino IDE, respectively.
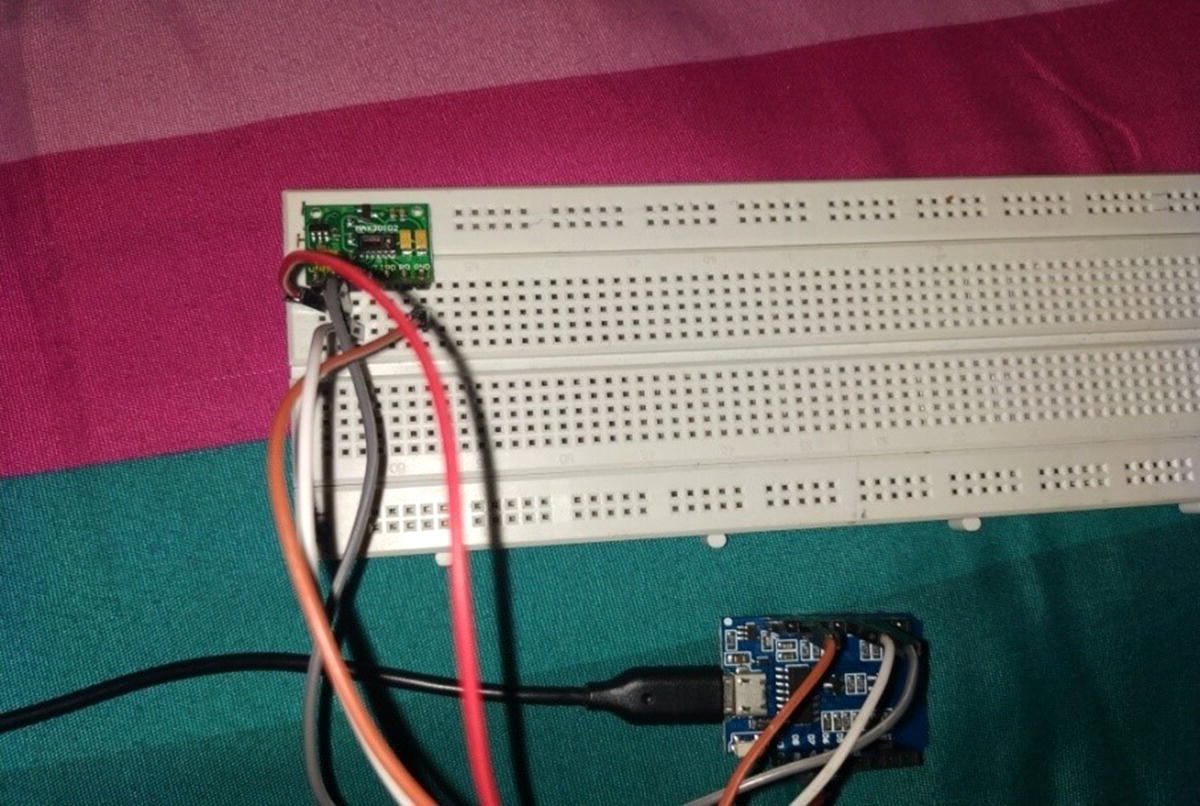
Figure 7.17 MAX30102 pulse oximeter/heart‐rate sensor.
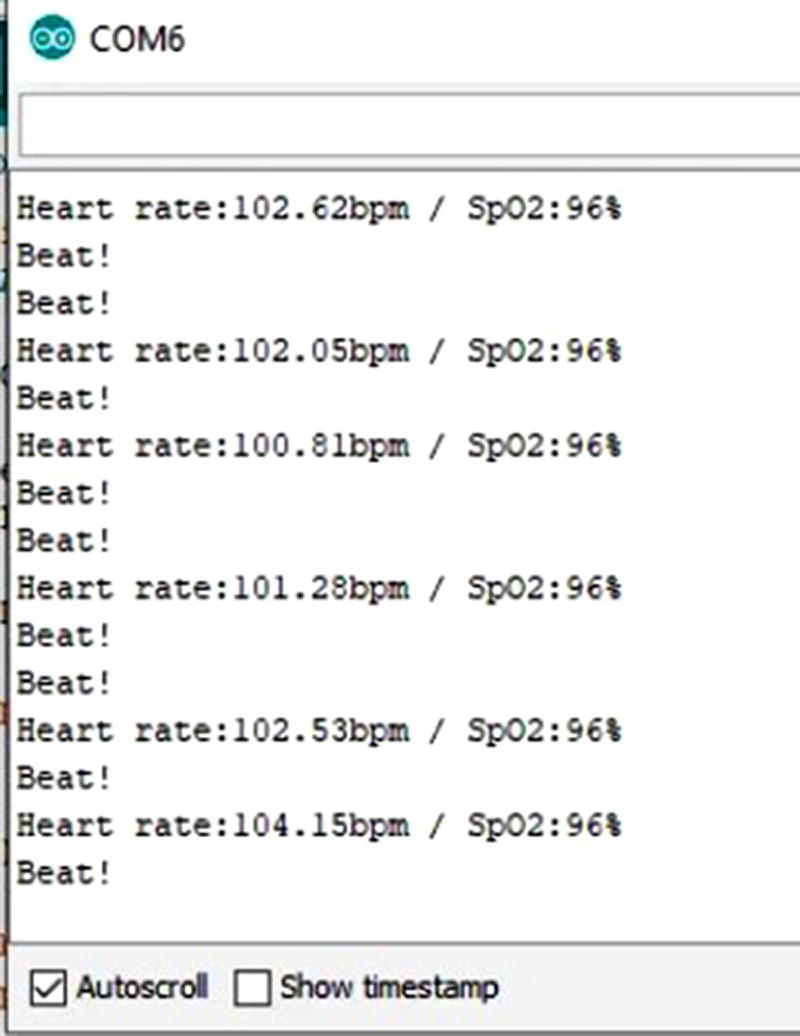
Figure 7.18 MAX30102 pulse oximeter sensor data in Arduino IDE.
7.4.2.2 Pulse
A heart‐rate sensor, or pulse sensor, is used to sense the BPM of the person. The real‐time BPM data was fetched by connecting the pulse sensor with the WeMos D1 mini‐module. Figures 7.19 and 7.20 show how the pulse sensor was connected with the Wi‐Fi module and the fetched data as output in the Arduino IDE, respectively.
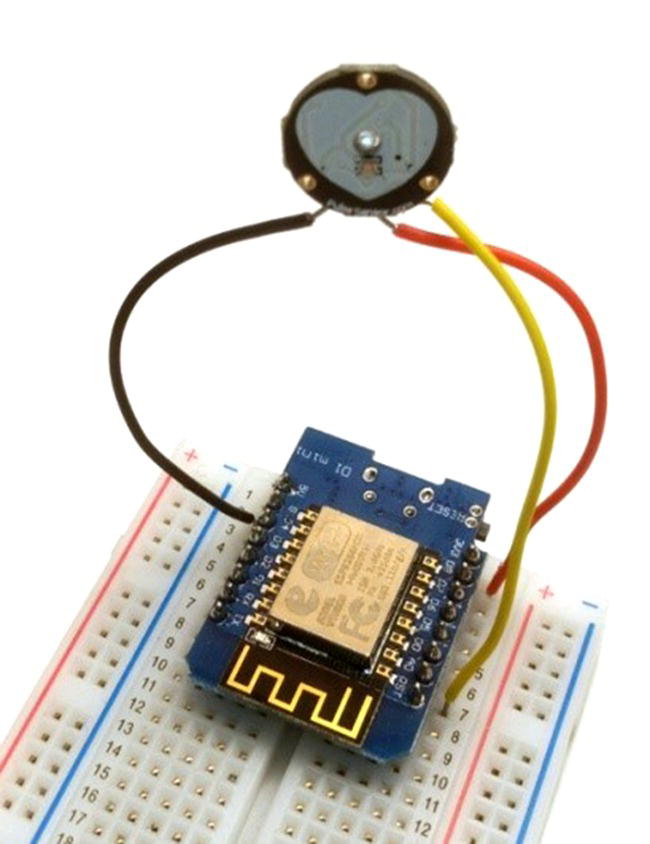
Figure 7.19 Pulse sensor.

Figure 7.20 Pulse sensor data in Arduino IDE.
7.4.2.3 Acceleration
To get acceleration data, the authors used an accelerometer. This sensor can fetch the acceleration data in all three axes, i.e., the x‐, y‐, and z‐axis. Figures 7.21 and 7.22 show the connection of the accelerometer with the Wi‐Fi module and the output in the Arduino IDE, respectively.

Figure 7.21 Accelerometer sensor.
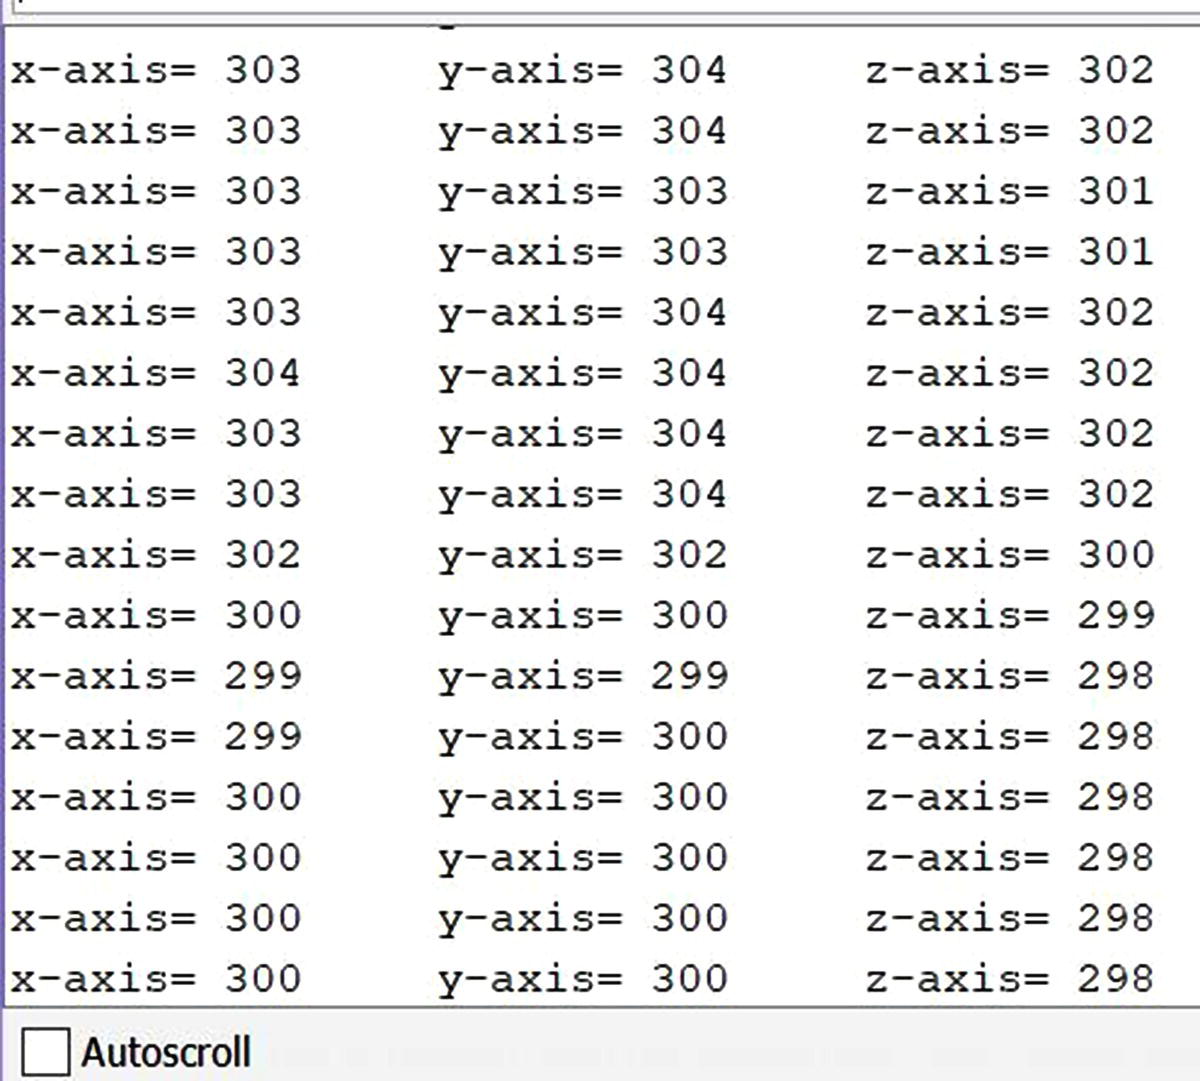
Figure 7.22 Accelerometer data in Arduino IDE.
7.4.2.4 Temperature
The authors used the MAX6675 temperature sensor. MAX6675 was found suitable for implementing this experiment to sensing the temperature because it is small in size and gives accurate results. The real‐time temperature data was fetched by connecting the MAX6675 sensor with the WeMos D1 mini‐module. Figures 7.23 and 7.24 show how MAX6675 was connected with the Wi‐Fi module and the fetched data as output in the Arduino IDE, respectively.

Figure 7.23 MAX6675 sensor data in Arduino IDE.

Figure 7.24 MAX6675 sensor data in Arduino IDE.
7.4.2.5 Combined
After completing the first step, this part includes the process of fetching all four sensors’ data in one connection with the WeMos D1 mini‐module and showing their outputs in ThingSpeak. However, after getting the data from all four sensors, the main process is to send the data to the cloud. The WeMos D1 mini Wi‐Fi module was found suitable for this experiment because it is easy to work with. Figures 7.17–7.24 show the connection of all four sensors with the WeMos D1 mini‐module. Figures 7.24 and 7.25 show the result of the MAX30102 pulse oximeter sensor, which, as previously explained, was sent to the cloud using ThingSpeak represented as a graph. Figure 7.26 shows the output of the MAX6675 temperature sensor in the graph form. Figure 7.27 shows the output of the accelerometer, where (a), (b), and (c) represent the acceleration in the x‐, y‐, and z‐axis, respectively. At last, Figure 7.28 shows the result of pulse sensor data sent to the cloud using ThingSpeak in the form of a graph.

Figure 7.25 MAX30102 pulse oximeter sensor data in ThingSpeak.

Figure 7.26 Temperature sensor data in ThingSpeak.


Figure 7.27 (a) Data of accelerometer of x‐axis sent in ThingSpeak. (b) Data of accelerometer of y‐axis sent in ThingSpeak. (c) Data of accelerometer of z‐axis sent in ThingSpeak

Figure 7.28 Pulse sensor data in ThingSpeak.
ThingSpeak stores data represented as a graph. The user needs to create an account in ThingSpeak, and then ThingSpeak will provide the cloud services. Figures 7.28 are the final results of this execution, which were sent to the cloud. In the Arduino IDE different programming codes were used to get the results from each sensor by connecting with the WeMos D1 mini‐module. A wireless network mobile hotspot was used for Internet connection in this experiment.
Finally, at the last steps of the implementation, data was sent from the cloud to an Android application. Android applications are a very popular source of IoT software, which loads up mobile devices to operate and act as a middleware for interaction between users and the devices. In this experiment the Android application acts as middleware between a doctor who used the application for reading the patient’s data in real time from anywhere. Reading of the data from the cloud to the Android application is done using the parseInt method. In this method a JSON link is used to fetch the different data; further, this data is displayed in a textbox in the application. The application also has a closed‐loop alert system, which helps to notify the user of any major change in the reading of the data. For operating the application, the user needs to sign in, or if the user is not registered yet, they need to sing up as a new user, as shown in Figure 7.29.
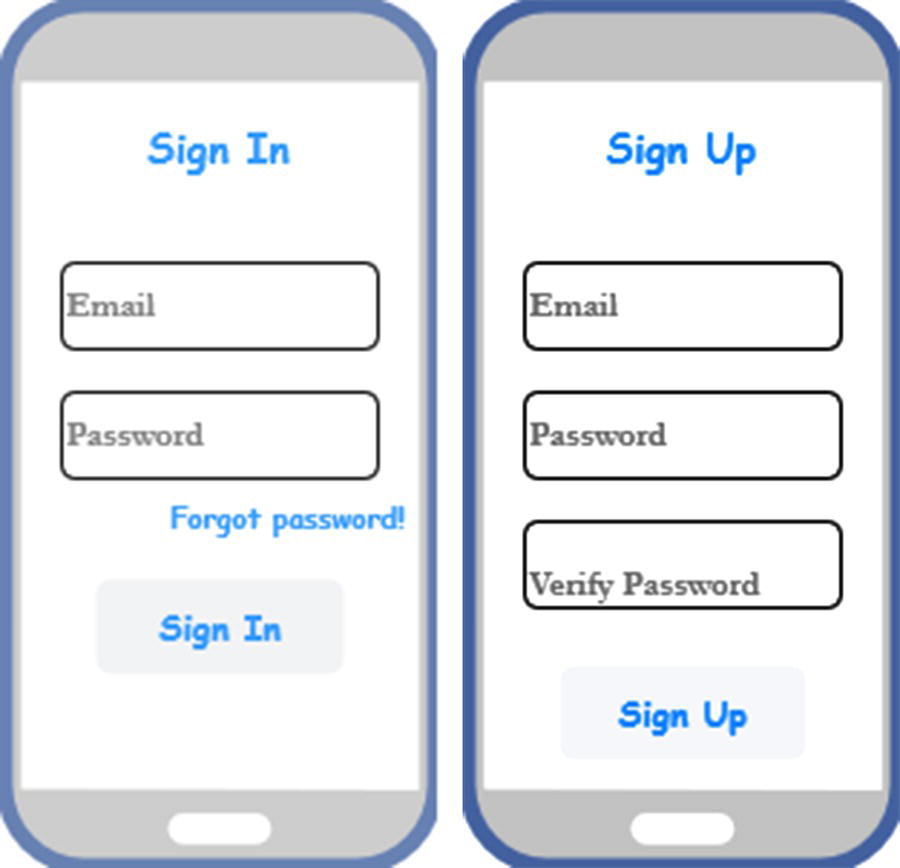
Figure 7.29 Sign‐In/‐Up interface.
After successfully logging in, the user will navigate to the patient’s data interface, where all sensors’ data is shown in each textbox, such as pulse, acceleration, SpO2, and temperature in degrees Celsius. Figure 7.30 shows the reading of a patient’s data in an Android application from the cloud.
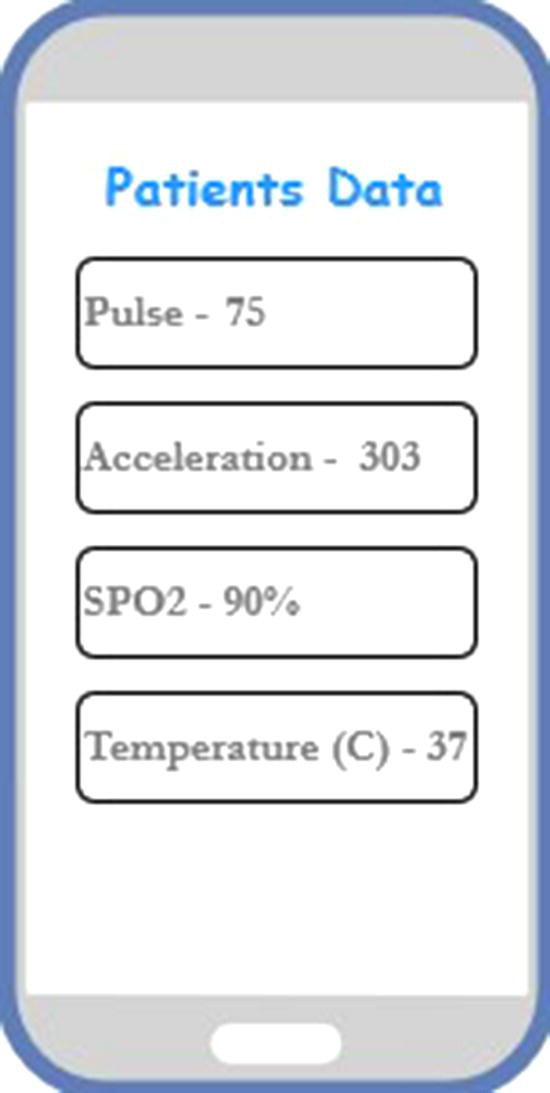
Figure 7.30 Patients data in Android application.
The alert notification is visible in the patient’s data interface with the help of color‐changing effects in the textbox for each particular text field, when the value of the variable is outside a predetermined range, as previously explained. Figure 7.31 shows the patient’s data with the alert notification.

Figure 7.31 Patients data with alert.
This whole technology can be used for any emergency, such as patients who are in transit mode, in ambulances. The doctor can easily start to monitor the patients before they reach the medical center. The device also can help to monitor older patients in their homes. The main use of the device is to monitor any patients or persons continually in real time from anywhere using the Android application and get vital information with closed‐loop alerts so that immediate action can be taken to save patients’ or others’ lives in critical situations.
7.5 Conclusion and Future Work
7.5.1 Conclusion
In today's scenario, as advanced technology in innovation evolves quickly and rapidly, problems continue as technology continues to increase. In this paper, the various advanced approaches based on the patient health surveillance system presented by different authors in recent years have been discussed and studied. We have achieved that most SNW and IoT‐based health surveillance systems for patients recognize the problem and problems associated with real‐time data or information transfer and analysis.
The inspiration for working with the IoT and WSNs is having smart surveillance of patients, with a closed‐loop alarm, plotting the real‐time data in graph form, storing, sending the data to the cloud, and fetching the data in an Android application for monitoring. After completing the experiment, the final results were stored in the ThingSpeak cloud represented as a graph, and the data was sent to the Android application having a closed‐loop. This technique was found easier and more reliable for sending real‐time data to the cloud with the help of ThingSpeak. With the help of the D1 WeMos mini Wi‐Fi module and the Arduino IDE, it was possible to send the real‐time data wirelessly, directly to the cloud via ThingSpeak,. Finally, we proposed a patient‐monitoring smart surveillance system based on WSNs and IoT, which can reliably analyze and efficiently monitor the collected data from the cloud in real‐time within an Android application with closed loop.
7.5.2 Future Work
Future work includes widespread connection of monitoring devices in one application, application of machine learning algorithms to the stored data that have been saved in the cloud to automatically detect the patient’s health, and connection of more vital sign sensors in the monitoring device to sense more parameters to help doctors.
References
- 1 Chen, H., Jia, X., and Li, H. (2011). A brief introduction to IoT gateway. In: IET International Conference on Communication Technology and Application (ICCTA 2011), 610–613. IET.
- 2 Kim, J.S. (2015). The introduction of IoT (internet of things) technologies and policy directions. Review of Korea Contents Association 13 (1): 18–24.
- 3 Gokhale, P., Bhat, O., and Bhat, S. (2018). Introduction to IOT. International Advanced Research Journal in Science, Engineering and Technology 5 (1): 41–44.
- 4 Sanchez, L., Muñoz, L., Galache, J.A. et al. (2014). SmartSantander: IoT experimentation over a smart city testbed. Computer Networks 61: 217–238.
- 5 Lee, M., Hwang, J., and Yoe, H. (2013). Agricultural production system based on IoT. In: 2013 IEEE 16Th International Conference on Computational Science and Engineering, 833–837. IEEE.
- 6 Lee, H., Lee, K., and Shin, Y. (2012). A GTS allocation scheme for emergency data transmission in cluster‐tree WSNs. In: 2012 14th International Conference on Advanced Communication Technology (ICACT), 675–678. IEEE.
- 7Singh, D.P., Bhateja, V., and Soni, S.K. (2013). An efficient cluster‐based routing protocol for WSNs using time series prediction‐based data reduction scheme. International Journal of Measurement Technologies and Instrumentation Engineering (IJMTIE) 3 (3): 18–34.
- 8 Xu, K., Wang, Q., Hassanein, H., and Takahara, G. (2005). Optimal wireless sensor networks (WSNs) deployment: minimum cost with lifetime constraint. In: WiMob'2005, IEEE International Conference on Wireless and Mobile Computing, Networking and Communications, vol. 3, 454–461. IEEE.
- 9 Luo, Z. (2012). Overview of applications of wireless sensor networks. International Journal of Innovative Technology and Exploring Engineering 1 (4): 4–6.
- 10 Zheng, L.I. and Shu‐guang, M.I.A.O. (2010). Application of WSNs in mine laneway monitoring system based on ZigBee [J]. Instrument Technique and Sensor. https://en.cnki.com.cn/Article_en/CJFDTotal‐YBJS201008020.htm.
- 11 Mpitziopoulos, A., Gavalas, D., Konstantopoulos, C., and Pantziou, G. (2009). A survey on jamming attacks and countermeasures in WSNs. IEEE Communication Surveys and Tutorials 11 (4): 42–56.
- 12 Bojanova, I. and Samba, A. (2011). Analysis of cloud computing delivery architecture models. In: 2011 IEEE Workshops of International Conference on Advanced Information Networking and Applications, 453–458. IEEE.
- 13 Chi, Q., Yan, H., Zhang, C. et al. (2014). A reconfigurable smart sensor interface for industrial WSN in IoT environment. IEEE Transactions on Industrial Informatics 10 (2): 1417–1425.
- 14 Mitra, U., Emken, B.A., Lee, S. et al. (2012). KNOWME: a case study in wireless body area sensor network design. IEEE Communications Magazine 50 (5): 116–125.
- 15 Patel, S., Park, H., Bonato, P. et al. (2012). A review of wearable sensors and systems with application in rehabilitation. Journal of Neuroengineering and Rehabilitation 9 (1): 21.
- 16 Kothari, D., Thakker, M., Shah, V.A., and Gohel, T. (2013). A real time wireless multi–parameter monitoring system with ZigBee and LabVIEW. International Journal of Current Engineering and Technology 3 (5): 1667–1671.
- 17 Hackmann, G., Guo, W., Yan, G. et al. (2013). Cyber‐physical codesign of distributed structural health monitoring with wireless sensor networks. IEEE Transactions on Parallel and Distributed Systems 25 (1): 63–72.
- 18 Misra, S., Chatterjee, S., and Obaidat, M.S. (2014). On theoretical modeling of sensor cloud: a paradigm shift from wireless sensor network. IEEE Systems Journal 11 (2): 1084–1093.
- 19 Simoes, N.A. and de Souza, G.B. (2016). A low cost automated data acquisition system for urban sites temperature and humidity monitoring based in internet of things. In: 2016 1st International Symposium on Instrumentation Systems, Circuits and Transducers (INSCIT), 107–112. IEEE.
- 20 Zakaria, Y. and Michael, K. (2017). An integrated cloud‐based wireless sensor network for monitoring industrial wastewater discharged into water sources. Wireless Sensor Network 9: 290–301.
- 21 Xie, G., Ota, K., Dong, M. et al. (2017). Energy‐efficient routing for mobile data collectors in wireless sensor networks with obstacles. Peer‐to‐Peer Networking and Applications 10 (3): 472–483.
- 22 Vasisht, D., Kapetanovic, Z., Won, J. et al. (2017). Farmbeats: an iot platform for data‐driven agriculture. In: 14th {USENIX} Symposium on Networked Systems Design and Implementation ({NSDI} 17), 515–529.
- 23 Miqdad, A., Kadir, K., and Ahmed, S.F. (2017). Development of data acquisition system for temperature and humidity monitoring scheme. In: 2017 IEEE 4th International Conference on Smart Instrumentation, Measurement and Application (ICSIMA), 1–4. IEEE.
- 24 AlSkaif, T., Bellalta, B., Zapata, M.G., and Ordinas, J.M.B. (2017). Energy efficiency of MAC protocols in low data rate wireless multimedia sensor networks: a comparative study. Ad Hoc Networks 56: 141–157.
- 25 Modieginyane, K.M., Letswamotse, B.B., Malekian, R., and Abu‐Mahfouz, A.M. (2018). Software defined wireless sensor networks application opportunities for efficient network management: a survey. Computers and Electrical Engineering 66: 274–287.
- 26 Sethi, S. and Sahoo, R.K. (2019). Design of WSN in real time application of health monitoring system. In: Virtual and Mobile Healthcare: Breakthroughs in Research and Practice, 643–658. IGI Global.
- 27 Kaur, H., Atif, M., and Chauhan, R. (2020). An internet of healthcare things (IoHT)‐based healthcare monitoring system. In: Advances in Intelligent Computing and Communication, 475–482. Singapore: Springer.
- 28 API request, https://thingspeak.com/channels/952366/api_keys, accessed on 01.12.2019 at 12.35 PM.
- 29 WeMos D1 mini ‐ Mini NodeMcu 4M, https://www.amazon.in/gp/product/B07LCHS2MM/ref=ox_sc_act_title_1?smid=A3HAGIAPX2OISQ&psc=1, accessed on 01.12.2019 at 12.40 PM.
- 30 Arduino IDE, https://www.arduino.cc/en/Main/Software, accessed on 01.12.2019 at 12.45 PM.
- 31 ThingSpeak IoT platform, https://thingspeak.com, accessed on 01.12.2019 at 12.45 PM.