How do events, such as unexpected news, affect the price of a stock? Traders believe that having early knowledge of an impending piece of news—good or bad—provides them with an information advantage that they can exploit. If they know the true value of a stock (i.e., after the effects of an event) in advance, they can buy before its price rises or sell before it falls.
But foreknowledge alone—or more likely, a strong hunch, termed conviction in the industry—isn’t enough. Even if you are highly confident that an upcoming event will raise or lower a given stock’s price, you need to forecast by how much that price will change to make a rigorous portfolio decision. And you must recognize the possibility that other investors have already accounted for the event—the news may already be “priced into” the stock. Further, how long after an event will its effects be completely “priced in,” with no further effect on the stock’s price? This can help an investor decide on his or her holding period following an event.
The efficient markets hypothesis (EMH) rejects the view that information can provide a durable investing advantage to varying degrees, depending on its strength (weak, semistrong, or strong). The EMH argues that news propagates into prices very quickly, so there are at best only very fleeting opportunities to arbitrage information discrepancies.
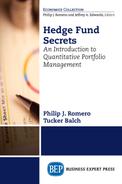
Event studies are a research method developed to illuminate this debate. The most comprehensive meta-study of the effects of events on stock prices was published by A.C. MacKinlay in the Journal of Economic Literature in 1997. Its results are summarized in Figure 12.1.
MacKinlay tabulated daily price data for stocks that experienced about 1,700 “events”—company-specific news items. He arrayed these data for 3 weeks (21 days) before and after the event, and computed daily price changes, averaging them among all the stocks in one of three groups: those that experienced good news (the top series); bad news (the bottom series); and a control group of no company-specific news (the middle series). Day 0 is the date of the event for each stock.

Figure 12.1 Average effects of news on stock prices
Source: MacKinlay (1997).
The first impression a viewer forms of these series is that markets react very quickly to events, and in the expected direction: Stock prices drop by an average of 1.5 percent immediately after (on the day of and day after) a bad news event, and rise by 2 percent immediately after a good news event. As expected, there is no evident pattern among the control group.
But look also at the pattern in the days leading up to the event. Stock prices gradually creep upward before good news events, and slide downward before bad news events. EMH adherents argue that this corroborates their theory: Information about the impending event has leaked forward, and been traded upon, enough to consume about half the total price change that occurs from the base date until the day after the event. A counterargument is that news may simply confirm preexisting biases about a stock: Good news magnifies ongoing price gains, and bad news confirms pessimism that was already driving prices lower.
Look also at the price trajectory in the weeks after events. Stocks gain further beyond the immediate event-driven price increase after good news, and recover about half the event-driven loss after bad news. These are examples of overshoots common in markets. As the section on arbitrage showed, investors can arbitrage overshoots, anticipating a reversion to the mean.
Event studies can help investors to anticipate the future trajectory of a stock’s price before and after news events. While they can maximize the value of this information if they correctly anticipate an event, they can still make money after an event if they exploit knowledge about how the event will affect a stock’s price.
Conducting an Event Study
Besides an optimizer, QSTK includes an event profiler. The analyst identifies the population of stocks for which he wishes to analyze the effect of events on returns. For the example in Figure 12.2, we used all stocks in the S&P 500 (the 500 largest publicly traded U.S. companies, measured by market capitalization), for the full years of 2008 and 2009. We built an event table that indicated the dates on which company-relevant events occurred, and queried QSTK as to each stock’s return relative to the market (using the SPY ETF as a proxy for the overall market) day by day before and after events. We set screens so that only stocks whose returns dropped at least 5 percent relative to the market were included in the set. This is the event we’re looking to analyze. The study yielded 497 stocks and dates for which this event occurred, or about one per trading day in the 2 years. The line in Figure 12.2 shows the average relative return, with the vertical lines around it indicating their (large) standard deviation.

Figure 12.2 Market-relative mean return of 1704 events in 2008–2009, courtesy of Lucena Research
The results of this illustrative event study are broadly consistent with MacKinlay: About half of these stocks’ cumulative excess return ebbed away in the 21 days leading up to the event, with the remainder being lost on the event day itself. Following the event, prices recovered from their event-driven overshoot, regaining about half of the event loss, with the peak excess return coming on about day 12 after the event.
This is a single illustration and should not be casually generalized—do not go out and trade on the basis of this one example. But it illustrates the utility of event studies for developing trading strategies.
Assessing and Using Event Studies
Hedge funds use event studies to identify and appraise trading strategies. Commonly, analysts test out a strategy in a market simulator—a system programmed to generate price trajectories based on random combinations of historical price histories. Strategies are backtested—evaluated on the basis of how they would have performed under past market conditions.
A simple example of an equity value strategy would be to buy a stock whenever its price is near the bottom of its Bollinger band—a range of plus or minus one standard deviation around its mean—while the market is near the top of its own Bollinger band. This strategy would go long in putatively underpriced stocks at a time when the overall market seemed to provide a tailwind. An event study could examine returns following events for these stocks versus returns for all other stocks.
Such studies can not only identify opportunities to generate alpha in a purely directional sense but they can also identify the optimal holding period after an event. Figure 12.2 illustrates this. The stocks affected by the 497 events studied retraced about half their losses in the 3 weeks after the event. Note how, over that time period, standard deviation rose—risk was increasing. While the maximum gain was earned at about 10 days after the event, its risk was substantially higher than at earlier points, such as 5 days after the event. It appears to the eye that the maximum risk-adjusted return (i.e., Sharpe ratio) occurred about five days after the event.
One final point about event studies that has been made before but bears repeating: Automated trading systems can be highly error prone because of faulty assumptions, or coding errors. It is always critical that a human being does a “sanity check” on study results, and on their implementation in trading strategies. When every trade is small (such that it takes thousands of trades to generate significant income), this step can be easily overlooked. But coding errors or “fat fingers” have nearly ruined several major institutions, so a human check on automatic execution can be vital.