The Fundamental Law of Active Portfolio Management
Wide diversification is only required when investors do not understand what they are doing.
—Warren Buffett
Buffett’s quote seems to contradict quantitative investment approaches: Quant funds often diversify across hundreds or thousands of positions. Do quant funds know what they are doing?
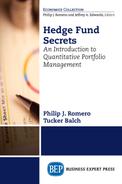
You already know Warren Buffett is an effective fund manager, perhaps the best ever (see Figure 10.1). What might we learn from his investing style? We can learn a lot, of course, but let’s focus here on his allocation strategy: How does he apportion Berkshire Hathaway’s (BRK-A and BRK-B) assets across the various equities they hold? (Figure 10.1).
Buffett invests strongly in a small number of companies: As of September 2010, 54 percent of BRK-A’s holdings were in just three stocks: Coca Cola (KO), American Express (AXP), and Wells Fargo (WFC). Ninety percent of its holdings were in just 12 stocks. Let’s compare Buffett’s allocation with Renaissance Technologies’ Medallion Fund. Renaissance Technologies (RenTec) is perhaps the most successful quantitative hedge fund management firm, with consistent annual returns of 35 percent or more for their Medallion Fund each year. In contrast to BRK, RenTec’s portfolio is distributed more or less uniformly across hundreds of positions.

Figure 10.1 Performance of Berkshire Hathaway
Source: Yahoo.com
So we have two very different but successful allocation strategies. They are at either end of a spectrum: one with just a few holdings (BRK-A) and another with hundreds (RenTec). You may be interested to learn about an investment theory that explains how they can both be successful.
Relating Performance, Skill, and Breadth
In the 1980s, Richard Grinold introduced what he calls the Fundamental Law of Active Portfolio Management. It is described nicely in his book with Ronald Kahn, Active Portfolio Management. For the moment we will offer a simplified version of this law. We paraphrase it as follows:

Skill is a measure of how well a manager transforms information about an equity into an accurate prediction of future return, and breadth represents the number of investment decisions (trades) the manager makes each year. This law suggests that as a manager’s skill increases, returns increase. That is not surprising. What is interesting and perhaps surprising is that to double performance at the same level of skill, a manager must find four times as many opportunities to trade.
The law also implies that Buffett could improve his performance significantly by expanding his portfolio. Why doesn’t he do that? We can only speculate, but it is likely because his skill does not scale. Not only that, he is probably aware of the diminishing returns suggested by the Fundamental Law: If he worked twice as hard by looking at more companies, returns would only improve by 41 percent. Buffett spends a great deal of time understanding a small number of companies deeply. His attention and depth enable him to make accurate predictions for the companies he thinks about. But he can’t apply this depth of attention to all of the 4,000 equities traded on the NYSE.
On the other hand, RenTec’s predictive power is not as strong as Buffett’s, but it is scalable. They use computerized techniques to assess thousands of equities in a more shallow way. But they do it rapidly, perhaps hundreds of times a second. The accuracy of each of their predictions is not as high as Buffett’s, but because they are able to apply a modest level of skill to so many equities their breadth substantially outpaces his.
Breadth as Diversification
There are two ways to increase the breadth of a portfolio: We can choose to hold more equities at once, or we can turn over those assets more frequently. The first approach is more suitable for a conventional managed portfolio approach to investing, while the second relates more to an active trading strategy. In this section, we’ll take a look at the managed portfolio.
You’ve heard the cliché “don’t put all your eggs in one basket.” If you run into a negative surprise regarding that basket, you will be glad that all your eggs are not there. By the same token, if the basket surprises you positively, you will regret having spread your bets around.
Modern portfolio theory distinguishes between two broad categories of risk:
• Systematic risk is that risk undertaken by exposure to any asset in the asset class. You may invest in the bluest blue chip stock, but it too will take a beating if the entire market falls.
• Specific risk is the risk associated with a particular asset. An oil company’s stock price may suffer if a new oil field fails to produce as expected—regardless of what else is occurring in the stock market.
Diversification mutes specific risk. Research has shown that the volatility, or standard deviation of returns, of a portfolio of stocks declines as more individual stocks are included in the portfolio. Accordingly, some investment advisors counsel limiting any single position to no more than 5 percent of a total portfolio. (Some recommend even lower percentages.) But the benefit decelerates as the portfolio becomes too diverse. Experts argue that diversification beyond 20 to 40 separate issues provides little additional risk reduction.
There is a trade-off, however. The more breadth in an investor’s portfolio, the less expertise they can apply to each of its contents. Since alpha is assumed to stem from research and knowledge—that is, from investment-specific information—the broader the portfolio, the less alpha that can be generated.
Breadth as More Frequent Trading
Another approach to adding breadth to a portfolio or strategy is through more trading opportunities. We will illustrate that idea here using a simple example of an even money bet: coin flipping.
Assume you have been given a coin and invited to wager on the result of a series of coin flips. Each flip requires you to bet a fixed amount, which you choose; say $1 at the start. If the coin lands on the side you predict, you receive a second dollar: a 100 percent return. If it lands on the other side, you lose your bet: a –100 percent return. If the coin was fair (i.e., it could fall on either side with an equal 50 percent probability), then the expected return of any one-dollar bet would be zero, regardless of how many times you bet:
Expected return for each flip = Prob (heads) × Reward (heads) +
Prob (tails) × Reward (tails) = 0.50 × $1 + 0.50 × (–$1) = 0
Therefore, the total expected return would be zero regardless of the number of flips for one dollar each.
But say your coin wasn’t fair—it had a small bias toward one side, say heads. Let that small bias reflect skill. Assume the bias creates a 51 percent probability of heads and a 49 percent probability of tails. Clearly your expected return for each flip will now be positive:
Expected return for each flip = 0.51 × $1 + 0.49 × (–$1)
= 0.51 – (–.49) = 0.02 (two cents)
Clearly, this is a bet you wish to take. The question is, for how much each flip? Say you have $1,000 to bet. Should you bet it all on a single $1,000 flip, or flip 1,000 times for 1,000 individual one-dollar bets? This is analogous to the question: How diverse should your portfolio be?
The expected return is the same whether you make one bet of $1,000 or 1,000 bets of $1:
| 0.02 × 1,000 | = $20; |
(Exp return per bet) × (# of bets) = (Exp return for all bets)
or
| $20 × 1 | = $20 |
(Exp return per bet) × (# of bets) = (Exp return for all bets)
The expected return is the same for each situation, but the risk is very different.
First, for the single-bet option, there is a 49 percent chance that you will lose your entire $1,000 stake. For the multiple bet option, the probability of a total loss—the coin coming up tails each of 1,000 times—is 0.49 ^ 1,000, which is infinitesimal (too small to be displayed on our spreadsheet, even to 23 significant digits). So for this measure, risk is substantially lower for the 1,000-bet scenario.
But we can also use standard deviation—a measure of the range of plausible returns—as a measure of risk. For a single $1,000 bet, the standard deviation is $31.62. For the 1,000 $1 bets, the standard deviation is $1. So for this measure, we also see significantly lower risk for the 1000-bet case. In finance, we often compare strategies in terms of risk-adjusted return, which is to say return divided by the risk. So the return to risk ratios of the two options are as follows:
Single $1,000 bet: $20 reward/$31.62 risk (standard deviation) = 0.6325
One thousand $1 bets: $20 reward/$1 risk = 20.0
This return to risk ratio is similar to the Sharpe ratio. But it is not based on excess return—it doesn’t explicitly deduct a no-risk return from our expected return. But if the risk-free return is zero—if the only way to earn a return is by betting on coin flips—then this is essentially the Sharpe ratio. This specific version is called the information ratio, discussed later in this chapter.
The “diverse” option where we are able to flip the coin more times has a reward to risk ratio more than 30 times that of the concentrated option!
A Few Definitions
We will soon present the Fundamental Law in full. But we must first introduce some terminology. The Fundamental Law relates overall portfolio performance to investor skill and breadth (or diversification). In our coin flipping example, breadth is reflected in the number of flips, while for investing, it relates to the number of investment opportunities.
To fully explain the Fundamental Law, we need to introduce two new terms. These are, frankly, not well labeled. But their names have become commonly used, so we are stuck with them.
Information Ratio
A key measure of performance used in quantitative portfolio management is the information ratio (IR). IR is similar to the Sharpe ratio; it adjusts return for risk, by dividing them:
IR = excess return per period/(standard deviation of excess return
per period)
We must be more specific now about what we mean by “excess return.” In particular, we seek to measure return that is due to the investor’s skill rather than return that is due to the market. Recall that the CAPM separates market return from stock-specific return:
return (stock i) = beta (i) × return (market) + alpha (i)
The alpha component is sometimes called the “residual.” It reflects the component of price movement that cannot be attributed to the market overall. It is sometimes attributed to the skill of the investor for having selected the stock. Because returns vary daily, the aforementioned terms are usually averages (means) of a series of daily returns. Their variation, or risk, is captured by their standard deviations. You can think of the total return as having two risk components:
• Market risk, captured by the standard deviation of [beta × return (market)].
• Investor-specific or “skill” risk, captured by the standard deviation of alpha.
Hedging investing strategies seek to minimize or eliminate the market risk, leaving a clear field to exploit the investor’s alpha. A summary measure of skill is the IR of an investor’s alpha, or:
IR (alpha) = Mean (alpha)/Standard deviation (alpha).
This adjusts the average excess return the investor earns by the risk he runs.
Information Coefficient
A manager’s information coefficient (IC) is the correlation of a manager’s predictions about asset prices with their actual future prices. A perfect predictor would have an IC of 1.0; a perfectly wrong predictor would have an IC of –1.0. IC captures the quality of the information a manager uses in forecasting prices.
Breadth
The breadth (BR) of a portfolio or management strategy is simply the number of trading opportunities presented over time.
The Fundamental Law in Full
Grinold’s Fundamental Law of Active Portfolio Management relates IR to IC and breadth as follows:
![]()
Implications of the Fundamental Law
An increment of added skill, reflected in the IC, has a greater reflection on risk-adjusted return (the IR) than does an equal increment in portfolio breadth. This is because the portfolio breadth affects the IR as a square root, whereas IC affects IR proportionally. So for an investor like Buffett, whose IC is probably among the highest on the planet, he is absolutely correct—for him—to disparage diversification.
As was mentioned earlier, expanding a portfolio’s breadth often means expanding beyond what Buffett calls the investor’s “circle of competence.” That is why, for example, he eschewed technology businesses during the dot com era. In other words, there may be a physical trade-off between breadth and IC. For both these reasons, it is rational to seek a higher IC rather than increased portfolio diversity—if you can actually improve your IC.
Jim Simons, Renaissance Technologies

Born: 1938, raised in Brookline, Massachusetts
Firm: Renaissance Technologies (RenTec). Flagship fund: Medallion Fund
Founded: 1982
Annual return: 39 percent, 1989 to 2006
AUM: $20 billion (2010)
Style: Quantitative all-asset trend-following, specializing in commodities
Simons’ background: B.S. in Math, MIT; PhD in Math, UC Berkeley. Mathematician and code-breaker at the Institute for Defense Analysis (IDA); winner of the highest prize in geometry. Fired from IDA for opposition to the Vietnam War, Simons rode from Boston to Bogota, Colombia, on a motor scooter. He then launched a factory in Colombia. Successfully traded commodities during the high-inflation, high-volatility of the late 1970s, collecting a team of applied mathematicians who used the principles of cryptography to “decode” commodity price patterns.
Differentiation: RenTec employs many scientists and mathematicians without financial backgrounds, believing that they can examine financial data without preconceptions. “Simons’ team took their experience with code-breaking algorithms and used it to look for ghostly patterns in market data. Economists could not compete in the same league, because they lacked the specialized math to do so.” (from More Money Than God)