
In this chapter, we will cover:
Remote debugging with Opera Dragonfly
Remote debugging with weinre
Using Firebug on mobile
Remote debugging with JS Console
Setting up Mobile Safari debugging
Although debugging can take a significant amount of time, it is an important aspect of web development, both for desktop and mobile. In this chapter, we will go through some of the mobile debugging tools used to make frontend debugging easier, faster, and make web development more productive.
Mobile debugging is different from desktop debugging due to the relatively smaller mobile screen.
Make sure you are on a WiFi network.
Download the latest version of Opera desktop browser at http://www.opera.com/.
Download Opera Mobile on your mobile device.
At the time of writing, Opera is at version 11.50. Some of these instructions may change by the time you read the book.
Open up Opera on your desktop, and from the drop-down menu, choose Page | Developer Tools | Opera Dragonfly.
You should see a debugger tool appear at the bottom of the page. Click on Remote debug configuration, as shown in the following screenshot:

Once we click on the Remote debug configuration button, there will be a pop-up panel.
On the panel, you can see a text field to specify a port number and an Apply button. The default number should be unused and should work fine. Click on Apply:

Now fire up your desktop console and type in
ipconfigas the command. The IPv4 address is your IP address.Open Opera Mobile on a mobile device, type
opera:debugin the URL address bar, and we will arrive at a page as follows:
Enter the IP address you got from the desktop console, and click on Connect. Now the mobile browser should be connected to Dragonfly:


Target browsers: iOS, Android, Blackberry, webOS
In the previous recipe, we saw how you can debug Opera mobile pages remotely. In this recipe, we will see how we can debug remotely in other mobile devices. Weinre is a Web Inspector Remote.
The supported OS include:
Android 2.2 Browser application
Android 2.2 w/PhoneGap 0.9.2iOS 4.2.x
Mobile Safari application
BlackBerry v6.x simulator
webOS 2.x (unspecified version)
First, we must download weinre from the official website; there are two versions available, one for PC and one for Mac:
First, get your IP address by running
ipconfigin your console.Create an HTML document and name it
ch07r01.html. Replace192.168.1.11with your own IP address:<!doctype html> <html> <head> <title>Mobile Cookbook</title> <meta charset="utf-8"> <meta name="viewport" content="width=device-width, initial-scale=1.0"> </head> <body> <header> <h1>Mobile Cookbook</h1> </header> <div id="main"> </div> <script src="http://192.168.1.11:8081/target/target-script-min.js"></script> </body> </html>
First, locate the downloaded
weinre.jarfile. In my case, the path isC:xampphtdocsdevweinre.jar. Second, get the IP address, in my case,http://192.168.1.11.Now fire up your console and type the following line:
java -jar path/to/weinre.jar -httpPort 8081 -boundHost http://192.168.1.11To test if it works, visit the URL address
http://192.168.1.11:8081/, a page close to the following screenshot should appear:
Now use your mobile device to access the sample page created:

Now, back on the desktop, click on Debug client user interface. Do not open a tab, but open in a new window.
You should be able to see something like the following screenshot:

Click on Elements, and now you can inspect the elements (as shown in the following screenshot):

Target browsers: cross-browser
Many people use Firebug on Firefox and Chrome, but Firebug Lite can be used on any browser that supports JavaScript. In this recipe, we will see how to use Firebug to debug.
Enter the following code in HTML:
<!doctype html>
<html>
<head>
<title>Mobile Cookbook</title>
<meta charset="utf-8"> <meta name="viewport" content="width=device-width, initial-scale=1.0">
</head>
<body>
<div id="main">
</div>
<script type="text/javascript" src="https://getfirebug.com/firebug-lite.js"></script>
</body>
</html>
Render it in a mobile browser:

Firebug Lite is a JavaScript version of Firebug. The following line of code will load Firebug Lite script hosted on the Firebug site:
<script type="text/javascript" src="https://getfirebug.com/firebug-lite.js"></script>
You can also download the script and add it as a local version.
You can access HTML, CSS, and JavaScript, and view the DOM. The console can be used for JavaScript input.
There are four distribution channels for Firebug Lite:
The one we have been using is the stable channel. Other channels are explained under the There's more section.
Apart from the live and local version, you can also add the bookmarklet. It may not work on all browsers. Here is how it can be done.
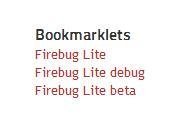
Click on the links on the right-hand side of the page: http://getfirebug.com/firebuglite
This adds the hash
#javascript:(function... to the end of the URL in the mobile browser.Bookmark the page on Safari.
Edit the bookmark's name to be the name of the bookmarklet, Firebug Lite, Firebug Lite debug or Firebug Lite beta.
After you save the bookmark, open the bookmark menu, select Firebug Lite and click on Edit. Delete the URL and the
#, so only the part that starts withjavascript:(functionremains.Now if you open any web page and tap on Firebug Lite bookmark, a Firebug console will appear at the bottom-right corner of the page.
The debug channel uses the same version as the stable channel, but with different pre-configurations to make it easier to debug Firebug Lite itself.
The beta channel is where the new features and fixes are polished. It should be considerably stable (no known regression), but it may contain some bugs and some features may be incomplete.
The developer channel is where the ideas get created and tested. Once it is tied directly to our code repository, you'll get the most recent code possible and will receive updates much more frequently than other channels. One thing to be aware of, however, is that the developer channel can be very unstable at times and the initial load can be slower.
Target browsers: cross-browser
If you only look for remote JavaScript debugging, Remy Sharp has an awesome tool named JavaScript Console. It is really productive for mobile debugging.
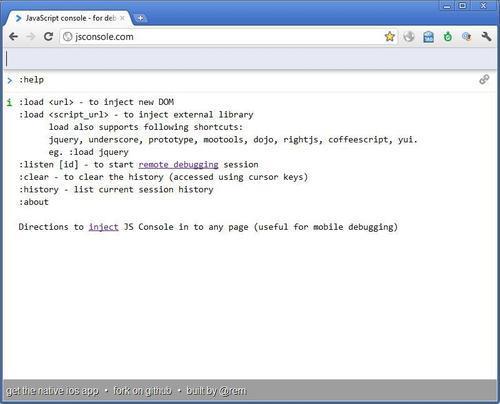
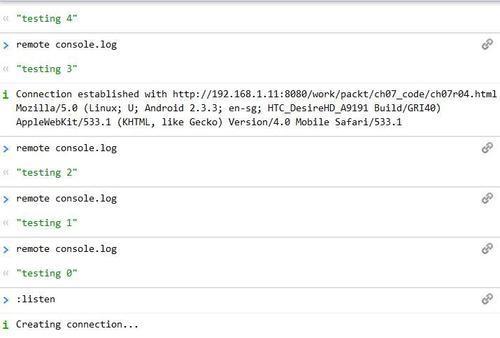
Enter
:listenon the site, and you should see the following info messages returning:Creating connection …
Connected to "65C1F9F1-6A57-46C0-96BB-35C5B515331F"
This will be followed by a line of JavaScript looking like:
<script src="http://jsconsole.com/remote.js?65C1F9F1-6A57-46C0-96BB-35C5B515331F"></script>
Create an HTML page and name it
ch07r04.html. Enter the following code to the document, replace the<script>...</script>with your own script that you got from jsconsole.com:<!doctype html> <html> <head> <title>Mobile Cookbook</title> <meta charset="utf-8"> <meta name="viewport" content="width=device-width, initial-scale=1.0"> </head> <body> > <div id="main"> </div> <script src="http://jsconsole.com/remote.js?04926BFB-44AB-4979-BAE9-F4A4FA7CE22C"></script> <script> for (var i=0; i<10; i++) { console.log('testing '+i); } </script> </body> </html>Now if we render the page on a mobile device, we will see the desktop screen web page has log messages appearing:
In the following loop, we use console.log to output a string of messages:
<script>
for (var i=0; i<10; i++) {
console.log('testing '+i);
}
</script>
Any calls to console.log from your web app will display the result in the jsconsole session that is listening to your key. Equally, if you run a command in the jsconsole session, the code will be injected in to your web app and the result returned to jsconsole.
The entire JavaScript Console web app is open source; if you want to learn more about how it was made, visit: https://github.com/remy/jsconsole.
JS Console for iOS, also made by Remy Sharp, is a JavaScript console to test and inspect the results of your JavaScript without the need to be online or in a browser.
This video made by Remy Sharp shows how remote debugging JavaScript is done in iOS using jsconsole.com. It shows how to receive logs and send arbitrary commands:
http://www.youtube.com/watch?v=Y219Ziuipvc&feature=player_embedded
In the following video, Remy Sharp recorded a walk through of how to use jsconsole.com to remotely debug any browser on any device:
http://www.youtube.com/watch?v=DSH392Gxaho&feature=player_embedded
On iOS mobile Safari, there is a built-in debugger for debugging.
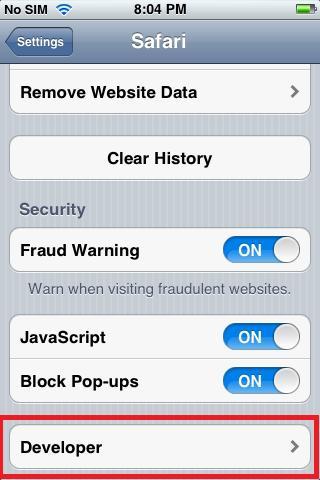
Find and open the Settings application:


Scroll down to find the Developer option at the bottom:
By default, the Debug Console is OFF:

Now we can switch the Debug Console to ON:

In Safari, look for the debug console's summary info at the top of the page, just below the URL bar:

Touch the summary info to view a detailed report for the errors on the page.
Now, let's create an HTML document and name it
ch07r05.html. Enter the following code to the page:<!doctype html> <html> <head> <title>Mobile Cookbook</title> <meta charset="utf-8"> <meta name="viewport" content="width=device-width, initial-scale=1.0"> </head> <body> <div id="main"> </div> <script> for (var i=0; i<3; i++) { console.log('testing '+i); } </script> </body> </html>When rendering it, we can see:

