
11
Video Conferencing (VC) Software Selection Using Fuzzy TOPSIS
Rekha Gupta*
Lal Bahadur Shastri Institute of Management, Delhi, India
Abstract
The coronavirus-19 pandemic had bought drastic changes to the teaching and learning environments. With learning setups shifting entirely to the online medium, the higher education institutions were faced with the dilemma of selecting the video-conferencing software along with technical infrastructure setup, users training issues. The selection decisions were frequently done randomly with little IT expertise to guide. Even soon, the hybrid mode (physical teaching combined with online mode) would be the teaching mediums offered by the higher education institutions as for now they have some familiarity in terms of usage and technical setup of the software. Several advantages, as well as disadvantages of online teaching have been realized and experienced during the said times. Further, the institutions faced the dilemma of not selecting the most viable video conferencing solution as per their requirements. Therefore, the author attempts to provide a comprehensive guide for selecting the most apt video-conferencing software for the higher education institution based on their requirements and further attempts to rank the available options using Fuzzy-TOPSIS method.
Keywords: Online teaching, higher education institutions, hybrid mode of teaching, videoconferencing software, Fuzzy TOPSIS
11.1 Introduction
Novel coronavirus virtually impacted all sectors worldwide and had been instrumental in transforming education sector enormously with millions of teachers and students shifting from traditional mode to online mode. UNESCO (2020) also called this as an education emergency [1]. International Labor organization (ILO), 2020 reported that disruption in education sector had impacted several million schools, educational institutes, teachers, and students [2].
Most higher education institutions (HEI) struggled overnight to select, install the basic video conferencing software to impart the teaching lessons to have unhindered learning process. The software for online teaching was mostly selected randomly/recommended/suggested by the little IT team available with the institutions. Most teaching institutions, organizations, teachers, and students were completely new to the interface of the video conferencing software and hence, struggles were apparent in the initial days with all stakeholders. With or without training, slowly the stakeholders got adapted to the usage and features of the videoconferencing software.
This scenario also provided an ample market opportunity for the companies selling the videoconferencing software for educational institutions. Some of the prominent companies in the videoconferencing market were Microsoft with MS Teams, Cisco with Cisco WebEx, Google with Google Meet, Lark, Zoom, etc. Few other companies, such as TCS-ion sold their Learning Management System bundled with video-conferencing software. Prior to the pandemic, the companies had been offering this software as part of the bundle package along with mail subscription and office suite products. The pandemic bought ample opportunities for companies to view this product in huge demand and as a revenue generator. Subsequently, many of them utilized the opportunity to invest, enhance features, commercialize, and market it properly.
Online teaching has been extensively reviewed in research studies for its advantages, as well as its disadvantages. Some of the notable advantages listed are anytime, anyplace and from anyone kind of teaching. It is more affordable and saves time for producing measurable results. Other advantages were repeated access to recorded lectures, flexibility in increasing number of students, providing learning opportunities to distant students. Further, online teaching ensures consistency, convenience, and same experiential learning to near and distant students.
Few disadvantages enlisted were the dependency of administrators, teachers, and students on information and communication technologies, requirement of continual technical training and support, monitoring of online teaching quality, rigor of assessment and learning and teaching motivation were other factors that were recorded as degrading factors of online education. Learner’s isolation, frustration, and lack of peer group learning were also recorded as other disadvantages.
With the pandemic stage set in 2020, it became imperative that online teaching was the only available via medium to continue with the teaching, learning process. Hence, the immediate requirement was to select the video conferencing software for delivering the same. As institutions grappled with the choices available to them, it was felt to discuss the factors that lead to the selection of a video conferencing software and present a selection mechanism. It is also evident that during the pandemic and post-pandemic times, the hybrid mode of teaching is to stay as institutions have experienced its advantages with stakeholders willing to adapt to the digital mode of learning and teaching.
Therefore, this paper attempts to cover the following objectives:
- To enlist the major features of Video-conferencing software.
- To illustrate the Fuzzy-TOPSIS methodology for videoconferencing selection.
- Numerical illustration for selection using real time data from higher education institutes in Delhi-NCR.
11.2 Video Conferencing Software and Its Major Features
11.2.1 Video Conferencing/Meeting Software (VC/MS) for Higher Education Institutes
The VC software provided for meeting online for conduct of regardless of location, role, experience level, language, and device preference, which was of prima face importance in times of coronavirus. The author had tried to scan major videoconferencing software used by Higher-Education institutions particularly the B-schools imparting management and technology education in Delhi-NCR region. The discussion, however, is restricted to common features that are available in all VC software. Thus, an attempt was also made to enlist the features that the institutions considered/would like to consider in near future in case they would want to change the software. The major critical features of VC software are presented below:
- Meeting Capacity
The number of participants that are allowed in a meeting in the VC software generally varied from 100 to 500. These were live interactions and allowed participants to unmute, speak and open their videos. Higher education institutes generally have a class size of 60 and have 3-6 sections in a batch. Hence, this meeting size was apt for taking classes and batch wise interaction. However, this was insufficient for addressing all the students of the institution together. The alternative option available is a webinar/livestream mode with live feed in which attendees as passive audience with chat option for interaction. The webinar mode could support up to 10,000 audiences. The batch interaction was facilitated through this option.
- Meeting Scheduling
The meetings could be prescheduled from the calendar or could be instantly initiated via a call. Some software allowed for web calls as well. The upgraded plans allowed for HD video and audio calling, as well. The calendar also had provisions for showing meeting conflicts, if any. With unlimited meeting call durations, meetings could remain valid for few days to 2 months. The meetings as per requirement could be scheduled as one-time or as recurring. The meeting links notification could be sent to individuals or group with the meeting notes. The meeting reminder was also an inherent feature. Meeting’s provision was supported through desktop, browser or mobile depending on the resource’s availability. The recipients had provision of accepting, denying, or replying to the meeting notification. The scheduler/presenter had access controls by options of wait/allow to join the meeting. He could also remove an attendee from the meeting. The meeting attendance feature was subsequently added by many vendors. These features allowed teachers to schedule classes, ensure punctuality, attendance, and discipline in classes.
- Meeting Control
The presenter had options of audio/video and chat controls. The presenter could disable attendees to mute others or remove from meeting. He could also mute all attendees and limit presentation rights. The presenter could ask the attendees to open their videos. Most VC software allowed for 25-49 screens to be viewed simultaneously. The provision of pinning a screen was also available for closer viewing and monitoring. This allowed the teacher to monitor the student activities online. This feature was also used by institutions to proctor the online exams. Although, this mechanism had its own limitations, it did make some psychological pressure on the examinees.
- Meeting Interaction:
This was facilitated through audio, video, and chat options primarily. The meetings provided for an audio/video preview to prepare oneself for the onscreen presence. The participants had the provision of using natural/customized backgrounds while sharing their on-screen presence. They had the raise hand feature to showcase their queries. Some VC software also looking to provide backgrounds with a running video. The meeting software also automatically adjusted layouts on screen to display most active participants. The presenter window could be zoomed/toggled for having an enlarged and clear view of shared content. Most vendors provided whiteboard feature that simulated a classroom blackboard. The presenters were allowed to share screen with screen annotation facility as well. The provision of chat was used for responding to queries of attendees and providing feedback. Chats could be broadcasted or be directed at individuals or a specific set of individuals. The chats also have emoji support for personalized responses and reducing notification. Chats could be pinned, and specific chat threads could be saved. Announcements, deadlines, or anything with a future reference in a chat could be also pinned to serve as reminders. Some VC software also provided auditorium view of presenter and attendees simulating the sitting in a class/conference. Also, the transcript facilities were provided in the VC software with translation provision in multiple languages for better understanding. Further integration with other applications, such as mail, document etc., could also be managed via the VC software for quick access, composure, and management. Further, enhanced, and improved features included cancellation of background noise, light adjustments, refreshed user interfaces and enriched reliability features along with data saver features on video calls.
- Individual and Group workspace
The meetings provided a forum for simulating a classroom with all students as attendees and teacher as presenter. The meeting further has breakout rooms’ provision for group activities, which is an essential feature in higher education. Further, VC software provided for individual and collaborative group space. The presenter/teacher was assigned exclusive space for content creation in terms of uploading files, assignments, and exercises. This space was viewable and noneditable for the attendees. Further, Individual workspace and group workspace allowed for attendees, in terms of uploading files for assignments and assessments. Further, cloud storage space was also allocated to all users by the meeting software. Almost all VC software allowed for high-speed upload and download of files in multiple file formats and that too with a secure cross platform synchronization.
- Assessment Provision
Assessment provision in the meetings was incorporated through polling and quick surveys. Further, a few VC software gave provision for designing a quiz or form like assessments with both multiple choice and subjective assessments. Automatic correction was also supported. Provision of scheduling, distributing and assessment was also inbuilt. Further, the attendees could see their scores and feedback too. Report generation for the given assessment was also included. The test link could be provided in chat or could be entered through a QR code. This was of immense relief to teachers as it provided them with some mechanism for administrating assessments online during pandemic times.
- Security
This was a prima face concern as teachers and students have known to be operating in a secure and protected physical boundaries away from online nuisances of auto play of advertisements, security breaches and privacy invasion. One of the important market strategies was to play the security card. Most of VC vendors used anti-hijacking measures and secure controls for anti-abuse measures by using secure service layer (SSL) or transport layer security (TSL) protocols. They attempted to provide a secure environment for their meetings and messages were encrypted in transit. Further, safety features were continually enhanced from the vendor side by continually verifying and updating their security, privacy, and verification compliance.
- Cost
When the pandemic started, most of the available VC softwares were free for education except a few. Others had upgraded business plans that included enlarged meeting capacity with enhanced features. While the free ones required a few compliances from the institutions side for the basic licensing plans. As pandemic progressed, the vendors switched the free plan to business plans for education institutions with only a few notable exceptions. The paid plans and features varied as per different subscription plans.
- Infrastructure requirement, Support and Training
Considered essential in the educational sector as all stakeholders were new to the usage of software, it was considered not only important but vital. The training support provided by the vendors tried to reduce the anxiety level of the users. Many big players provided free trainings and had ongoing training schedules. Further, customized training schedules were also provided on request. Most of the vendors provided business hours support for free plans and 24*7 phone and web support for pricier plans.
11.3 Fuzzy TOPSIS
11.3.1 Extension of TOPSIS Algorithm: Fuzzy TOPSIS
Hwang & Yoon [3] proposed the TOPSIS method in 1981. The linguistic TOPSIS method for group decision-making and the choice process was proposed by [4]. According to this technique, the best alternative would be the one that is nearest to the positive ideal solution and farthest from the negative ideal solution [5]. The positive ideal solution is a solution that maximizes the benefit criteria and minimizes the cost criteria, whereas the negative ideal solution maximizes the cost criteria and minimizes the benefit criteria [6–8]. In other words, the positive ideal solution is composed of all best values attainable of criteria, whereas the negative ideal solution consists of all worst values attainable of criteria [9, 10].
The detailed steps are described below:
- Fuzzy Ratings for Criteria
Identify the ERP vendors and the experts’ ratings. Use linguistic rating variable to assess the importance of the criteria as given in Table 11.1.
Table 11.1 Fuzzy linguistic ratings.
Linguistic scale Corresponding fuzzy numbers Very High (VH) (0.9, 1.0, 1.0) Medium High (MH) (0.7, 0.9, 1.0) High (H) (0.5, 0.7, 0.9) Medium (M) (0.3, 0.5, 0.7) Medium Low (ML) (0.1, 0.3, 0.5) Low (L) (0, 0.1, 0.3) Very Low (VL) (0, 0, 0.1) - Fuzzy Ratings for Alternatives
The decision makers use the linguistic rating variable to evaluate the rating of alternatives with respect to each criterion. The linguistic scale used is given in Table 11.2.
Table 11.2 Linguistic scale for alternative rankings.
Linguistic scale Corresponding fuzzy numbers Very Good (VG) (9, 10, 10) Good (G) (7, 9, 10) Medium Good (MG) (5, 7, 9) Fair (F) (3, 5, 7) Medium Poor (MP) (1, .3, 5) Poor (P) (0, 1, 3) Very Poor (VP) (0, 0, 1) - Fuzzy Decision Matrix and Fuzzy Weights
Convert the linguistic evaluation into triangular fuzzy numbers to construct the fuzzy decision matrix and determine the fuzzy weight of each CSF. The importance is computed as
(i)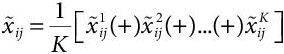 (ii)
(ii)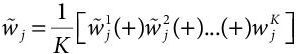
Where
 and
and  are the ratings and the importance weight of the Kth decision maker.
 - Normalized Decision Matrix
Construct the normalized fuzzy decision matrix
 where B and C are the set of benefit criteria and cost criteria, respectively and(iii)
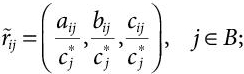 (iv)
(iv)
The normalization process ensures that the values of fuzzy numbers lie within range [0, 1].
- Weighted Normalized Decision matrix
Construct the weighted normalized decision matrix using eq. v
where

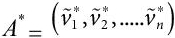
- FPIS and FNIS Determine the Fuzzy Positive Ideal Solution (FPIS, A*) and Fuzzy Negative Ideal Solution (FNIS, A−).
(vi)
 (vii)
(vii)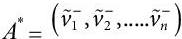
where
 = (1,1,1) and
  = (0,0,0) j = 1, 2,..., n
 - Distance Calculation
Calculate the distance of each candidate from FPIS and FNIS.
The distance of each alternative from A* and A− can be currently calculated as
(viii)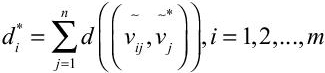 (ix)
(ix)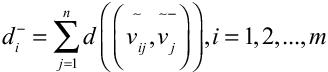
where d(.,.) is the distance measurement between two fuzzy numbers?
- Closeness Coefficient
The closeness coefficient is defined to determine the ranking order of all alternatives once their FPIS and FNIS is calculated.
The closeness coefficient of each alternative is calculated as
(x)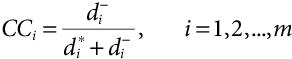
Candidates are ranked based on their closeness coefficient. The alternative that is closer to FNIS (A*) FPIS and farther from FNIS (A−) is selected. The one with approaching to 1 is selected as the best among feasible alternatives.
11.4 Sample Numerical Illustration
We hereby consider available three products P1, P2 and P3 for selection consideration. All the nine critical factors were evaluated firstly standalone by the experts for importance rating and later relatively to the products considered. A total of 10 IT experts who were instrumental in successful implementation of the VC software at their premises were considered for importance assessment. Further the criteria were classified as cost criteria that were to be minimized and as benefit criteria that were to be maximized. The author had considered cost that includes training cost as the cost criteria with all others being benefit criteria. Table 11.3 presents the criterion rating for each CSF as given by the ten experts. The criteria wise ranking of each product alternative as given by the experts is illustrated in Table 11.4. The Fuzzy Decision Matrix and Fuzzy Weights of Alternatives are recorded in Table 11.5. Table 11.6 records the Fuzzy Normalized Decision Matrix whereas Table 11.7 shows the Fuzzy Normalized weighted decision matrix.
Table 11.3 Importance weight of each criterion.
| Criteria | E1 | E2 | E3 | E4 | E5 | E6 | E7 | E8 | E9 | E10 |
| C1 | VH | H | MH | H | VH | H | VH | VH | MH | H |
| C2 | L | VL | ML | VL | L | ML | VL | L | VL | ML |
| C3 | H | H | H | VH | H | VH | H | H | VH | VH |
| C4 | VH | VH | H | H | H | VH | VH | VH | MH | VH |
| C5 | M | ML | M | H | H | M | M | M | M | H |
| C6 | H | VH | VH | MH | VH | H | MH | H | VH | H |
| C7 | MH | H | VH | H | VH | VH | MH | H | H | VH |
| C8 | H | H | MH | MH | MH | H | H | H | MH | M |
| C9 | VH | VH | VH | MH | VH | H | MH | H | VH | H |
Table 11.4 Linguistic rating variable for evaluate the rating of alternatives w.r.t each criterion.
| Criteria | Product | Decision makers evaluation | |||||||||
| E1 | E2 | E3 | E4 | E5 | E6 | E7 | E8 | E9 | E10 | ||
| C1 | P1 | VG | G | G | G | VG | VG | G | VG | G | G |
| P2 | MG | G | VG | G | G | G | MG | G | MG | G | |
| P3 | G | G | F | G | F | MG | MG | G | G | F | |
| C2 | P1 | VG | VG | MG | VG | VG | G | MG | F | G | G |
| P2 | G | F | F | VG | G | MG | G | G | MG | VG | |
| P3 | G | G | G | VG | MG | G | MG | MG | G | G | |
| Criteria | Product | Decision makers evaluation | |||||||||
| E1 | E2 | E3 | E4 | E5 | E6 | E7 | E8 | E9 | E10 | ||
| C3 | P1 | VG | G | MG | VG | VG | VG | MG | VG | G | G |
| P2 | VG | VG | G | MG | F | VG | VG | MG | VG | VG | |
| P3 | VG | VG | G | VG | MG | G | VG | G | VG | VG | |
| C4 | P1 | VG | VG | G | MG | VG | VG | VG | G | MG | G |
| P2 | MG | G | F | G | G | MG | VG | G | G | G | |
| P3 | G | VG | MG | G | MG | G | MG | VG | MG | G | |
| C5 | P1 | G | MG | G | MG | VG | F | VG | G | G | VG |
| P2 | G | G | G | G | G | G | F | F | F | G | |
| P3 | G | F | F | MG | G | F | G | F | VG | G | |
| C6 | P1 | VG | G | MG | G | G | MG | G | G | G | MG |
| P2 | G | VG | G | MG | F | G | F | G | G | G | |
| P3 | G | G | G | G | MG | G | G | G | MG | G | |
| C7 | P1 | G | VG | G | G | VG | G | VG | MG | VG | G |
| P2 | MG | MG | VG | G | MG | MG | F | G | G | G | |
| P3 | G | G | G | G | MG | MG | G | MG | G | G | |
| C8 | P1 | G | VG | MG | VG | VG | G | G | VG | VG | VG |
| P2 | G | MG | G | G | F | G | MG | MG | G | MG | |
| P3 | G | G | G | G | G | G | MG | G | VG | G | |
| Criteria | Product | Decision makers evaluation | |||||||||
| E1 | E2 | E3 | E4 | E5 | E6 | E7 | E8 | E9 | E10 | ||
| C9 | P1 | G | G | G | G | MG | MG | G | MG | G | G |
| P2 | G | G | G | G | G | G | F | F | F | G | |
| P3 | G | G | G | MG | F | G | F | G | MG | G | |
Table 11.5 The fuzzy decision matrix and fuzzy weights of alternatives.
| Criteria/alternative | C1 | C2 | C3 |
| P1 | (7.8,9.4,10) | (7.2,8.8,9.6) | (8.0,9.4,9.9) |
| P2 | (6.4,8.3,9.5) | (6.0,8.0,9.3) | (7.4,8.8,9.5) |
| P3 | (4.7,6.5,7.9) | (6.8,8.7,9.8) | (7.3,8.5,8.9) |
| Weight | (0.66,0.83,0.95) | (0.03,0.12,0.64) | (0.66,0.82,0.94) |
| Criteria/alternative | C4 | C5 | C6 |
| P1 | (7.6,9.1,9.8) | (7.4,9.1,9.9) | (6.6,8.5,9.7) |
| P2 | (6.6,8.5,9.6) | (5.4,7.4,8.8) | (6.2,8.1,9.3) |
| P3 | (5.05,6.53,7.65) | (4.85,6.33,7.35) | (5.25,6.83,7.85) |
| Weight | (0.8,0.93,0.98) | (0.34,0.54,0.74) | (0.7,0.86,0.96) |
| Criteria/alternative | C7 | C8 | C9 |
| P1 | (7.6,9.2,9.9) | (8,9.4,9.9) | (6.4,8.4,9.7) |
| P2 | (5.8,7.7,9.2) | (6,7.9,9.3) | (5.8,7.8,9.1) |
| P3 | (5.9,7.7,8.8) | (5.45,7.03,7.95) | (4.45,6.03,7.25) |
| Weight | (0.74,0.89,0.97) | (0.58,0.78,0.94) | (0.74,0.89,0.97) |
The distance calculation of the alternatives w.r.t to fuzzy positive ideal solution and fuzzy negative ideal solution are shown in Table 11.8. The closeness coefficient calculations are shown in Table 11.9 to compute the best alternative as per given criteria, expert ratings and alternatives.
The calculations indicate that P3 is the best candidate among the alternatives.
Table 11.6 Fuzzy normalized decision matrix.
| Criteria/alternative | C1 | C2 | C3 |
| P1 | (0.78,0.94,1) | (0.81,0.95,1) | (0.81,0.95,1) |
| P2 | (0.64,0.83,0.95) | (0.75,0.89,0.96) | (0.75,0.89,0.96) |
| P3 | (0.47,0.65,0.79) | (0.74,0.86,0.9) | (0.74,0.86,0.9) |
| Weight | (0.66,0.83,0.95) | (0.03,0.12,0.64) | (0.66,0.82,0.94) |
| Criteria/alternative | C4 | C5 | C6 |
| P1 | (0.78,0.93,1) | (0.75,0.92,1) | (0.68,0.88,1) |
| P2 | (0.67.0.87,0.98) | (0.55,0.75,0.89) | (0.64,0.84,0.96) |
| P3 | (0.52,0.67,0.78) | (0.49,0.64,0.74) | (0.54,0.7,0.81) |
| Weight | (0.8,0.93,0.98) | (0.34,0.54,0.74) | (0.7,0.86,0.96) |
| Criteria/alternative | C5 | C8 | C9 |
| P1 | (0.77,0.93,1) | (0.68,0.58,0.55) | (0.66,0.87,1) |
| P2 | (0.59,0.78,0.93) | (0.91,0.69,0.59) | (0.60,0.80,0.94) |
| P3 | (0.6,0.78,0.89) | (1,0.78,0.69) | (0.46,0.62,0.75) |
| Weight | (0.8,0.93,0.98) | (0.34,0.54,0.74) | (0.7,0.86,0.96) |
Table 11.7 Fuzzy weighted normalized decision matrix.
| Criteria/alternative | C1 | C2 | C3 |
| P1 | (0.51,0.78,0.95) | (0.02,0.11,0.64) | (0.53,0.78,94) |
| P2 | (0.42,0.69,0.9) | (0.02,0.11,0.61) | (0.5,0.73,0.9) |
| P3 | (0.31,0.54,0.75) | (0.02,0.1,0.58) | (0.49,0.71,0.85) |
| Criteria/alternative | C4 | C5 | C6 |
| P1 | (0.62,0.86,0.98) | (0.26,0.5,74) | (0.48,0.76,0.96) |
| P2 | (0.54.0.81,0.96) | (0.19,0.41,0.66) | (0.45,0.72,0.92) |
| P3 | (0.42,0.62,0.76) | (0.17,0.35,0.55) | (0.38,0.6,0.78) |
| Criteria/alternative | C7 | C8 | C9 |
| P1 | (0.57,0.83,0.97) | (0.39,0.45,0.52) | (0.49,0.77,0.97) |
| P2 | (0.44,0.69,0.9) | (0.53,0.54,0.55) | (0.44,0.71,0.91) |
| P3 | (0.44,0.69,0.86) | (0.58,0.61,0.65) | (0.34,0.55,0.73) |
Table 11.8 Distance calculation.
| Distances | A* | A− |
| P1 | 3.64 | 6.09 |
| P2 | 3.97 | 5.71 |
| P3 | 4.44 | 5.08 |
Table 11.9 Closeness coefficient.
| CCi | |
| P1 | 4.64 |
| P2 | 4.97 |
| P3 | 5.44 |
11.5 Conclusions
This chapter had enlisted the critical success factors that are to be investigated for institutions venturing into online teaching or looking for a change in their video conferencing software. The list id derived from firsthand experience of higher education institutions (HEI) that ventured into online teaching due to COVID-19 compulsions. This chapter further presents a mathematically simple Fuzzy TOPSIS method for selecting the video conferencing software. It would certainly help the implementers in selecting the best viable solution among the plethora of alternatives. The method also provides a mechanism for minimizing the cost criterion and maximizing the benefit criterion. Further, research directions in this area could be directed in terms of picking the most important CSF among the set of CSFs to be given due priority. Also, objectivity could be further enhanced by bringing the indecisiveness quotient also into the decision-making process. The same could be incorporated with the use of intuitionistic fuzzy sets.
References
- 1. Meinck, S, Fraillon, J., Strietholt, R., The impact of the COVID-19 pandemic on education: International evidence from the Responses to Educational Disruption Survey, (REDS), UNESCO, 2022.
- 2. ILO Monitor 2nd Edition, in: COVID-19 and the world of work: Updated estimates and analysis, International Labor Organization, Geneva, 2020.
- 3. Hwang, C.L. and Yoon, K., Multiple attributes decision making methods and applications, Springer, Berlin, 1981.
- 4. Chen, C.T., Extensions of the TOPSIS for group decision-making under fuzzy environment. Fuzzy Sets Syst., 114, 1–9, 2000.
- 6. Benitez, J.M., Martin, J., Roman, C., Using Fuzzy number for measuring quality of service in hotel industry. Tour. Manage., 28, 544–555, 2007.
- 7. Wang, Y.M. and Elhag, T.M.S., Fuzzy TOPSIS method based on alpha level sets with an application to bridge risk assessment. Expert Syst. Appl., 31, 309– 319, 2005.
- 8. Wang, Y.J. and Lee, H.S., Generalizing TOPSIS for fuzzy multiple-criteria group decision-making. Comput. Math. Appl., 53, 1762–1772, 2007.
- 9. Lin, C.T., Chen, C.B., Ting, Y.C., An ERP model for supplier selection in electronics industry. Expert Syst. Appl., 38, 1760–1765, 2011.
- 10. Ertugrul, I. and Karakasoglu, N., Performance evaluation of Turkish cement firms with fuzzy analytic hierarchy process and TOPSIS methods. Expert Syst. Appl., 36, 702–715, 2009.
Note
- * Email: [email protected]