Chapter 4. The Hyperbola Application
Where to start? The best bet is to create a simple shell that will evolve into Hyperbola. In this chapter we take you from your empty workspace to creating, running, and debugging an ultra-simple Hyperbola skeleton RCP-based application in about five minutes.
This is an introductory chapter aimed at showing you both the tooling used when developing Eclipse RCP applications and the general structure of RCP applications. In particular, the goals of this chapter are to
• Detail the creation of a “Hello, World” Hyperbola application. All the code required for this chapter is generated by standard Eclipse templates.
• Introduce the mechanics of creating RCP applications and manipulating code in Eclipse by creating and running a basic Hyperbola shell.
• Walk through the code for Hyperbola and identify the major players, seeing how it all fits together.
• Show how to use launch configurations to change the way Hyperbola runs.
• Show how to use launch configurations to debug Hyperbola.
4.1 Hyperbola “Hello, World”
You are now set up to develop Eclipse RCP applications. Here we show you how to use the built-in wizards and tooling to create a simple skeleton for the Hyperbola chat client developed throughout the book.
The first thing you need is a plug-in project to hold your code. Go to File > New > Project... to start the New Project wizard. Choose Plug-in Project and click Next. On this page enter the project name. Since you are just starting on Hyperbola, enter org.eclipsercp.hyperbola. Click Next and you should see a page similar to Figure 4-1.
Figure 4-1 Defining the plug-in content

Here, enter the information about the plug-in itself—its ID, version, name, and so forth. Based on the project name, the wizard guesses reasonable initial settings for most fields. The only things to change are these:
• Make sure to uncheck the Generate an activator... option; this is required only if your plug-in will do something during its start or stop lifecycle. We will use this later.
• Select the Yes radio button in the Rich Client Application area of the page. This tells the wizard to show the RCP templates on the next page rather than the standard templates.
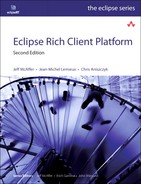
Click Next and the wizard moves to the RCP Templates page. There are templates of varying complexity. For this part of the book, pick the Hello RCP template to create what is probably the simplest RCP application possible, as shown in Figure 4-2.
Figure 4-2 Identifying the contents of the application
Click Next to advance the wizard to the next page. Here you identify the Hyperbola application and give it a window title, perspective name, and other attributes. You should have to change only the Application window title. Leave the Add branding option unchecked; you will add branding to Hyperbola a bit later.
That’s it. Click Finish to create your first Eclipse RCP application. You may be prompted to change to the Plug-in Development perspective. This is an arrangement of views in the Eclipse development environment that is particularly useful for plug-in development. We suggest that you select Yes here.
When the wizard completes, your workspace contains a single project with the name org.eclipsercp.hyperbola, as shown in Figure 4-3. The project contains an src folder that contains the Java source files generated from the template by the New Project wizard.
Figure 4-3 Hello Hyperbola project structure

If you selected Yes to switch to the Plug-in Development perspective, your new plug-in is opened in a plug-in editor. The editor provides a comprehensive view of the various parts of the plug-in definition captured in different files such as plugin.xml, MANIFEST.MF, and build.properties. The plug-in editor works on all of these at once—you can edit all aspects of a plug-in in one place. Figure 4-4 shows the first page of the editor.
Figure 4-4 Hyperbola plug-in editor

Tip
If you close the plug-in editor and want it back, just double-click on the plugin.xml or MANIFEST.MF files, or use Open on the context menu for the files.
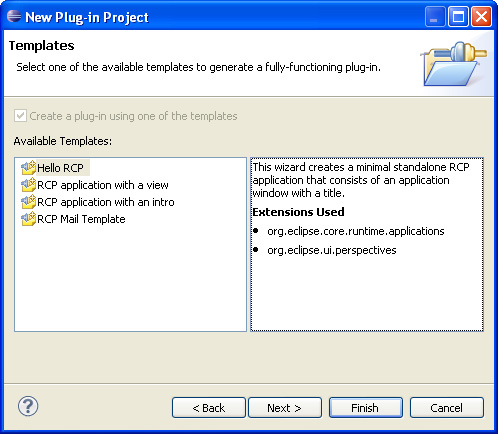
To take Hyperbola for a spin, use the links in the Testing section of the Overview page. Click on the Launch an Eclipse application link and run Hyperbola. This launches Hyperbola as a separate Eclipse RCP application in its own JVM. As you can see from Figure 4-5, it doesn’t do much, but it’s a start.
Figure 4-5 Simple Hyperbola shell
While the plug-in editor is open, take a look around. Along the bottom of the editor there are tabs for the different aspects of the plug-in. Go to the Dependencies page and notice that the Hyperbola plug-in depends on two other plug-ins: org.eclipse.core.runtime and org.eclipse.ui. This means that the Hyperbola plug-in can use classes exposed by those plug-ins. It also means that classes in other plug-ins are not available to Hyperbola. This control over class visibility is fundamental to the Eclipse notion of modularity and your ability to build systems from sets of plug-ins using Eclipse.
The Dependencies page also has some useful Dependency Analysis tools to help you navigate the dependencies between plug-ins, find unused dependencies, look for cycles, and other tasks.
What about Those Other Plug-ins?
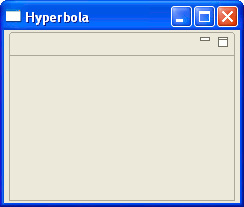
You may be asking, “What about JFace, SWT, and OSGi? I thought those were part of the RCP as well.” To find the answer, go to the Dependencies page in the Hyperbola plug-in editor and click on Show the plug-in in the dependency hierarchy in the Dependency Analysis section. You should see the hierarchy shown in Figure 4-6.
Figure 4-6 Hyperbola plug-in dependencies
Notice that some of the plug-ins under the Runtime and UI, for example, org.eclipse.swt, have little arrow decorations beside them. The arrows identify plug-ins that are reexported by their parents in the tree—org.eclipse.ui in the case of the SWT plug-in. As such, anyone depending on the UI automatically depends on the reexported SWT. Similarly, the UI reexports JFace and org.eclipse.ui.workbench and the Runtime reexports OSGi.
This dependency chaining mechanism is used wherever one plug-in exposes the API of another plug-in as part of its own API. For example, the UI API has classes and methods that name types found in SWT. To ensure that a plug-in requiring the UI gets a coherent dependency chain, the UI reexports SWT. Note that the UI does not reexport all of its prerequisites, just those it exposes as part of its API.
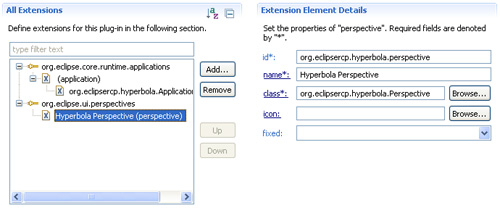
Take a look at Hyperbola’s Extensions page next. When PDE generated the Hyperbola skeleton, it added two extensions: an application and a perspective. If you poke around in here, you can see some of the values entered earlier as well as the names of various classes that were generated by the template.
These extensions are the mechanism for linking classes into the Eclipse infrastructure. For example, Figure 4-7 shows the Hyperbola Perspective extension. Notice how it lists the new perspective class (org.eclipsercp.hyperbola.Perspective) and links it into the org.eclipse.ui.perspectives extension point.
Figure 4-7 Hyperbola extensions
Take a look at the other pages in the editor if you like. If not, there will be plenty of opportunity to use them later. The next section walks through the generated code and highlights its structure. This is followed by a section on running and debugging Eclipse applications. Subsequent chapters build on this base and add more and more functionality.
4.2 Tour of the Code
Since the template did all the work of creating the code, you don’t really know what it’s doing. In this section we walk through the generated code and point out the interesting bits. In fact, all the generated code is included here—it’s pretty small.
4.2.1 Application
The RCP SDK target you are using contains only framework libraries; you can’t even run them. It’s like having a JRE installed—lots of great code, but it still needs to be told what to do. In regular Java systems, this is done by writing a class that has a main() method. In Eclipse, you write an application. An application is the entry point to a program or product. The application is run when the Runtime starts up, and when the application exits, Eclipse shuts down.
The PDE wizard used the Hello RCP template to generate the org.eclipsercp.hyperbola.Application application below. Applications must implement IApplication and thus a run() method. Think of this as your main() method.
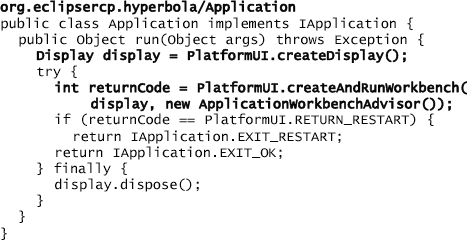
The critical code is marked in bold. The application creates a Display and then starts an Eclipse Workbench by calling PlatformUI.createAndRunWorkbench(Display, WorkbenchWindowAdvisor). This opens a window and simply loops forever, handling user-generated events such as mouse clicks, key presses, and mouse moves. The event loop finally returns when the last window is closed or when it is explicitly told to exit. Before returning from the application, the created Display must be disposed to free any allocated window system resources.
Note
You can do just about anything you want in your application. In our example we start up a UI, but you could just as well start a server of some sort. In other words, the Eclipse RCP can also be used for nongraphical applications.
The application class must be linked into the Eclipse Runtime’s applications extension point, as shown in Figure 4-7, thus making the Runtime aware of the application. Just as many Java JARs on a classpath may contribute classes that have a main() method, many Eclipse plug-ins in a system may contribute application extensions. In fact, one plug-in can contribute many applications. When Eclipse is started, one and only one application is identified as the application to run. Again, this is directly analogous to standard Java, where you specify exactly one class to run on the command line.
4.2.2 WorkbenchAdvisor
In the application code shown in the preceding section, we glossed over the ApplicationWorkbenchAdvisor that was instantiated and passed into PlatformUI.createAndRunWorkbench(). In fact, this is the most important part of the story.
As the name implies, a WorkbenchAdvisor tells the Workbench how to behave—how to draw, what to draw, and so forth. In particular, our ApplicationWorkbenchAdvisor identifies two things:
• The initial perspective to be shown
• The WorkbenchWindowAdvisor to be used

4.2.3 Perspective
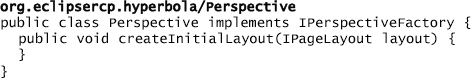
The initial perspective is identified by its extension identifier, as shown at the top right of Figure 4-7. The extension gives the perspective a human-readable name and specifies a class that defines the layout of the perspective. The given class must implement the IPerspectiveFactory interface and the createInitialLayout(IPageLayout) method. The org.eclipsercp.hyperbola.Perspective perspective is a trivial implementation that simply does nothing. This perspective is added in later chapters.
Note
As with applications, there may be many perspectives in the system. The application’s WorkbenchAdvisor identifies only one of these as the initial perspective. While a WorkbenchAdvisor must define an initial perspective, that setting can be overridden using preferences. This is detailed in Chapter 16, “Perspectives, Views, and Editors.”
4.2.4 WorkbenchWindowAdvisor
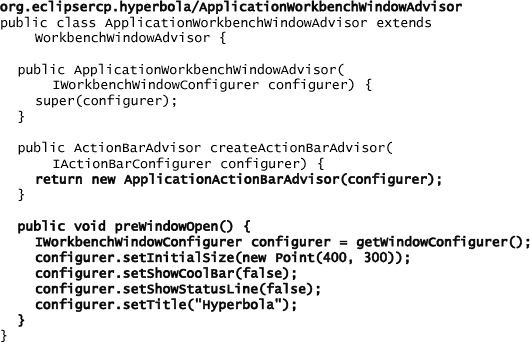
Every window in your application has a WorkbenchWindowAdvisor that guides the UI in rendering the window. Window advisors are consulted at various points in the lifecycle of a window (e.g., preWindowOpen() and postWindowCreate()) and have the opportunity to control the creation of the window’s contents. You will visit Hyperbola’s window advisor often as you update the look and feel of the application.
The ApplicationWorkbenchWindowAdvisor customizes Hyperbola windows. In the preWindowOpen() method, it sets the initial size and title of the window and hides the status line and toolbar. While we are looking at preWindowOpen(), go ahead and change the initial size of the window to make it a bit smaller than the default. Don’t forget to save the file when you are done.
4.2.5 ActionBarAdvisor
ActionBarAdvisors create the actions needed for a window and position them in the window. They are instantiated using createActionBarAdvisor() on WorkbenchWindowAdvisor. Since we are just starting out and have no actions, the ActionBarAdvisor is largely empty.
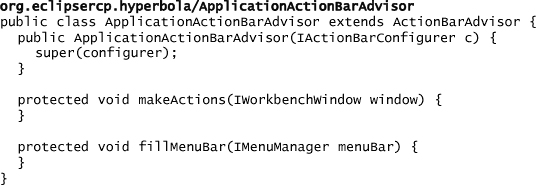
Note
The name ActionBarAdvisor does not do justice to this class. It actually controls what appears in the menu bar, the cool bar (also known as the toolbar), and the status line. As such, it is a focal point of customization in RCP applications.
4.2.6 Summary
That’s it. You have seen all the code involved in creating the simple Hyperbola RCP application. Just to be sure you got all the steps right, use the Samples Manager detailed in Chapter 3, “Tutorial Introduction,” to compare your workspace to the sample code for this chapter—they should be identical (except for possible formatting differences).
Of course the application does not do much; it doesn’t even have any actions—nor does it have any branding or splash screens. Nonetheless, the example shows how the major parts of the Eclipse RCP fit together.
4.3 Running and Debugging
By this point you have set up a development environment and target platform, defined a simple Hyperbola application, and run it at least once. You have also seen how applications, perspectives, and advisors fit together to form a system. You are now ready to start putting some real functionality into Hyperbola.
Before doing that, it is worth spending a bit of time talking about how to run and debug Eclipse applications effectively. In this section we show you how to
• Launch applications in debug mode
• Set breakpoints and step through code
• Manage targets, launch configurations, and control the set of plug-ins used
If you have been following along, Figure 4-8 matches your system. It shows the relationships between the IDE install you are running, the workspace in which you are developing, and the target plug-ins you are using for Hyperbola. The IDE plug-ins (bottom left) are the ones in c:ide. They are the full Eclipse SDK. Running them starts the Eclipse IDE (top left of the diagram). Using the IDE, you work on plug-in projects that are in the workspace (center). When you decide to try running Hyperbola, PDE creates and launches a configuration that lists the relevant plug-ins from the target (bottom right) and the workspace. The result is a running Hyperbola (top right).
Figure 4-8 Relationships among IDE, target, and workspace
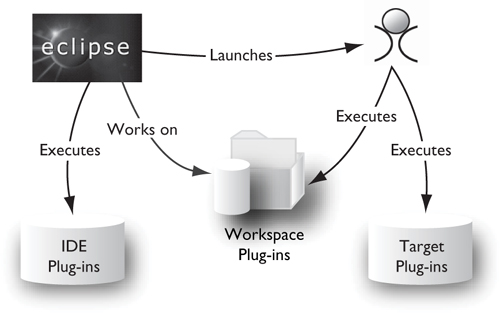
When the concerns are separated in this way, the IDE install can be replaced without affecting the workspace or the target. Similarly, the target plug-ins can be updated without changing the workspace or IDE. Of course, several workspaces can use the same target.
4.3.1 Debugging
Previously you ran Hyperbola using the Launch link in the Testing section on the Overview page of the plug-in editor. You may have noticed that there is also a Debug link. Go ahead and click on that link now. As with launching, debugging spawns a separate JVM to run the application. The difference is that the Debug perspective opens and shows a list of threads in the target application. Exit the application and the threads all terminate.
The debugger is useful when things are not going as you expected. Say, for example, you are getting a NullPointerException. To illustrate, set up that scenario by changing ApplicationWorkbenchWindowAdvisor.preWindowOpen() to simulate null coming back from getWindowConfigurer():
![]()
With the code changed, click on the normal Launch link in the plug-in editor. All you see is an exception reported in the console as shown next—Hyperbola does not start:
Unhandled event loop exception
Reason:
java.lang.NullPointerException
To find out more, add a breakpoint on the exception by using Run > Add Java Exception Breakpoint... and selecting NullPointerException in the type chooser.
Tip
The filter in the type chooser takes wildcards. So, to get NullPointerException, just open the chooser and type null. Keep typing until the list of choices is refined enough for you to see the type you want.
Now launch using the Debug link in the editor. Click Yes when prompted to open the Debug perspective. When the debugger opens, the main thread is paused at the line where the exception occurred, as shown in Figure 4-9.
Figure 4-9 Debugging using breakpoints
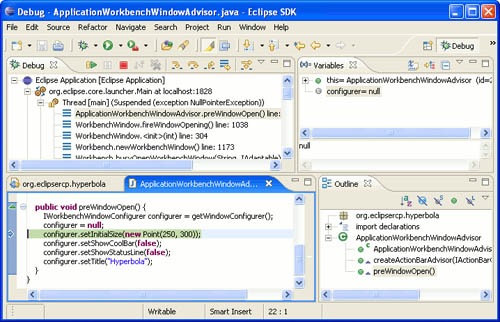
The execution of the main thread has stopped in preWindowOpen() on the line highlighted. The debugger also contains a Variables view. This view shows the values of all known fields and variables for a given Java stack frame. You can navigate around the object structure by expanding the object tree along the reference paths that interest you.
Tip
Using the Variables view to examine object structures can be extremely informative. Note also that you can typically change the values of the variables and fields you find along the way!
Looking at the line of code and the Variables view, it is easy to see that the configurer field is null and to find the cause of the exception. This is the first step. Now you have to figure out why configurer is null (ignoring, of course, the fact that it is set to null on the previous line). One easy way to do this is to set a breakpoint on the first line of this method and then step through the code to find out how the null value is set.
To set a breakpoint, position the text cursor on the line you want and use Run > Toggle Line Breakpoint. Alternatively, you can double-click in the margin at the left of the line. Either way, a blue ball should appear at the left of the line, as shown in Figure 4-10.

Terminate the current run using either Run > Terminate or by clicking on the red square button over the list of threads. Then launch again using the Debug link. This time execution stops at your new breakpoint. From here you can use the stepping functions described in Table 4-1 to go into getWindowConfigurer() and see what is going on.
Table 4-1 Debugger Stepping Functions

Tip
Stepping through code is sometimes bewildering, but it can be an effective way of finding out what the system is doing and discovering API and coding patterns that are useful in your applications.
The editor’s context menu has a number of other step functions such as stepping into and running up to a selected line of code, and the debugger supports conditional breakpoints. The functions described here should be enough for you to handle most problems.
4.3.2 Launch Configurations
Launching using the links in the Testing section of the plug-in editor is easy and convenient. Since you are likely to spend a lot of time running and debugging Hyperbola in the next chapters, here we show you some tricks to make things easier.
Whenever you click on a test link, PDE manages a launch configuration describing the configuration to run. You can look at this launch configuration using either Run > Run... or Run > Debug.... Either way, you get a launch configuration dialog as shown in Figure 4-11.
Figure 4-11 Launch configuration dialog
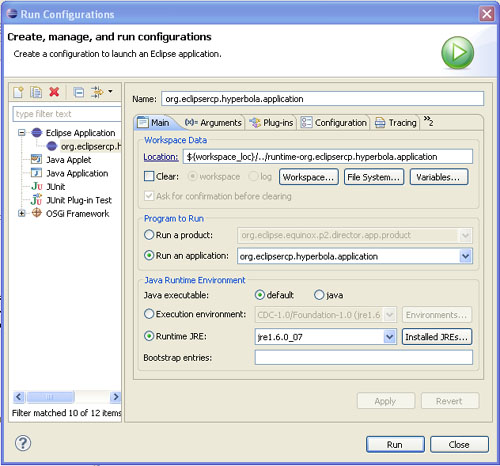
The Main tab is the most interesting at this point. It has the following parts:
• The Name of the launch configuration is currently org.eclipsercp.hyperbola.
• The Workspace Data section shows where the target Eclipse puts its workspace or instance data. Since we are running Hyperbola, there isn’t any data to worry about. In general, you do not need to change this location, but you may need to know where it is. This is where Eclipse stores some preferences and plug-in-specific information. This is also where you can find the log file if something should go wrong. Look in .metadata/.log in the workspace location if you suspect errors are occurring.
• The Program to Run section identifies the Hyperbola application, org.eclipsercp.hyperbola.application, to run. Click on the drop-down arrow and take a look at the other applications known by the system.
• The Java Runtime Environment area allows you to choose a JRE to use as well as set up any command-line arguments. There are quite a number of possible command-line arguments, all of which are detailed in the online documentation. Perhaps the most interesting one for debug purposes is the -consoleLog program argument. This causes all log output to be echoed to the console. This helps because often messages are being logged but go unnoticed unless you check the log. When you use -consoleLog, these messages are somewhat more “in your face.”
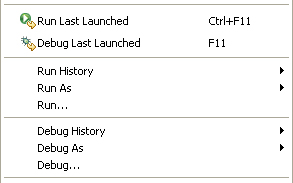
Now that you know about launch configurations, you can run and debug your applications directly rather than using the links on the plug-in editor’s Overview page. As shown in Figure 4-12, the Run menu has a host of entries to help.
Figure 4-12 Launching entries in the Run menu
The context menu in the Package Explorer also has Run As and Debug As entries. When you pick one of these entries and specify Eclipse Application, it is equivalent to using the Run and Debug links in the plug-in editor. PDE finds or creates a launch configuration to match your selection and then launches it.
As you can see, there are several more tabs on the dialog. For now, these are not needed. PDE is pretty good at managing things for you in this relatively simple world. As we make Hyperbola more and more sophisticated, there will be opportunities for you to use the other tabs, in particular, the Plug-ins tab.
4.4 Summary
So that was easy. Once set up, Eclipse and PDE greatly simplify the creation and running of applications. Even the generated code for the application is simple. We have now covered all the major concepts, classes, tools, and techniques you need to develop the rest of Hyperbola. The rest of the book builds on this base until we have a very sophisticated, fully extensible chat client that can be deployed in a wide range of execution environments. You wouldn’t think it to look at the current Hyperbola shell, but it’s true. The RCP part is easy; it’s your domain that is hard.
4.5 Pointers
• The Eclipse Wiki (http://wiki.eclipse.org/) contains a breadth of Eclipse knowledge. Feel free to contribute once you become an expert!
• The Eclipse Tutorial site (http://eclipsetutorial.sourceforge.net/) has many useful videos to get you started with Eclipse development.