
7
International Trade Theories and Applications
LEARNING OBJECTIVES
After going through this chapter, you should be able to:
Explain international trade and the classical trade theories
Compare and contrast the theory of absolute advantage and comparative advantage
Relate the importance of the product life-cycle theory with the study of international economics
Review recent trends in world trade
Exporting Ethiopian Roses
Ethiopia adopted a structural adjustment programme in 1991 with a change of government and launched extensive reforms to transform its command economy to a market-oriented economy. In the mid-1990s, the Ethiopian government announced its development vision, known as agricultural development–led industrialization policy (ADLI), and adopted an export promotion strategy in 1998, which listed the manufacturing and agro industries as priority sectors. Although Ethiopia's traditional export structure is still based mainly on agricultural products, there has been a diversification to non-traditional exports in order to reap the benefits of competitiveness. The flower industry is a particularly successful diversification for Ethiopia.
Ethiopia is endowed with ideal conditions for a successful floriculture industry, including flat land at high altitudes, a cool climate, low-cost labour, proximity to major markets, and to an international airport. The emergence of the flower industry in Ethiopia was possible due to the efforts of domestic entrepreneurs, who were the first movers into hitherto uncharted territory in the early 1980s. The earliest entrants into the commercial floriculture industry were two firms—Meskel Flowers Plc and Ethio Flora Plc. Both of them produced flowers such as alliums, statice and carnations for export to the markets of the European Union (EU). Initial production was supported by the EU, which encouraged them to employ consultants from Kenya and the United Kingdom. Although these two firms were unable to continue with the export of flowers, they contributed to the initial accumulation of industry knowledge and paved the way for future entrants.
In the early experimentation stages, entrepreneurs encountered various obstacles beginning with the lack of programmes for the floriculture industry in the industrial policy of Ethiopia. There was also a lack of reliable and cheap air cargo. For example, in the early years, air-cargo space was only available on passenger flights operated by Ethiopian Airlines (EAL) and Lufthansa. Availability of finance was another problem since the industry is capital-intensive and start-up investment involved considerable fixed assets. Availability of land was also another major issue and private investors were forced to lease it from small farmers. This was a slow process that required consolidation of several small contiguous holdings. Hence, despite the potential and basic know-how necessary for the floriculture industry being present, the industry started flourishing only in the early 2000s.
Foreign firms in the form of joint ventures or 100 per cent ownership entered the scene only after 2003, after which, the industry experienced a phase of high growth. The large flow of foreign-owned firms helped to “scale-up” the Ethiopian flower industry in terms of both export quantity and firm population and also diversification of activities and transfer of knowledge.
In 2003, there were only five farms engaged in the production and export of flowers. However, by 2008, the number increased to 81 farms employing 50,000 workers, of which over 70 per cent were women. The post-2003 period was characterized by the increasing entry of firms and spectacular growth in exports, with the average annual growth in number of firms and exports from 2003 to 2008 being around 380 per cent and 638 per cent, respectively. Since 2007, Ethiopia has been Africa's second largest flower exporter after Kenya, and the industry is one of the top four sources of foreign exchange for the country. This has left Kenya stunned as it took Ethiopia five years to achieve half of what Kenya did in three decades.
Source: Information from Mulu Gebreeyesus and Michiko Iizuka, “Discovery of the Flower Industry in Ethiopia: Experimentation and Coordination”, UNU-MERIT Working Paper Series, United Nations University, Report no. 2010-025, 2010, available at http://www.merit.unu.edu/publications/wppdf/2010/wp2010-025.pdf, last accessed on 3 September 2011.
INTRODUCTION
International trade is the exchange of goods and services across borders. It is as old as human history. The earliest records of trade were through the land and sea routes which connected the first civilizations in Mesopotamia and around the Mediterranean. The Phoenicians of the eastern Mediterranean region traded metals, cedar wood, cloth, and animals across the sea as early as 3000 BC. One of the most important land routes was the Silk Road, connecting China in the East with the Roman Empire in the West. Silks, gemstones, perfumes, and other luxury goods were carried along this route from 300 BC onwards, providing a direct link between two of the major civilizations of the world. The European end of this route was controlled first by Constantinople (Istanbul) and then by the cities of northern Italy, particularly Venice, which grew rich on the proceeds of this trade.
In the fifteenth and sixteenth centuries, the development of sea-going vessels and advances in navigation by the Portuguese and Spanish led to a vast increase in world trade, as European merchants sought out new markets in Africa and Asia and brought back rare spices and other exotic goods. All the major European nations set up trading posts around the world, which grew into colonies and eventually, between the sixteenth and nineteenth centuries, developed into land-based empires many times the size of their parent countries.
During the eighteenth and nineteenth centuries, the Industrial Revolution transformed the British economy into the richest in the world. New factories manufacturing cotton and other goods sprang up throughout the country, requiring raw materials from overseas to keep them supplied. This led to a vast increase in world trade and established Britain as the world's largest trading nation. The development of railways and steam ships enabled goods to be transported around the world in a fraction of the time achieved by sailing ships.
A century later, most of Europe and North America were industrialized, leading to the dominance of the world economy by a few key nations. Until the middle of the twentieth century, trade was mainly in primary products, but today it is dominated by the import and export of secondary and tertiary products between industrialized nations.
Trade is the business of buying and selling goods or products in order to make a profit. Trade can be conducted within a country, or internationally between nations. Goods or services sold by one country or region to another are exports, while those brought into a country or region are imports. All sorts of commodities can be traded, from a small quantity of a precious metal such as gold to a supertanker full of oil. Trade products fall into three main categories: (1) primary products, (2) secondary products, and (3) tertiary products. Primary products are natural resources, such as tin, wood, grain, and fish, obtained from mining, forestry, agriculture, and fishing; secondary products are manufactured from primary products, and include cars, computers, ships, and clothes; and tertiary products are services provided by banks, insurance companies, law firms, and other professional organizations.
Nations trade with one another for two main reasons: (1) to earn money to buy things they need, and (2) to enrich their national economies by providing jobs and a better standard of living for their citizens. Trade allows individual countries to specialize in the goods that they best produce, exporting those items in order to earn money to buy goods that are produced more cheaply elsewhere, or which they cannot produce themselves.
For trade to be conducted, two essentials must be in place—a source of supply in one country to produce and sell goods, and a demand from another country to buy them. This balance between supply and demand is not even throughout the world, and creates difficulties for poorer countries. Many poor countries need items such as lorries, computers, telephone systems, and medical equipment in order to develop their economies and feed their growing populations. Few have substantial manufacturing industries of their own, and, therefore, need to buy most secondary and tertiary products from abroad. Paying for these expensive imports is difficult, since many of the world's poorest nations rely heavily on just one primary product. For example, the island nation of St Lucia in the Caribbean depends heavily on one cash crop, that is, bananas, while Zambia relies on the export of copper. If the crop fails or the price of the mineral drops, the economies of these nations suffer. As a result, many primary-producing nations import far more goods than they export, leading to a trade deficit with the rest of the world. Conversely, most secondary- and tertiary-producing nations maintain healthy trade surpluses.
Industrialized countries such as members of the EU and the United States have an export structure which is primarily technology-intensive (for example, PCs), or knowledge-intensive (for example, software), or capital-intensive (for example, construction machinery and equipment), or a combination of all of these (for example, telecom products, pharmaceuticals, airplanes, and automobiles). The export structure of developing countries, on the other hand, consists of primary products, such as cocoa from Ghana and bananas from countries of Latin America.
The process of economic development of nations requires a shift from producing simple goods based on traditional activities to complex goods applying new technologies and methods. It is often referred to as structural transformation.1 Trade has an important role to play in this regard. Exports are the main source of foreign exchange, economies of scale and specialization, and technology in developing countries.2 Production for the global market provides opportunities for further learning as we saw in the opening vignette. Due to the relationship between export success and the economic performance of nations, developing countries are diversifying into high-value, non-traditional exports, further leading to structural transformation.
Sub-Saharan Africa in the developing world region has the highest dependence on exports of traditional primary products.3 Although diversification into non-traditional, high-value exports is advocated as an alternative export-promotion strategy, the performance of the sub-continent has been generally unsatisfactory. The United Nations Economic Commission for Africa (UNECA) and the African Union (AU) have pointed out that since the early 1980s, Sub-Saharan Africa's diversification record has been volatile, and gains fragile and short-lived. However, in recent years, a few countries in the region (for example, Kenya, South Africa, Uganda, Côte d'Ivoire, Ethiopia, Ghana, and Zambia) have made some progress in diversifying into non-traditional horticultural products for export.
INTERNATIONAL TRADE THEORIES
The various theories on international trade explain why export structures vary across countries, why nations do not mimic each other, and why they have different vulnerabilities to trade conditions.
Mercantilist Doctrine
The earliest explanation of international trade, known as the mercantilist doctrine, emerged in England in the middle of the sixteenth century and was the foundation of economic thought from about 1500 to 1800. It was the period of the emergence of the nation state and a lessening allegiance towards city states, religions, and guilds. The purpose of trade at this time was the accumulation of a surplus to fund the conquests of these emerging national powers. In order to achieve this, trade was monopolized by the government, which subsidized exports and restricted imports. Since most European countries at that time were colonial powers, they imported low-cost raw materials from their colonies all over the world and exported finished manufactured goods to them. Although the influence of mercantilist philosophy weakened after 1800, the large home-based companies of Europe had technological leadership, ownership of raw-material production abroad and some degree of protection from foreign competition. This combination continued to make colonies dependent on raw-material production and to tie their trade to their industrialized mother countries.
The mercantilist doctrine, which is the earliest explanation of international trade, explains trade between nations to be motivated by a nation's desire to amass gold for funding its global expansion.
According to mercantilist thought, the government had two goals in foreign economic policy. The first goal was to increase the wealth of the nation by acquiring gold. Mercantilists identified national wealth with the size of a nation's reserves of precious metals, which could then be used to hire mercenary armies. The second policy goal was to extract trade gains from foreigners through regulations and controls to achieve a surplus in the balance of trade by maximizing exports and minimizing imports.
In the modern economy, however, gold reserves are merely potential claims against real goods on foreigners. Besides this, as demonstrated by David Hume4 in 1752, an influx of gold would increase the domestic price level and boost the price of exports, causing the country holding the gold balance to lose the competitive edge that had enabled its initial accumulation. In contrast to this, the loss of gold in the foreign nation would reduce prices there and reinforce its exports. Today, gold reserves represent a minor portion of national foreign exchange reserves and are used by governments to intervene in foreign exchange markets, for example, selling some of these reserves in exchange for local currencies in order to influence foreign exchange rates.
The theory of mercantilism also took no notice of the other sources of a country's wealth accumulation, such as the quantity of its capital, the skill of its workforce, and the strength of other production inputs including land and natural resources. It has now been understood that a country's wealth is accumulated mainly through superior competitiveness, which is, in turn, determined not only by the abundance of resources, but also by national policies, industrial structure, firm efficiency, and individual productivity.
Classical Approach
The classical approach refuted the basic mercantilist notion of precious metals and gold as the source of a nation's wealth. It propounded that domestic production was the prime source of a nation's wealth. Hence, productive efficiency was considered the motivating factor behind trade. The classical approach is known for two famous theories given by economists Adam Smith and David Ricardo. They are the theory of absolute advantage and the theory of comparative advantage.
The classical approach propounded that domestic production was the prime source of a nation's wealth. Hence, productive efficiency was considered the motivating factor behind trade. The theories of comparative advantage and absolute advantage are its two variants, which explain trade between nations to be the consequence of their advantage in the possession of resources.
Theory of Absolute Advantage
Adam Smith introduced the doctrine of laissez-faire to international trade in 1776 through his famous book An Inquiry into the Nature and Causes of the Wealth of Nations.5 Laissez-faire literally means “let make freely” or, more generally, “freedom of enterprise and freedom of commerce”. Smith's basic criticism against mercantilism was that it regarded trade as a zero-sum game (a situation in which one country's gain equals another one's loss). According to him, trade was not a zero-sum game but a positive-sum game in which all countries can benefit. He explained this through the use of the concept of absolute advantage which permits individual countries to specialize in the export of goods they are best suited to produce because of natural and acquired advantages. Smith's theory of trade is, therefore, known as the theory of absolute advantage. This theory stated that a nation's imports should consist of goods made more efficiently abroad, while exports should consist of goods made more efficiently at home. A country has an absolute advantage in the production of a product when it is more efficient than any other country in producing it. According to this theory, India should export cotton, in which it has an absolute advantage at home, and import coffee from Brazil, which has an absolute advantage in its production.
According to Smith, a country's absolute advantage stems from two sources:
- Natural advantages: A country may have a natural advantage in producing a product because of climatic conditions, access to certain natural resources, or availability of cheap or skilled labour. Thus, India's climate and land type support the production of cotton, whereas the climate and land conditions in Brazil support the production of coffee. Producing wheat in Brazil and coffee in India may be possible but at a far greater cost than incurred while importing them.
- Acquired advantages: Most of the world trade today is in manufactured goods and services rather than agricultural goods and natural resources. Countries that produce manufactured goods and services competitively have an acquired advantage, usually in either product or process technology. An advantage of product technology is that it enables a country to produce a unique product or one that is easily distinguished from those of its competitors. For example, Indian exports of brass items are distinguished for their craftsmanship and quality all over the world. The Indian advantage in brass is rooted in tradition and history, and the craftsmanship has been polished to perfection over centuries.
The absolute advantage theory holds that the market functions efficiently without any intervention by the government. Government intervention in the form of tariff and non-tariff barriers is likely to be counterproductive and lead the market to distorted results. According to this theory, the benefit to a nation stems from the costs saved in importing goods that would otherwise be domestically produced. Unlike the mercantilist doctrine which says that a nation could only gain from trade if the trading partner lost (zero-sum game), the absolute advantage theory argues that both countries would gain from the efficient allocation of national resources globally.
Figure 7.1 provides a simple illustration of how a country gains from free trade. Let us assume that two countries, Brazil and India, have the same amount of resources and these can be used to produce either cotton or coffee. If 100 units of resources are available, we further assume that it takes Brazil four units of resources to produce one tonne of coffee and 10 units of resources to produce one tonne of cotton. Thus, Brazil could produce 25 tonnes of coffee and no cotton, or 10 tonnes of cotton and no coffee, or some combination between these two. The different combinations that Brazil could produce are Brazil's production possibility frontier (PPF). Similarly, we assume that India uses 20 units of resources to produce one tonne of coffee and five units of resources to produce one tonne of cotton. India could, thus, produce five tonnes of coffee and no cotton or 20 tonnes of cotton and no coffee, or some combination between these two. The different combinations available to India are India's PPF. This indicates that Brazil has an absolute advantage in producing coffee, whereas India has an absolute advantage in producing cotton. Therefore, Brazil should specialize in the production of coffee and India should specialize in the production of cotton. According to Adam Smith, in a situation such as this, both countries benefit from specialization and trade. World production would increase if both countries specialized in the production of the goods in which they have an absolute advantage and then traded to obtain the other goods in which they have an absolute disadvantage.
Figure 7.1 Production Possibilities with Absolute Advantage

What happens if the two countries do not trade with each other? Taking into account the resources at their disposal, each would then devote half the resources for the production of coffee and half for the production of cotton. Brazil would then produce 12.5 tonnes of coffee and five tonnes of cotton and India would produce 10 tonnes of cotton and 2.5 tonnes of coffee, as depicted in Table 7.1. Without trade, the combined production of both countries would be 15 tonnes of coffee (12.5 + 2.5) and 15 tonnes of cotton (5 + 10). Points A and B in Figure 7.1 are measures of the output of Brazil and India when they do not trade with each other. If each country produced only that commodity in which it has an absolute advantage, Brazil would produce 25 tonnes of coffee and India would produce 20 tonnes of cotton, as depicted in Table 7.2. Total global production as a result of trade would be 45 tonnes of output as against 30 tonnes of output in the absence of trade; a net benefit of 15 tonnes of output to the world economy.
Theory of Comparative Advantage
The absolute advantage theory explained trade as an advantageous situation for two countries which were differently endowed in the production of goods, that is, it considered trade as the outcome where one country is more efficient than another in producing specific goods. It did not look at the real possibility of one country being more efficient in the production of both tradable commodities. This question was answered by David Ricardo, a nineteenth-century English economist, in his landmark book, On the Principles of Political Economy and Taxation, first published in 1817.6 He stated that both countries would continue to gain from trade even if one were more efficient in all goods, since it is the comparative advantage of a nation in producing a good relative to another nation that determined international trade flows. This is illustrated in Figure 7.2. Continuing with the example given in the preceding section, let us assume that India is more efficient in the production of both coffee and cotton. Brazil requires 10 units of resources to produce one tonne of coffee and 10 units to produce a tonne of cotton, whereas it takes India only five units of resources to produce a tonne of coffee and four units to produce a tonne of cotton. Assuming further that there is no trade between these countries, each will use half its resources for the production of coffee and half for the production of cotton. Thus, without trade, Brazil will produce five tonnes of coffee and five tonnes of cotton (Point A in Figure 7.2), while India will produce 10 tonnes of coffee and 12.5 tonnes of cotton (Point B in Figure 7.2), as depicted in Table 7.3. In the absence of trade, total world output will be 32.5 tonnes, out of which 10 tonnes is contributed by the Brazilian economy and 22.5 tonnes comes from India. The combined production of coffee will be 15 tonnes (5 + 10) and of cotton will be 17.5 tonnes (5 + 12.5).
Table 7.1 World Output Without Trade
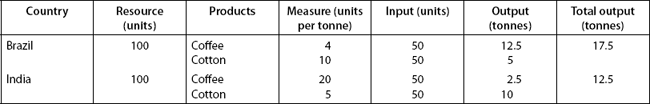
Table 7.2 World Output with Trade

Figure 7.2 Production Possibilities with Comparative Advantage

Hence, India has an advantage in the production of both coffee and cotton and produces more of both commodities as compared to Brazil. However, it has a comparative advantage in the production of cotton, since it produces 2.5 times more cotton, while in the case of coffee, it can only produce twice as much coffee.
To understand the benefits from trade in such a situation, we introduce the concept of opportunity cost. The opportunity cost of a commodity X is the amount of other goods which have to be given up in order to be able to produce one unit of X. A country has a comparative advantage in producing a product if the opportunity cost for producing it is lower at home than in a foreign country. Thus, the lower the opportunity cost, the higher is the comparative advantage. Table 7.4 shows the opportunity costs for producing coffee and cotton in Brazil and India, based on the information given in Figure 7.2.
Table 7.3 India's Comparative Advantage Without Trade

Table 7.4 Opportunity Costs of Coffee and Cotton
| Country | Coffee | Cotton |
| Brazil | 10/10 = 1 | 10/10 = 1 |
| India | 5/4 = 1.25 | 4/5 = 0.8 |
Table 7.5 World Output with Trade Between India and Brazil

Table 7.4 shows that Brazil has the lower opportunity cost of the two countries in producing coffee, while India has the lower opportunity cost in producing cotton. Thus, Brazil has a comparative advantage in the production of coffee and India has a comparative advantage in the production of cotton. Therefore, as indicated by Table 7.5, once trade between the two countries is launched, Brazil will export coffee and import cotton. India, on the other hand, will export cotton and import coffee. With trade, India produces 25 units of coffee and Brazil produces 10 units of cotton, with a total output of 35 units.
As long as the opportunity costs for the same commodities differ between countries, open trade will result in gains for each country through specialization in producing a commodity (or commodities) in which a country has comparative advantage vis-à-vis its trading partner(s).
A nation has several sources of comparative advantage. The immediate difference arises out of differences in the cost of production, which is reflected in the form of a price difference. A price differential is the result of differences in demand conditions, supply conditions, or both. On the demand side, differences in tastes and incomes will cause differences in patterns of demand, and, hence, prices. However, when two countries share similar income levels and consumer tastes, income is unlikely to be a major source of demand differences. Similarly, differences in tastes are unlikely to account for significant demand differences, and, thus, for trade between countries belonging to the same sociocultural matrix. On the supply side, differences in supply patterns result from differences in the patterns of production costs.
The classical theory of international trade has quite a few drawbacks. They are:
- The explanation is based only on labour as a factor of production. In the real world, all other factors of production also play a decisive role in production.
- The theory does not consider differences in transportation cost.
- Classical economists also assumed that resources are mobile domestically and immobile internationally. However, labour may be immobile within the domestic economy, especially if the job is highly technical. In the modern context, outsourcing has made labour mobile internationally, since the skill embodied in it is employed offshore even if labour in the physical sense does not cross geographical boundaries.
- The theory is based on a static assumption of a fixed stock of resources and that free trade does not change the efficiency with which a country uses its resources.
Thus, in today's world economy, comparative advantage must be explained by reference to differences in comparative production cost, which further depends on the commodity's production process (especially the state of technology), and on the prices of production factors such as labour, land, capital, and natural resources. Factor prices, in turn, are related to the availability of those factors in the national economy. Economists refer to inputs to the production process as production factors. They then refer to conditions (availability and cost) of factors of production as the country's factor endowment. In today's global economy, the quality of the levels of production factors (for example, knowledge and productivity of workers, or service and efficiency of a banking sector) become even more important for improving a country's exports or attacking foreign investments. In today's international business environment, therefore, factor endowment should also include the quality of production factors. However, since inter-country differences in technology were relatively minor in the nineteenth century, international variations in comparative advantage were attributed primarily to different national endowments in terms of availability and cost. This provided the theoretical basis of the Heckscher–Ohlin theorem, also known as the factor proportions theory.
Factor Proportions Theory
The classical theories did not help to identify the types of products that would give a comparative advantage to a country. The Heckscher–Ohlin (H–O) theorem or factor proportions theory, developed by Swedish economists Eli Heckscher in 1919 and Bertil Ohlin in 1933, explains international trade as a link between national factor endowments and the comparative advantage of nations.7 The theory explains how a country's export is based on differences in the endowment of labour and capital. According to the theory, the cost of production of a country depends upon its factor endowments of labour and capital, in other words, the total cost of production depends on whether an economy is labour-intensive or capital-intensive.
The Heckscher–Ohlin theorem or factor proportions theory explains international trade as a link between national factor endowments and the comparative advantage of nations.
The basic assumptions of this theory are:
- Countries have different availability of factors of production, that is, they are differently endowed in terms of labour and capital.
- Each commodity has its own specific production function but the production function is identical everywhere in the world. The production function is an input–output function showing the relationship between output and capital and labour inputs, and the resultant output is identical for a particular commodity all over the world. This essentially implies that the same quality of input will produce the same output of a given commodity everywhere in the world.
- Technology is constant across the world. Therefore, technological differences have no role to play in a country's trade.
- Demand for factors of production is identical across the world; therefore, the cost of production is determined by its supply. It is the differences in the relative supply of a factor of production that lead to a difference in its price. Thus, the cost of production of a commodity is determined by whether production in the economy is labour-intensive or capital-intensive.
According to the factor proportions theory, the comparative advantage of nations is a result of differences in its basic economic structure. A country is relatively more efficient in the production of those commodities which are suited to its economic structure on the basis of its factor endowments. This implies that if an economy has more labour in comparison to land and capital, its labour costs would be relatively low compared to land and capital costs. On the other hand, if labour was the scarce factor, labour costs would be high in comparison to land and capital costs. These relative factor costs would lead countries to excel in the production and export of products that used their abundant, and, therefore, cheaper production factors.
The theorem states that a country has a comparative advantage in commodities whose production is intensive in its relatively abundant factor, and will, therefore, export those commodities. Meanwhile, a country would import commodities whose production is intensive in the country's relatively scarce factor of production. Thus, differences in comparative advantage are attributed to the differences in the structure of the economy.
A country is relatively more efficient in those activities that are better suited to its economic structure and does best with what it has in abundance. For example, the United States has abundant capital in comparison to labour. Hence, it exports capital-intensive commodities such as motor vehicles, whose production requires a greater use of capital than other products, and imports labour-intensive commodities, such as clothing.
The theorem also postulates that there will be an international equalization of the prices of production factors under free trade, the so-called Heckscher–Ohlin law of factor price equalization. It states that the exchange of goods between agricultural and industrial countries will result in an increase in the relatively low levels of land rents and a decline in the high level of industrial wages in agricultural countries. In the industrial countries, the opposite change is likely to take place—an increase in industrial wages and a decrease in land rents.
The implications of the H–O theorem for world trade are as follows:
- Trade as well as trade gains should be greatest between countries with the greatest differences in economic structure.
- Trade would result in countries specializing, producing and exporting goods that are distinctly different from their imports.
- Trade policy should take the form of trade restrictions rather than trade stimulation.
- Countries should export goods that make intensive use of their relatively abundant factors.
- Free trade should equalize factor prices between countries with fairly similar relative factor endowments but not between countries with distinctly different endowments.
- Factor prices should be nearly equal between countries with more liberal mutual trade.
Leontief Paradox
The basic assumption of the H–O theorem is that a country exports goods that make intensive use of its abundant factor and imports goods that make intensive use of its scarce factor. This proposition was tested in 1953 by Wassily Leontief, the 1973 winner of the Nobel Prize in Economics, in the context of the United States. As per the H–O theorem, the US trade structure should have capital-intensive exports and labour-intensive imports. Testing this on a data base using input–output tables covering 200 industries and 1,947 trade figures, he found, however, that US exports were labour-intensive and its imports were capital-intensive. Since this result contradicted the predictions of the H–O theorem, these findings came to be known as the Leontief paradox.8 The Leontief study motivated further empirical research, which has shown many paradoxical results and contains serious challenges to the general applicability of a factor-endowments explanation in other countries, such as Germany, India, Canada, and Japan.
The Leontief paradox contradicted the findings of the H–O theorem by discovering that US exports are labour-intensive and imports are capital-intensive even though capital is its abundance factor and labour is its scarce factor.
Some of the issues raised by the Leontief paradox were:
- Demand bias for capital-intensive goods: The US demand for capital-intensive goods is so strong that it reverses the US comparative cost advantage in such goods.
- Existence of trade barriers: US labour-intensive imports were reduced by trade barriers (for example, tariffs and quotas) imposed to protect and save American jobs.
- Importance of natural resources: Leontief considered only capital and labour inputs, leaving out natural resources inputs. Since natural resources and capital are often used together in production, a country that imports capital-intensive goods may be actually importing natural resource–intensive goods. For example, the United States imports crude oil, which is capital-intensive.
- Factor-intensity reversals: A factor-intensity reversal occurs when the relative prices of labour and capital change over time, which changes the relative mix of capital and labour in the production process of a commodity from being capital-intensive to labour-intensive or vice versa.
Linder's Income-preference Similarity Theory
Since the 1970s, trends in the actual pattern of international trade indicate that three fourths of total world exports originate in the developed world, with increasing trade volumes between countries of the developed world. This contradicts the basic tenets of the H–O theorem, according to which trade should originate among nations which have different factor endowments. This means that trade would take place in larger part between developed manufacturing countries and developing countries producing primary products (natural resource commodities such as oil and petroleum) and labour-intensive goods.
Staffan B. Linder's income-preference similarity theory attempts to explain this contrary phenomenon. According to this theory, the world of international trade can be divided into two categories: primary products (natural resource products) and manufactured goods.9 Linder discovered that differences in factor endowments can explain trade in natural resource–intensive products, but not in manufactured goods. According to him, a country's manufactured exports are mainly determined by internal demand. International trade in manufactured goods takes place largely among developed nations because there is a strong domestic demand for these goods and a country will only export those goods which it manufactures at home.
Linder also found that trade intensity between nations can be explained by similarities in demand for manufactured goods between nations. Therefore, according to the income-preference similarity theory, the more similar the demand preference for manufactured goods in two countries, the more intensive is the potential trade between them. If two countries have the same or similar demand structures, then their consumers and investors will demand the same goods with similar degrees of quality and sophistication, a phenomenon known as preference similarity. This similarity boosts trade between the two industrialized countries.
According to the income-preference similarity theory, the more similar the demand preferences for manufactured goods in two countries, the more intensive is the potential trade between them.
Average per capita income was among the most important determinants of demand, according to Linder. Countries with high per capita income will demand high-quality “luxury” consumer goods (for example, motor vehicles) and sophisticated capital goods (for example, telecommunications equipment and machinery), while low per capita income countries will demand low-quality “necessity” consumer goods (for example, bicycles) and less sophisticated capital goods (for example, food processing machinery). Consequently, a rich country that has a comparative advantage in the production of high-quality, advanced manufactured goods will find big export markets in other affluent countries, where people demand such products. Similarly, manufactured exports of the poorer countries will find their best markets in other poor countries with similar demand structures. Linder also acknowledged that the effect of per capita income levels on trade in manufactured goods can be constrained or distorted by entrepreneurial ignorance, cultural and political differences, transportation costs, and obstacles such as tariff barriers.
INTERNATIONAL BUSINESS IN ACTION | US–China Trade Accord
One of the historic moments of the year 2011 was the signing of a USD 45 billion export deal between the United States and China, which included a massive USD 19 billion contract for 200 Boeing aircraft, leading to the creation of 235,000 US jobs. Meanwhile, Chinese and US energy companies (led by General Electric) also signed several agreements, including a USD 7.5 billion deal between Alcoa Inc. and China Power Investment Corporation for a broad range of aluminium and energy projects, both inside and outside China, while General Electric (GE) Energy signed a joint venture with Shenhua Group Corporation Limited for clean coal technologies.
Creation of more jobs in the aftermath of the recession is high on the agenda of the US policy as almost 9 per cent of its workforce has been unemployed since the recession. China–US trade totals more than USD 400 billion annually. However, China's trading surplus is estimated to have reached USD 270 billion in 2010. Therefore, US efforts to narrow the trade gap with China are very important in the present context.
Numerous US companies are seeking to strengthen their foothold in China, one of the key ones being GE. The international conglomerate has signed a number of deals with China involving energy, rail and aviation manufacturing, hoping to boost its profits and save US jobs. A general grievance of US firms has been that their initial investments in China have proved difficult on account of Chinese government regulations favouring domestic firms, and weak protection of intellectual property laws. As part of the new trade agreements, China has promised a fair deal to foreign companies and permission to use imported technology.
With the new US–China trade accord, contentious issues such as the uncertainties and pressure politics of China's stealth aircraft, the patrolled waters of the east China sea, Obama's meeting with the Dalai Lama, the appreciation of the yuan, trade deficits, and the American sentiment against China's refusal to release Liu Xiaobo, a jailed Nobel peace-prize winner, have all been “brushed under the carpet”.
Source: Information from Voice of America, “China Agrees to $45 Billion in US Export Deals”, VOANews, 19 January 2011, available at http://www.voanews.com/english/news/Hu-Faces-Day-of-Rich-Ceremony-Tough-Talk-114193599.html, last accessed on 20 January 2010.
Human Skills and Technology-based Views
A basic drawback in conventional trade theories (theory of absolute and comparative advantage, H–O theorem, and Leontief paradox) was the assumption that technology and human skills were equivalent among nations. This led to a refinement of conventional theory through the addition of two new factors of production, namely, human skills and technology gaps, to the explanation of comparative advantage sources.
According to the human skills and technology-based view, human skills (now treated as capital) and technology are two additional factors of production that need to be taken into account while evaluating potential trade between countries.
Human skill theorists considered a nation's comparative advantage to arise out of the abundance of professional high-level human skills vested in scientists, engineers, technicians, draftsmen, managers, and skilled manual workers. According to this explanation, the relative abundance of professional and other highly skilled labour in the United States is a major source of its comparative advantage in manufacturing products. Advocated among others by D. B. Keesing,10 it postulates that the US export industries employ a higher proportion of highly skilled labour than other import-competing industries. Hence, their exports have a greater proportion of skill-intensive manufactured goods than other countries. Studies treating professional and skilled human resources as capital reversed the Leontief paradox and found that US exports were actually capital-intensive.
Technology theorists argued that certain countries have a special advantage as innovators of new products because of an imitation lag that prevented other countries from immediately duplicating the new products of the innovating country. These two conditions result in a technology gap in those products and gave the innovating country an export monopoly during the period of imitation lag. In other words, for the duration of the imitation gap, the innovator is the only exporter in world markets. Similarly, when a firm discovers a different and more advanced production technique, it will enjoy a cost advantage and dominate the world market for a while, especially if its innovation is legally protected from imitators by the international patent system. As long as technological progress is made, the technology gap would serve as a major source of comparative advantage. According to this view, technology is treated as a separate factor of production whose relative abundance or scarcity in a country determines its comparative advantage or disadvantage in technology-intensive products. This notion, despite being more than four decades old, still has strong implications for country competitiveness, competitive advantage of transnational corporations (TNCs), and global R&D management.
Product Life-cycle Theory
The product life-cycle model, given by Raymond Vernon in the mid-1960s, focused on the product and added knowledge as an independent variable in the decision of a firm to trade or invest.11
The product life-cycle model focuses on the product and added knowledge as an independent variable in the decision of a firm to trade or invest. The life span of a product has four stages: (1) introduction, (2) growth, (3) maturity, and (4) decline.
Using the same basic tools and assumptions as the factor proportions theory, Vernon added two technology-based premises to the factor cost emphasis of existing theory:
- Technical innovations leading to new and profitable products require large quantities of capital and highly skilled labour. These factors of production are predominantly available in highly industrialized capital-intensive industries.
- The same technical innovations, both the product itself and, more importantly, the methods for its manufacture, go through three stages of maturation as the product becomes increasingly commercialized. As the manufacturing process becomes more standardized and low skilled labour-intensive, the comparative advantage in its production and export shifts across countries.
Vernon's theory further developed the imitation-gap approach by suggesting that changes occur in the input requirements of a new product as it becomes established in a market and standardized in production. As the product cycle develops, the cost advantage can change accordingly, and a comparative advantage in innovative capacity may be offset by a cost disadvantage.
The theory used a four-stage model to explain the behaviour of US exports of manufactured goods. The model assumed that the ability of a firm to export, arising out of its product innovation ability, gets reduced due to technological diffusion and lower costs abroad. The life-cycle model includes the following four stages:
- Introduction: The domestic market (the United States in this case) has an export monopoly in a new product.
- Growth: Foreign production of this product begins.
- Maturity: Foreign production of this product becomes competitive in export markets.
- Decline: The exporter (the United States) now becomes an importer of this no-longer-new product.
The theory postulated that a technology-intensive new product is first produced in the domestic market because of the benefits of proximity to customers and suppliers. This gives the nation an edge over other competitors, and gives it an export monopoly. As the product design and production gets standardized, producers in other countries also begin to manufacture the product and the incumbent's export monopoly declines. Subsequently, one witnesses the displacement of the original exporter as imitators begin to take over. Finally, foreign producers achieve sufficient competitive strength arising from economies of scale and lower labour costs to export to the US market.
Figure 7.3 graphically presents the product-cycle model of international trade for the innovating country (the United States) and imitating countries (other advanced countries like Germany and developing countries like Mexico). As depicted in Figure 7.3, the innovating country starts production of the new product, but does not export that product until production exceeds domestic consumption. Eventually, foreign production begins to compete against the innovating country's exports, which, in turn, begin to fall. Exports come to an end as the innovating country becomes an importer of this no-longer-new product.
Figure 7.3 Product-cycle Model of International Trade

Source: Raymond Vernon, “International Investment and International Trade in the Product Cycle”, Quarterly Journal of Economics 80(2) (1966): 190–207.
On the other hand, an imitating country starts to import the new product from the innovating country at different times. If this imitating country is a high-income, advanced country (for example, Germany), it begins to import around the same time that the United States begins exporting. If, however, it is a low-income, developing country (for example, Mexico), then imports will begin some time after the United States begins its exports to the world economy.
Local production begins at a time when the local market grows to a sufficient size and cost conditions favour production against imports. If the imitating country is an advanced country, this coincides with the stage when US exports begin to show a decline, but if it is a developing country, this stage comes a bit later. Finally, when production begins to exceed consumption, the imitating country begins to export, and may export first to third countries and later to the innovating country.
Vernon's theory also suggests that the product-cycle model of international trade is associated with the life-cycle stage of the product itself. As the product moves through its life cycle, the life cycle of international trade also changes. The new-product stage in the product life cycle is associated with the first production of the product in the innovating country and the early portion of the export monopoly stage. During this stage, production functions are unstable and rapidly changing techniques are used in production. No economy of scale is reached. This phase is also characterized by a small number of firms and no close substitute products. The growth-product stage is associated with the later portion of the export monopoly and the start of foreign production. During this stage, mass-production methods are used to exploit expanding markets, and, therefore, high returns are achieved from economy of scale and market growth. Finally, the mature-product stage is associated with the third and fourth stages of the product-cycle model of international trade. This last stage is characterized by production of standardized products with stable techniques and intense price competition.
The product life-cycle theory helps to explain changes in production and trade in new product lines. It is generally true that the United States has been the principal innovator and production has spread rapidly to other countries that have been technically competent (for example, Germany) and to those which have had a comparative advantage in terms of cheap labour (for example, Mexico). It is also useful to remember that since the development of the model in the 1960s, the share of the United States in global gross domestic product (GDP) declined substantially, with other countries, such as Germany and Japan, emerging as strong innovators.
The product life-cycle theory offers accurate explanations of several global products. A classic example of this is photocopiers which were developed in the early 1960s by Xerox in the United States and exported to other parts of the world, including Japan. It expanded through joint ventures to meet increasing demand and set up production facilities in countries like Japan and England. With the expiry of original patents, foreign competitors such as Canon in Japan and Olivetti in Italy entered the global market as low-cost competitors, causing a decline in US exports. Production has subsequently shifted to other low-cost locations such as Thailand and Singapore, and the United States, Japan and the United Kingdom are now importers of the product.
A basic drawback of the theory is its original ethnocentric orientation, and the assumption of the United States as the country of origin for most products. In subsequent years, products such as video-game consoles have been developed in Japan, and wireless phones in Europe. Recent editions of laptops, digital cameras and compact disks have seen a simultaneous introduction in different parts of the world. As the global value chain gets more and more dispersed, the predictive power of Vernon's theory keeps losing more value.
New Trade Theory
The new trade theory refers to a series of papers by A. Dixit and V. Norman,12 K. Lancaster,13 Paul Krugman,14 E. Helpman,15 and W. Ethier,16 which propound the idea that trade between countries is based on increasing returns, product differentiation, and first-mover advantage.
The new trade theory explains trade between countries as based on increasing returns, product differentiation, and first-mover advantage.
Economies of Scale
The theory argues that economies of scale lead to increasing returns leading to specialization in many industries. Economies of scale refers to a reduction in the manufacturing cost per unit as a result of increased production quantity during a given time period. This is the result of using larger and more efficient equipment, financial economizing on the bulk purchase of goods, and the allocation of fixed costs such as administrative overheads and R&D over a larger output. Production costs also decline because of the learning curve, which refers to the improvement in productive efficiency arising out of increased production, leading to reduction in costs.17
Product Differentiation
Paul Krugman combines the concepts of economies of scale with the use of differentiated products to explain the pattern of intra-industry trade. According to this explanation, economies of scale determine the geographical concentration of the production of goods. He also explains that the concept of product differentiation is associated with resource constraints and imperfect competition between firms. Product differentiation, in turn, creates a product identity that is responsible for brand loyalty and helps the firm attain monopoly. Thus, firms in the same industry but from different countries produce differentiated products, which become the basis of intra-industry trade, creating a larger market for goods and allowing better utilization of internal economies of scale. The theory is along the same lines as Linder's income-preference similarity theory and finds empirical support in industries such as automobiles, speciality chemicals and wine, and explains the high proportion of intra-industry trade in overall international trade.
First-Mover Advantage
This explanation of trade emphasizes the economic and strategic benefits to a firm from being an early entrant in the market. These benefits arise in the form of market share from reduced costs and improved technical expertise—benefits which are not available to the late entrant. The theory emphasizes that for products which have significant economies of scale and represent a substantial volume of world trade, the first movers in an industry get a low-cost advantage that later entrants are unable to match. Various studies have proved that first movers have become industry leaders.
National Competitive Advantage
Michael Porter of the Harvard Business School proposed the theory of national competitive advantage to explain what enabled a nation to compete in the international arena. Considered an extension of Adam Smith's theory of absolute advantage, Porter explained national competitiveness in terms of having four attributes—factor endowments, demand conditions, related and supporting industries, and firm strategy, structure and rivalry. They are together known as “Porter's diamond”. He considered the emergence of countries such as Switzerland in precision instruments and pharmaceuticals, Japan in automobiles, and Germany and the United States in chemicals to be the result of these attributes.
Michael Porter explained national competitiveness in terms of four attributes, known as “Porter's diamond”. The four attributes are: (1) factor endowments, (2) demand conditions, (3) related and supporting industries, and (4) firm strategy, structure, and rivalry.
Factor Endowments
Central to the H–O hypothesis, factor endowments are the nation's possessions of factors of production such as skilled labour and capital. However, Porter proposed a hierarchy among them and distinguished between basic factors such as natural resources, climate, location and demographics, and advanced factors such as skilled labour, communication technology and research facilities. According to him, advanced factors have a significant role to play in the national competitive advantage and are the result of the efforts of individuals, companies, and governments. The theory explains that basic factors provide a nation with an initial advantage, which is reinforced by the advanced factors. Lack of natural endowments makes nations invest in the creation of advanced factors in order to have the ability to compete globally. For instance, various Caribbean nations have upgraded their communication systems to attract banking and other services into the economy. Japan's investment in the creation of engineers is likewise responsible for the success of its manufacturing sector.
Demand Conditions
Competitiveness is not only a function of the size of the demand but also its nature. For instance, if domestic demand is sophisticated, it forces the firm to produce high-quality products through innovative production practices. Japanese cameras are considered the best worldwide because of the demand for sophisticated products by the Japanese consumer. Similarly, Nokia's global leadership in mobile telephony is the outcome of the domestic demand in Finland.
Related and Supporting Industries
Competitive advantage is strengthened through the presence of efficient backward and forward linkages. A firm's suppliers and other related industries lead to spillover effects that translate into global competitiveness. For instance, Switzerland's success in pharmaceuticals is linked to its prior knowledge and leadership in the technologically-related dye industry. Similarly, the leadership of the United States in personal computers and other electronically advanced products is based on its technological leadership in the semi-conductor industry. The emergence of the software industry in the Indian context is the result of its English-speaking qualified labour force located in the golden triangle—the cities of Hyderabad, Chennai and Bangalore—developed with support from the large number of engineering colleges, government assistance in infrastructure, and other facilities creating networks of learning. According to Porter, the existence of related and supporting industries leads to their getting grouped into clusters of related industries. He identified the German textile and apparel cluster as an example where high-quality wool, cotton, synthetic fibres, sewing, machine needles, and a wide variety of textile machinery are all grouped together. Such clusters are valuable sources of knowledge which benefits everyone in the cluster through movements of employees between firms and for professional meetings and conferences.
Firm Strategy, Structure, and Rivalry
This refers to the extent of domestic competition, barriers to entry, and the firm's management style and organization. The existence of heavy competition in the domestic market forces a firm to hone its skills to be internationally competitive. Market structure also has a bearing on a firm's competitive response. The oligopolistic automobile sector has seen intense competition among auto majors Toyota, Honda, Nissan and Mitsubishi to improve performance through better and superior products. Management styles and beliefs also play a role in building competitive advantage. Porter noted that the emphasis of German and Japanese firms on improving manufacturing processes and product design is the result of a predominance of engineers in their top management teams. In contrast to this, US firms are usually led by people from finance, and, hence, they lack attention to manufacturing details.
According to Porter, the degree of a nation's success is a function of the combined impact of all these factors. Along with these, the government has a role to play through policies on subsidies, education and capital markets, which have an impact on domestic demand and on supporting and related industries.
It is difficult to comment on the predictive capability of Porter's theory since it has not been subjected to too much empirical testing. Just like other theories, it offers a partial explanation and complements them.
THEORY ASSESSMENT
None of the theories discussed in this chapter individually explain the entire range of motives for international trade, but their collective wisdom is the source of invaluable insights about international trade. The factor proportions theory given by the H–O theorem is the most acceptable explanation of the pattern of trade in labour-intensive products. The comparative advantage theory, on the other hand, is a powerful explanation of international trade in natural resource products, such as bananas. Extending the factor proportions theory by including skilled labour and technologies, the H–O theorem explains current trade patterns between developed and developing countries. Trade between Europe and Southeast Asia is an example of this. Major exports from Europe are technology-intensive products, including power generation equipment, petroleum processing machinery, medical equipment, and transportation equipment, whereas exports from Southeast Asia are mostly labour- or skilled labour-intensive products, such as garments, furniture, shoes, rubber products, arts and crafts, and standardized electric and electronics products.
Meanwhile, the technological gap (human skills and technology-based views) and the product life-cycle theories emerge as powerful explanations of trade in “new” products, that is, manufactures made by a skilled workforce using different technologies. These skills and technologies are the key factors responsible for improving a country's terms of trade, which is the major concern of both developed and developing countries today. Terms of trade is the relative price of exports, that is, the unit price of exports divided by the unit price of imports, which improves if the country exports more goods that are associated with advanced human skills and technologies. Although the product life-cycle model is less applicable today than at the time of its inception, it still explains key patterns in the evolution of international trade as every new product goes through a series of stages in the global marketplace.
The Leontief paradox and Linder's income-preference similarity theory are cogent explanations about trade for sophisticated manufacturing products and on trade between regions with similar income levels and consumption preferences. These theories view market demand (income levels and demand structure) as important parameters of international trade. Indeed, international trade today is driven not only by national differences in factor endowments but also by national differences in market demand. Intra-regional trade still accounts for a high proportion of world trade because of similarities in income levels and demand structures, as well as efficiencies arising from reduced uncertainty and transaction costs. The limitation of these theories is that they did not illuminate how trade activities would take place between two nations sharing similar income levels but with different consumption preferences. Due to this weakness, they seem unable to explain the increasing trade between developed countries and newly industrialized (for example, Singapore, South Korea, Taiwan, and Hong Kong) or emerging markets (for example, China, Brazil, India, Russia, and Mexico). These countries are not in the same region, nor do they share similar consumption preferences with the Western world. Increasing incomes and elevated purchasing power seem to be the key driver of this trade phenomenon.
The basic contribution of the new trade theory is its facilitation of understanding of intra-industry and intra-firm trade. The theory brings firms into the picture as the link between national factor endowments, firm behaviour, and firm incentives in explaining international trade. This link is important because firms rather than countries conduct international trade and investment. The efficiency of international trade is maximized if both differences in national factor endowments and the advantages of economies of scale of firms are combined and realized simultaneously. Since the TNC's role in international trade and investment is highly visible, the new trade theory has attracted more attention in recent years. The limitation of this theory, however, is that it overlooks other incentives beyond increasing returns from economies of scale.
Patterns and characteristics of today's international trade are quite different from those of trade activities in the last century and even those of three decades ago (the eighties), a period when the last trade theory emerged. The most important thrust for a new line of theoretical development will be a shift from the analysis of country comparative advantages to the assessment of country capabilities (or competitiveness). Factor endowment conditions, including human resources, technology, and information are a critical aspect of country competitiveness, and factor endowment differences between two nations remain an important foundation for international trade. However, other aspects of country capabilities also shape international trade. For example, an importing country's macroeconomic soundness, demand conditions, local competition, government policies, support of related industries (for example, banking service and foreign exchange hedging systems), as well as culture are expected to affect trade activities. At the same time, an exporting country's infrastructure, business rivalry, openness, and innovation are important factors influencing the volume of, and gains from, export activities.
REGION FOCUS | China's New Trade Partners
Latin America may well turn out to be another Africa for China. The giant from the East has been quietly making countries from this region its new trade destination. It is using a tried and tested strategy, cutting sweet deals for raw materials while being generous with market access and financial aid for trade partners. Many Latin American countries are heavily indebted, a problem dating back to the 1980s. The Chinese trade relationship is aimed at helping them reduce their debt and inequality.
Mexico was one of the first Latin American countries to establish diplomatic ties with the People's Republic of China in 1972. Over the past 33 years, the two countries have set up many cooperative programmes and signed a number of two-way agreements concerning trade, technology, finance, culture, energy, shipping, tourism, telecommunications, prevention of drug trafficking, agricultural cooperation, and coordination in cases of criminal jurisdiction. While Mexico is China's second largest trading partner in Latin America, it remains at a distinct disadvantage. China's exports dwarf what it takes from Mexico. The huge trade imbalance has prompted mounting concerns amongst Mexican industries over the flood of inexpensive Chinese goods and the negative impact of lower wages in Asia on Mexico's assembly-for-export factories. In addition, millions of dollars worth of Chinese contraband illegally enters Mexico everyday, further undermining Mexican commercial interests.
Argentina became an emerging economic power in the late nineteenth century partly due to its enviable, largely British-built rail system with trains that still “drive” on the left, which helped the country shift agricultural produce. The network was privatized in the late 1940s and then largely dismantled during the country's privatizations wave in the 1990s. Today, the network is piecemeal and the rolling stock dilapidated. Rising road haulage costs and the soaring cost of air freight have made rebuilding the rail network a difficult proposition. Under the Beijing deal in July 2010, the China Development Bank agreed to put up 85 per cent of the cost of repairing two branch lines, while Argentina would fund the rest. The deal also had a clause for rehabilitating the Belgrano Cargas line which runs through Argentina's agricultural heartlands and, thus, would make it easier for China to get Argentine produce to port, while contributing a metro system for Argentina's second biggest city, Córdoba.
Brazil has also been greatly impacted by its trade with China. China's hunger for pork, beef and poultry products has created a soya-bean boom in Brazil. In 2005, for example, China consumed 45 million tonnes of soya bean (250 per cent more than what it produced), out of which 5.5 million tonnes were shipped from Brazil, which doubled to 11 million tonnes in the next year. It has also made investments in oil exploration in Ecuador, Colombia and Venezuela, signed a free trade agreement (FTA) with Peru, as well as extended a credit line to Cuba and signed an agreement to buy nickel and sugar.
Sources: Information from Jude Webber, “Argentina: China's New Africa?”, Financial Times, 14 July 2010, available at http://blogs.ft.com/beyond-brics/2010/07/14/argentina-chinas-new-africa/, last accessed on 6 September 2011 and Alana Gutiérrez, “China's Economic Invasion Into Mexico: A Threat to the U.S. or an Opportunity for Mexico?”, Council on Hemisphere Affairs (COHA), 15 October 2005, available at http://www.coha.org/china%e2%80%99s-economic-invasion-into-mexico-a-threat-to-the-us-or-an-opportunity-for-mexico/, last accessed on 20 January 2010.
DEVELOPMENTS IN WORLD TRADE
The current phase of globalization, starting in the aftermath of World War II, strongly bolstered by new communications and transport technologies, has been marked by a prolonged period of strong trade and economic growth.
International trade split into three broad groups in the first three decades after World War II. The first group consisted of the “old” industrial countries which functioned as market-oriented economies with increasingly liberalized trade regimes under the General Agreement on Tariffs and Trade (GATT). The second group, comprising the Soviet Union, the rest of eastern Europe and China, consisted of centrally planned economies in which state-owned firms followed government diktat in production and trading decisions. International trade played a relatively minor role in these economies, although some cooperation within the group was organized under the umbrella of the Council for Mutual Economic Assistance (CMEA). The CMEA was a 1949–91 economic organization under the hegemony of the Soviet Union, comprising the countries of the Eastern Bloc along with a number of communist states elsewhere in the world. The third group of developing countries comprised the nations that gained their political independence between 1946 and 1962. Many of them opted for a mixed system in which the government played a strong interventionist role to encourage industrialization. This essentially led to a regime of import-substituting policies that relied on high tariff and non-tariff barriers to protect domestic industries.
This tripartite system led to a rise in the share of industrial countries in world trade, while those of the centrally planned and developing economies decreased. The character of this tripartite trading system began to change with the emergence of the East Asian economies characterized by high per capita income growth with strong trade expansion in manufactured goods. This was simultaneously accompanied by policy re-orientation in Mexico and China in the early 1980s, combined with the fall of the Berlin Wall and the dissolution of the Soviet Union a decade later.
Volume
International trade after World War II entered a long period of record expansion with world merchandise exports rising by more than 8 per cent per annum in real terms from 1950 to 1973. Trade growth slowed thereafter under the impact of two oil-price shocks, a burst of inflation caused by monetary expansion, and inadequate macroeconomic adjustment policies. In the 1990s, trade expanded again more rapidly, partly driven by innovations in the information technology (IT) sector and partly by the emergence of the Southeast Asian economies. Despite the contraction of trade caused by the dotcom crisis (a crisis generated by IT companies due to the misplaced confidence regarding profits and the speculation resulting from it, which led to rapidly rising stock prices and the subsequent crash) in 2001, the average expansion of world merchandise exports continued to be high, averaging 6 per cent from 2000 to 2007.
In the period between 1950 and 2007, trade expanded by an average of 6.2 per cent, which is much stronger than in the first wave of globalization from 1850 to 1913. As dollar prices expanded much faster after World War II than before World War I, the nominal trade expansion of the latter period was more than twice as fast as in the earlier period (9.8 per cent per annum versus 3.8 per cent per annum).
World merchandise exports took a major fall in 2009, declining by 12 per cent in value and 22.6 in volume, accompanied by a decline in world GDP but at a much lower rate of 2.4 per cent. World trade volumes fell on three other occasions since 1965 (–0.2 per cent in 2001, –2.0 per cent in 1982, and –7.0 per cent in 1975), but none of these episodes approached the magnitude of the plunge in 2009. The steep fall in trade is attributable to a combination of factors, such as weak demand, falling commodity prices, global supply chains, the simultaneous impact of the economic crisis across countries and regions, and limited access to credit in general and trade finance in particular. World imports grew 14.5 per cent and imports by 13.5 per cent in volume in 2010. In terms of value, world merchandise exports increased by 22 per cent, rising from USD 12.5 trillion to USD 15.2 trillion in a single year, while world exports of commercial services rose 8 per cent, from USD 3.4 trillion to USD 3.7 trillion. Nominal merchandise exports of developed economies jumped 16 per cent in 2010 to USD 8.2 trillion, up from USD 7.0 trillion in 2009. However, because this rate of increase was slower than the world average of 22 per cent, the share of developed countries in world merchandise exports fell to 55 per cent, its lowest level ever.
Exports grew faster than the world average in Asia and North America at rates of 15.0 per cent and 23.1 per cent, respectively, whereas Europe (10.8 per cent), the Commonwealth of Independent States (CIS) (10.1 per cent), the Middle East (9.5 per cent), Africa (6.4 per cent) and South and Central America (6.2 per cent) recorded a slower than average growth. Asia's rapid real export growth in 2010 was led by China and Japan. They recorded an increase of approximately 28 per cent in comparison to the rest of the world. Regions such as Africa, the CIS, the Middle East and South America that have significant exports of natural resources experienced relatively low export growth in terms of volumes in 2010, but very strong increases in the dollar value of their exports. For example, Africa's exports were up by 6 per cent in terms of volume, and 28 per cent in terms of dollars. This was due to the rising prices of commodities driven by the increasing demand for imports by India and China. Between 2000 and 2010, prices for metals showed an average annual increase of 12 per cent per annum, which was faster than any other primary commodity group, followed closely by energy with 11 per cent growth per annum. Only agricultural raw material prices stagnated, with increases of just 2 per cent per year on an average, over the last ten years.18
Composition
There has been a long-term shift in the composition of world merchandise trade, with the share of manufactured goods rising dramatically, against a decline in agricultural products and non-fuel minerals. The prominent role played by the industrial economies in world merchandise exports up to the 1990s was closely linked to their very large share in exports of manufactured goods. The share of agricultural products (including processed food) declined from more than 40 per cent in 1950 to less than 10 per cent since 1999. The share of fuels in world merchandise exports has fluctuated sharply due to a marked variation in prices, with the highest shares recorded in 1974, 1981, and 2007 (20 per cent of world trade on each occasion). Over the years, the domination of developed countries in world exports of manufactured goods has been greatly diluted, first in labour-intensive goods, such as textiles and clothing, and, subsequently, in electronic products and capital-intensive goods, such as automotive products.
Direction
The most dynamic traders of the global economy in the 1950–1973 period were the west European countries and Japan. Post–World War II reconstruction and the Korean War provided a major stimulus to Japanese and European exports in the early 1950s. European integration kept up the pace of intra-European trade. The United States remained Japan's largest export market throughout that period, but there was rapid movement of Japanese export to western Europe and to the Asian newly industrialized economies (NIEs).
The six NIEs followed an outward-oriented trade policy and succeeded in sharply increasing their merchandise exports from the early 1960s, leading to a growth in their share of world exports from 2.4 per cent to 9.7 per cent in two decades. Starting out as textile exporters, these economies later diversified into exports of consumer electronics and IT products. The dominant share of the United States in world trade in the early 1950s went down in subsequent decades.
During the 1970s and 1980s, the share of regions in world merchandise exports varied, largely due to the fluctuations of commodity prices and exchange rates. The oil-exporting developing countries (especially those in the Middle East) increased their share between 1973 and 1983 but lost almost all their gains when oil prices fell later.
In the 1990s, Japan's share in world exports started to shrink significantly, owing to the competitive pressure exerted by the NIEs and China. The stimulus provided by the creation of the North American Free Trade Agreement (NAFTA) in 1994 was not sufficient to reverse the downward trend in the share of Canada and the United States in global trade. Similarly, the European integration process which continued to deepen and expand to cover the central European countries and the Baltic states could not halt the relative decline of European exports.
The reduced share of the industrial countries can be attributed first to the rise of China, the recovery of the Commonwealth of Independent States (CIS), and in more recent years, to the boom in commodity markets. Increased competition from China in the world trade of manufactured goods was concentrated initially on the textiles trade and other labour-intensive goods, such as footwear and toys, but expanded quickly into consumer electronics and IT goods. More recently, China's biggest gains in market share were in iron and steel products. China more than tripled its share in world exports between 1990 and 2007.
In 2009, China overtook Germany as the leading exporter of merchandise. The United States remained in third position. Although the United States remained the world's leading importer, its share in world imports fell from 13.1 per cent in 2008 to 12.7 per cent in 2009. On the other hand, China's share in world merchandise imports increased from 6.9 per cent in 2008 to 7.9 per cent in 2009, resulting in China becoming the second largest world importer. China, Germany and the United States are well ahead of other countries in terms of the total value of imports and exports.
In 2010 too, the leading merchandise exporters were China (USD 1.58 trillion, or 10 per cent of world exports), the United States (USD 1.28 trillion, or 8 per cent of world exports), and Germany (USD 1.27 trillion, or 8 per cent of world exports). The United States overtook Germany to become the second largest exporter, one year after Germany gave the top position to China. The top merchandise importers in 2010 were also the United States (USD 1.97 trillion, or 13 per cent of world imports), China (USD 1.40 trillion, or 9 per cent of world imports), and Germany (USD 1.07 trillion, or 7 per cent of world imports). The importance of the United States, China and Germany is also obvious from Tables 7.6 and 7.7, which give the shares of both developed and developing economies in world merchandise exports and imports through 1948 to 2009.
Table 7.6 World Merchandise Exports

Note: Between 1973 and 1983, and between 1993 and 2003, export shares were significantly influenced by oil price developments.
a Figures refer to the Federal Republic of Germany from 1948 to 1983.
b Figures are significantly affected by including the mutual trade flows of the Baltic States and the CIS between 1993 and 2003.
c Beginning with 1998, figures refer to South Africa only and no longer to the Southern African Customs Union.
d Figures refer to the European Economic Community (EEC) (6) in 1963, European Commission (EC) (9) in 1973, EC(10) in 1983, EU(12) in 1993, EU(25) in 2003 and EU(27) in 2009.
e Membership as of the year stated.
Source: Reproduced with permission from World Trade Organization (WTO), International Trade Statistics 2010, available at http://www.wto.org/english/res_e/statis_e/its2010_e/section1_e/i06.xls, last accessed on 20 December 2010.
Table 7.7 World Merchandise Imports
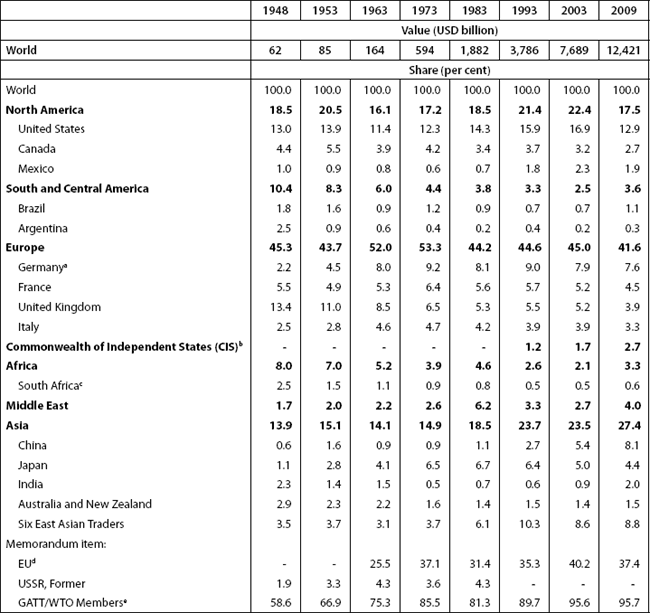
Note: Between 1973 and 1983, and between 1993 and 2003, import shares were significantly influenced by oil price developments.
a Figures refer to the Federal Republic of Germany from 1948 to 1983.
b Figures are significantly affected by including the mutual trade flows of the Baltic States and the CIS between 1993 and 2003.
c Beginning with 1998, figures refer to South Africa only and no longer to the Southern African Customs Union.
d Figures refer to the EEC(6) in 1963, EC(9) in 1973, EC(10) in 1983, EU(12) in 1993, EU(25) in 2003 and EU(27) in 2009.
e Membership as of the year stated.
Source: Reproduced with permission from World Trade Organization (WTO), International Trade Statistics 2010, available at http://www.wto.org/english/res_e/statis_e/its2010_e/section1_e/i07.xls, last accessed on 20 December 2010.
Service Trade
Trade in services currently accounts for a significant proportion of global trade and has a rapidly growing share. Service trade encompasses the import and export of financial services, information services, the provision of education and training, travel and tourism, healthcare, consulting and advisory services, and so on. Due to their advantage in services, developed countries tend to push much more aggressively for a removal of barriers to trade in services.
The rise of the service sector is a global phenomenon, with services accounting for 70 per cent of GDP in Jordan, 65 per cent in Uruguay, 52 per cent in Zambia, and 50 per cent in India and Pakistan. The service sector is an important source of not only jobs but also export revenues for developing and transition economies. Table 7.8 depicts the importance of the service sector in the exports and imports of both developed and developing economies.
The economies of developing countries have traditionally first established a strong agricultural and manufacturing base to meet the basic needs of food and shelter. Countries such as Mexico, Singapore, Hong Kong, Bermuda, and the Bahamas have, however, moved away from the traditional development pattern and are concentrating on developing their services sector. There are a number of reasons for this, ranging from lack of natural resources to the existence of a strong low-cost skilled work force.
World exports of commercial services increased by 8 per cent in 2010, although it had declined by 12 per cent to USD 3,350 billion in 2009 as a result of the global economic crisis. In the CIS, the region recording the most rapid growth in 2008, exports of commercial services fell by 17 per cent. Transportation was the fastest growing component of commercial services exports in 2010, with an increase of 14 per cent to USD 782.8 billion. Russian export growth of 6 per cent was also driven by transport services. The faster growth of transport services is not surprising since they are closely linked to trade in goods, which saw record growth in 2009. Travel grew in line with commercial services overall, whereas other commercial services (including financial services) advanced more slowly.
North America's exports were worth USD 599 billion in 2010, while the value of the region's imports came to USD 471 billion. There was an increase of 9 per cent in both exports and imports. South and Central America's exports rose by 11 per cent to USD 111 billion, but imports grew more than twice as fast (23 per cent) to reach USD 135 billion. Both exports and imports of Brazil recorded a faster than usual regional average growth rate of 15 per cent and 35 per cent, respectively, with particularly high growth rates observed for imports of transport services (42 per cent) and travel (51 per cent), partly due to the strength of real exports.
Europe's exports and imports were both larger than any other region's in 2010 (USD 1.72 trillion and USD 1.5 trillion, respectively), but they were also the least dynamic, with growth of just 2 per cent on the export side and 1 per cent on the import side. The reason for Europe's poor performance can be found in the weakness of travel services, which declined by 3 per cent on the export side and 2 per cent on the import side.
In 2010, exports of CIS countries increased by 10 per cent to USD 78 billion. The region's imports also rose by 14 per cent to USD 105 billion. Meanwhile, Africa exported USD 86 billion worth of commercial services, 11 per cent more than in 2009. The continent's imports also rose by 12 per cent to USD 141 billion. In South Africa, travel receipts increased by 24 per cent due to the large number of foreign visitors attending the FIFA World Cup.
The United States exported USD 515 billion in commercial services in 2010, or 14 per cent of the global total, making it the world's largest exporter. The other countries in the top five were Germany (USD 230 billion, or 6 per cent of world exports), the United Kingdom (USD 227 billion, or 6 per cent of world exports), China (USD 170 billion, or 5 per cent of world exports), and France (USD 140 billion, or 4 per cent of world exports). The United States was also the leading importer, with purchases of USD 358 billion from foreign providers, equal to 10 per cent of world imports. It was followed by Germany (USD 256 billion, or 7 per cent of world imports), China (USD 192 billion, or 5.5 per cent of world imports), the United Kingdom (USD 156 billion, or 4.5 per cent of world imports), and Japan (USD 155 billion, or 4.5 per cent of world imports). Hence, China replaced France as the fourth largest exporter of commercial services, while Germany overtook the United Kingdom in the second place. China also moved up the rankings on the import side, taking over the third position from the United Kingdom.
Table 7.8 Trade in Commercial Services


Source: Reproduced with permission from World Trade Organization (WTO), International Trade Statistics 2010, available at http://www.wto.org/english/res_e/statis_e/its2010_e/section1_e/i16a.xls, last accessed on 20 December 2010.
CLOSING CASE | Fruit Salad from India
Aran village in Maharashtra's Solapur district, and Atpadi and Jat in Sangli districts, which have historically been known for severe famines till a decade ago, are today leading export hubs of premium quality grapes and pomegranates. A decade ago, Aran villagers would march up to the district collectorate for implementation of the employment guarantee scheme; today it is difficult to get farm labour as the village produces the much sought-after deep red Bhagwa variety of pomegranate—a major export from the country.
Fruits such as grapes, pomegranates, strawberries, and kiwi, which are not indigenous crops, have established themselves as revenue-earners for farmers in the domestic market. The Indian farmer has emerged as a supplier of repute for European retail chains as exporters tie up with farmers for identity-preserved fruits to conform to the European Union's (EU) stringent safety and health norms. Some of them have an exclusivity tag attached to them, such as grapes, which are sourced only from India for the EU during the months of February to April.
The growth in exports has been phenomenal; pomegranates have grown from 7 tonnes in 1999 to more than 35,000 tonnes in 2007–2008, beating traditional exporters such as Iran, Egypt and Israel. India's Bhagwa variety of pomegranates, popular in Europe because of their bright red cover, was discovered by accident, when research on pomegranates was stolen from an agricultural university in Maharashtra some years ago. As the university had not officially developed the variety, the farmers themselves named it Bhagwa, or saffron in Marathi.
Fruit cultivation is suddenly a lucrative business opportunity in India's sprawling agrarian hinterlands. Global retail giants like Walmart and Carrefour are reaching out to Indian farmers, working closely with them on technical support and knowledge of best practices to source produce for global and domestic markets. Everything from technology, high-yield seeds, and fertilizers to weather reports and market information is delivered to the farmer's doorstep. Companies in the food business are entering into pre- and post-harvest tie-ups—a far cry from the time when farmers had to run after traders to sell their produce. Bharti Walmart sources all its fruit, including fresh grapes, pomegranates and melons, from India for Walmart's UK subsidiary ASDA. Fresh fruits and vegetables constitute 4 per cent of their total sales basket, going up to 10–12 per cent of total sales in certain stores. Bharti Walmart works closely with Walmart's Europe team, Indian suppliers, and farmers to ensure implementation of globally accepted practices and other requirements in the area of farming, quality assurance, and post-harvest management. Farmers, supplier partners, and all other stakeholders are educated to enhance the export effectiveness of Indian produce. Delhi-based organization Dev Bhumi is part of the supply chain of French retail giant Carrefour, extending technical support to small and marginal apple farmers in the Matiana region of the Shimla district, who have expressed their willingness to become a part of the modern global retail world.
Developments in processing and storage technology have played a huge role in the success of fruit cultivation and export. The controlled atmospheric (CA) cold-store systems, that is, lower oxygen and increased carbon dioxide levels, help reduce ethylene generation, ensuring that the produce has a longer shelf life. Processing has played a big part in the development of Mahabaleshwar, a hill station near Pune, which depended on tourism for livelihood till a decade back. In the mid-1990s, the state government and the local farmers took up commercial plantation of strawberries, which were first introduced by the British and were grown till then only for tourist consumption. The use of imported seedlings from California has helped the areas under plantation to increase from negligible areas in the early 1990s to 2000 hectares in 2010–2011. Assistance from the Maharashtra Government, which aligned its employment guarantee scheme with horticulture, was in the form of a 100 per cent subsidy for farmers to set up fruit orchards and drip irrigation.
Benefits for the farmer encompass spot payments, immediate price updates, transparent weighing systems, quality incentives, technical guidance, and high-quality raw material. Most importantly, farmers are insulated from market risk and post-harvest damage. The farmer is also educated about the risks associated with pesticide residues through the establishment of networks, such as the Grapenet and Anarnet chemical residue traceability systems, which are used for grape and pomegranate exports to the EU. The Maharashtra Government, too, plays its part in bearing the cost of procuring a global good agricultural practice (GAP) certification, which gives farmers access to the quality-conscious European market.
Questions
Using the facts in the opening vignette, compare the growth of the floriculture industry in Ethiopia with the emergence of horticulture exports from India.
Examine the role of the horticulture industry in the emergence of global supply chains such as Walmart and Carrefour.
Source: Information from Jayashree Bhosale and Madhvi Sally, “Fortune in Fruits”, The Economic Times, 18 January 2011.
SUMMARY
- International trade is the exchange of goods and services across borders. A number of theories help to explain why nations trade with each other. Some of these include the theory of comparative advantage, the theory of absolute advantage, the factor proportions theory, the Leontief paradox and the international product life-cycle theory. All of them propound the case for free trade.
- The classical approach encompasses the theory of absolute advantage and the theory of comparative advantage. The theory of absolute advantage suggests that individual countries should specialize in the exports of goods they are best suited to produce because of natural and acquired advantages. The theory of comparative advantage believes that a country's comparative advantage is dependent on differences in comparative production cost, which further depends on the commodity's production process, and on the prices of production factors linked to the availability of those factors.
- The factor proportions theory postulates that differences in a country's factor endowments are the basis of trade. This proposition was disputed by the Leontif paradox, a study of trade in the United States.
- The product life-cycle theory links trade with developments in a product's life span encompassing four stages, namely, introduction, maturity, growth, and decline.
- Contemporary thinking on trade emphasizes the role of economies of scale as the determinant of trade and strategic thinkers promote the judicious use of subsidies to enable firms to become first movers in emerging industries.
- Important aspects that have to be taken into account while reviewing trends in world trade are volume, composition, direction, and trade in services. Trade in services has emerged as an important aspect of international trade, especially for countries of the developing world.
KEY TERMS
Absolute advantage
Comparative advantage
Economies of scale
Exports
Factor endowment
Factor proportions theory
Imports
Income-preference similarity theory
International trade
Leontief paradox
National competitiveness
New trade theory
Product differentiation
Product life-cycle model
Production factor
DISCUSSION QUESTIONS
- Compare the theory of absolute advantage and the theory of comparative advantage and comment on their relevance in the present era of modern trade.
- How does the factor proportions theory explain trade between nations? How does the Leontif paradox modify its explanation?
- Explain the importance of the product life-cycle theory in explaining trade between nations.
MINI PROJECTS
- The World Trade Organization's (WTO) international trade statistics is an annual report on trade statistics in merchandise goods and commercial services. Using the latest report (http://stat.wto.org/StatisticalProgram/WSDBStatProgramSeries.aspx?Language=E), prepare a summary of the world's leading countries in trade of goods and analyse the factors responsible.
- You are a consultant for an Australian energy company, which is currently exploring the Vietnamese market. Using the information given in the Australian Government's Web site, https://www.austrade.gov.au/Clean-energy-to-Vietnam/default.aspx, prepare a feasibility report for the planned venture.