25
Pricing, Costing and Financial Decisions 1
“Financial managers strive to obtain borrowed funds at the lowest cost, to select projects that offer the best returns, to balance the financial risks taken with investors’ expectations of returns and to keep the business liquid
—James K. Keebler”
Chapter Objectives
To understand:
- Product pricing decisions
- Costing techniques and methods
- Financial metrics in supply chain
- SCM and SCOR models
- Effect of supply chain performance on EVA
Supply chain management is the backbone for the success of a business. Financial issues are very important for supply chain. The challenge of every business lies in allocating the resources required to effectively and efficiently meet the expectations of its various constituencies. To enhance its financial health, a firm should enhance its functional capability and process assessments and should benchmark its best practices to achieve competency. For that, the supply chain needs an integration of its processes to manage the business cycle time and align itself to the capabilities of its service providers to get maximum benefits in terms of service and savings. The financial metrics are keyed to economic value added (EVA), a widely accepted set of financial performance measures.
ITC Managing Cash Flow with No Credits to Customers
ITC is one of India’s leading private sector companies with a turnover of $6 billion. It has a diversified presence in cigarettes, hotels, paperboards and specialty papers, packaging, agribusiness, packaged foods and confectionery, information technology, branded apparel, personal care, stationery, safety matches and other FMCG products.
In 2009–10, the revenue from cigarette division was Rs 18, 110 crores contributing to 65.5 per cent of the total sales revenue of the company. ITC caters to the Indian cigarette market, with around 47 SKUs to reach 48 million customers (smokers). The company ensures freshness of 2 months for cigarette products.
For cigarettes, ITC has a wider distribution network of 1 million retailers, 60,000 wholesalers (with 9, 000 vans/cycle salesmen), 800 wholesaler dealers and 23 C&F agents. The company also has four manufacturing plants and six contract manufacturers.
ITC’s ultimate customer is the retailer who has very few or no financial standing and who has investment capacity of ½ days. Hence, ITC offers no credits to the retailer but ensures high-frequency supplies. The cycle salesman collects the money against the delivery of even very small quantity (one pack of cigarette). The company has 17 cash collection centres and simultaneous fund transfer facility. No credit at any stage of supply chain is encouraged. Remittance from wholesale dealers follows the same pattern. Even though the margins to wholesaler dealers are very low, the ROI is high because of high stock/cash turnaround, which is 30 times a year. The major task of field sales force is follow-up on payments/cash flow at all stages of the supply chain. This credit policy helps ITC to generate funds for payment of excise duty, which is very high. In view of high incidence of excise duty, there is tight control on inventory. Due to the branch manager’s forecasting and direct ordering (on daily basis) from factories, there is no time lag, resulting in better inventory management. The pipeline inventory (excise paid—stock on hand/in transit) is kept within 4 days.
As per the company’s past experience, even a 1 day delay in transit time costs the company Rs 26 million by way of interest. The transport mode is truck and not the rail. Full truck-loads of deliveries are made to destinations without trans-shipments. The company has a bonus-penalty system with transporters. With its tight finance policy, ITC is maintaining its trade receivables within 3.6 days (last year 1.4 days) and has no major financial issues in its supply chain.
INTRODUCTION
Every business has a common challenge of allocating the required resources to effectively and efficiently meet the expectations of its various stakeholders. These are investors looking for ROI (return on investment), employees expecting right compensation, customers requiring value for money they spend on the products and services they purchase, channel partners expecting help from manufacturer, suppliers expecting timely payment, community expecting socially responsible behaviour, and government expecting payment of taxes and fair business practices, as well as regulatory compliance. The challenge for business firms is to seek out ever-improving ways to satisfy all the above areas.
Technology is a pervasive factor in supply chain and can be leveraged for cost and service leadership. Nowadays many firms are making efforts at creating accurate and integrated cost measures to increase the visibility of costs within the chain using activity-based costing method. Ultimately, restructuring the supply chain to exploit efficiencies also requires a mechanism capable of identifying and equitably allocating costs and benefits between the partners as changes are implemented. The investigation of financial issues in supply chain management has raised fundamental questions about competency and confidence levels of supply chain managers in their financial skills, adequate interface between the financial function and the supply chain functions, and the financial implications to partnering, strategic alliances and outsourcing. The supply chain operations reference model (SCOR), developed by the Supply Chain Council is the base for supply chain performance metrics used herein. The decisions on items such as transportation modes, sourcing and replenishment are based on operating expenses. If an enterprise-wide perspective is not adopted, the real value of SCM will not be achieved. SCM drives key financial metrics such as revenue growth, percentage cost of goods sold and days in inventory. The financial metrics are keyed to economic value added (EVA), a widely accepted set of financial performance measures. Improving most SCM professionals’ financial acumen is a critical factor in making the financial-SCM connection. SCM professionals must understand how SCM business processes and strategies impact key financial metrics and contribute to returns to shareholders.
Since 1990, supply chain and supply chain management, have become pervasive terms in the business and academics. Supply chain concept has virtually replaced the predecessor terms, ’business logistics’, which was quite common earlier. This is because the effective management of the supply chain can help boost a firm's performance; in particular, they realized that SCM can provide a sustainable competitive advantage and improve profitability by taking out the costs. A well-managed SC can help to succeed on four dimensions of competitiveness—cost, quality, response time and flexibility.
Supply chain management spans all movement and storage of raw materials, work-in-process inventory and finished goods from point-of-origin to point-of-consumption. SCM has been significantly successful in enhancing the control of operational activities through the application of supply chain planning and supply chain execution solutions. However, most executives still find it difficult to interact with SCM solutions in answering many questions and have doubts as to whether the drivers of this operational activity really execute financial and strategic objectives. The major challenge for businesses is to construct integration between these operational elements and systems in view of the strategic and financial goals of a business.
The supply chain performance metrics used here are based on supply chain operations reference model (SCOR), 3 developed by the Supply Chain Council. The financial metrics are keyed to EVA, a widely accepted set of financial performance measures.
PRICING DECISIONS IN SUPPLY CHAIN
To manage demand and to assure the desired order flow in supply chain, companies like Wal-Mart have adopted the strategy of ‘everyday low pricing’. This strategy helps in reducing variations in demand and enhances the capability in inventory availability leading to better customer service at lower operating costs. The pricing strategies are also evolved and implemented to clear slow-moving items and build order flow resulting in increasing revenues.
The major tools used in supply chain demand management are pricing and promotion. They temporarily discount selected items below the average price level to clear slow moving inventory or increase retail store traffic. To exhibit image and high quality, sometimes prices are set slightly above their competitors’ prices. It is observed by Pashigan and Bowen (1991) that retailers who reduce the initial price after the first period are significantly more profitable than those who maintain a fixed price. From the supply side, the manufacturing level of the supply chain, which often must adjust capacity, as retail orders rise and fall over time need to be lined with pricing strategy. The costs, which include overtime expenses like hiring, training and layoff costs, as well as subcontracting and inventory carrying costs are reflected in the unit prices that manufacturers charge the retailers. However, retail pricing strategies that help smooth demand swings helps reduce production change costs, increasing margins and perhaps total profit for the supply chain. The general experience is that the items with seasonal demand patterns (consumer durables, clothing, toys and sporting goods) are not affected by low pricing strategy and this strategy will do little to stabilize their demand. If the firm is implementing low pricing strategy during seasonal demand, the cost arising out of production change will be absorbed by the supply chain. This will obviously reduce the margins and supply chain profits.
Pricing and Profits
Low pricing strategy is appropriate for supply chains that produce and sell items with stable demand, but it cedes most control over demand. However, with this strategy, the profitability is low. The price changing policy is an appropriate strategy when demand is seasonal. There are other environmental factors such as demand elasticity, promotion cost and production change costs that impact decisions on pricing strategy, keeping in mind the goal of performance criterion is profit. To understand pricing dynamics, we consider a three-level supply chain model for a single product. The model enables us to compare alternative pricing strategies in a hypothetical supply chain. This model includes retail and manufacturing sectors, and spans multiple periods. Key parameters include retail demand characteristics (seasonality, price elasticity), retail-level cost characteristics (promotion costs, ordering costs, holding costs) and manufacturing-level cost characteristics (labour costs, production change costs and limitations, and production rates). Decision variables include retail prices, replenishment orders to the manufacturer, and the manufacturers’ short-term capacity decisions to meet those orders.
The role of the retailer is to set retail prices and to periodically order sufficient product to satisfy forecasted demand. These decisions influence retail demand, total revenue, promotion expenses, and inventory costs. EDLP (every day low price) retailers maintain a constant price over the planning horizon, and as a consequence avoid additional promotional expenses. It is assumed that the EDLP is chosen to maximize profit for the entire supply chain. HLP (high and low prices) retailers may change prices periodically, incurring a promotion expense proportional to the monthly revenue when the discount price is in effect. The high and low prices will be chosen optimally to straddle the single optimal price for EDLP retailers, as will the timing of any change in prices.
The manufacturer, with short-and intermediate-term capacity constraints, must produce sufficient quantities to satisfy the temporal demand manifested in the retailer's replenishment plan. The manufacturer uses a combination of production planning strategies such as overtime/undertime, workforce level changes, and inventory to fill the retailer's orders at minimum cost. To maintain adequate service levels, backorders are not allowed here.
Supply Chain Profit Model
Here assumption is that both retailers (EDLP and HLP) optimize their offering price(s) with respect to total supply chain profits. The EDLP (retail price) is held constant throughout the planning horizon. The HLP retailer may switch between the optimal regular price and the optimal discount price as desired, incurring a promotion cost each period when the discount price is in effect. These decisions determine monthly demand and total revenue for the supply chain. Additional costs incurred by the retailer include ordering costs and inventory holding costs. Here, for optimizing total supply chain profits, the manufacturer's transfer prices are at cost.
COSTING DECISION IN SUPPLY CHAIN
One of the most important and also most difficult parts of supply chain management is the supply chain cost analysis. This is an area incredibly important and extremely difficult. Irrespective of the type of organization, firms need to make sure to know supply chain costs. Companies can lower their supply chain costs by using new management strategies to reduce their inventory safely. First, they must stop treating transportation as a management priority which is separate from inventory management. Second, companies should install technologies that provide detailed inventory visibility throughout their supply chain. These are the prerequisites for lowering inventory and achieving supply chain cost reductions.
Inventory levels, not transportation costs, drive supply chain savings. For most manufactured products, transportation is only 2–5 per cent of total cost. In contrast, raw materials, components, and sub-assemblies typically constitute 55–75 percent of total cost. This reality helps explain why large cost savings result from complete supply chain solutions that reduce raw material and finished goods inventories.
There are many opportunities to reduce total cost in supply chains, which are responsible for many unnecessary overhead costs to generate forecasts, count inventory on-hand, generate purchase order inputs through MRP (material requirement planning) systems, place purchase orders, wait for parts to arrive, expedite those that are late, receive (and maybe inspect) materials, warehouse, group into kits for scheduled production, and distribute within the plant. These costly and time-consuming steps can be avoided with a spontaneous supply chain, which is able to pull in materials and parts on-demand.
There are three basic ways to reduce the supply chain costs and they are:
Simplification The prerequisite to cost savings, in supply chain management, is simplification, which corresponds to the basic lesson of industrial engineering, that is, ‘simplify (process and product) before automating or computerizing.
Product line rationalization To eliminate or outsource the most unusual products that has the most unusual parts.
Standardization To reduce the variety of parts and materials to a point where they can be pulled into the factories.
Selective vertical integration To eliminate any remaining long-lead time parts and materials, the SCM costs metrics attempt to segment cost centres into a process-based activity. Below are listed suggested level two and three metrics with brief definitions.
- Order management cost
- Customer service cost
- Finished goods warehouse cost
- Outbound transportation cost
- Contract and programme management cost
- Installation planning and execution costs
- Accounts receivable cost
- Material acquisition cost
- Purchasing cost
- Raw material warehouse cost
- Supplier quality cost
- Component engineering and tooling cost
- Inbound transportation cost
- Accounts payable cost
- Planning cost
- Demand planning cost
- Supply planning cost
- Supply chain finance control cost
- IT cost
- Application cost
- IT operational cost for supply chain
- Inventory carrying cost
- Opportunity cost
- Obsolescence cost
- Shrinkage cost
- Taxes and insurance cost
In order to perform a supply chain cost analysis in a company, one needs to primarily find out the accounting method that is used in the organization. If firm is using an activity-based accounting, then it is a good sign as this generally divides all sorts of costs into proper categories and firm can hand pick which ones are associated with the supply chain. The data gathering for activity-based accounting supply chain cost analysis is very easy.
TYPES OF SUPPLY CHAIN COSTS
Below is a list of supply chain cost centres and categories that firm might want to find out and track individually:
- Transportation costs (inbound, in-plant and outbound)
- Warehouse costs (fixed and variable)
- Packing and packaging costs
- Working capital costs (blocked in inventory)
- Insurance costs
- Costs for mistakes (invoicing, delivery, orders, etc.)
Comparing these specific costs across the organization could reveal inefficiencies in some parts of the company, it could reveal the best practices to be adopted in some areas of the supply chain, and it could provide direct actions to reduce costs in organization to realize savings.
NANO: New Approach to Supply Chain Costing
The secret of designing the Tata Nano is a concept called ‘target pricing or target costing’, taking into consideration the features and functions customer want in a small car. To cut the cost, Tata Motors have focused on their supply chain, particularly on upstream (suppliers). Setting the price and working backwards also required a fundamental shift in the way the car was designed, since many costs are fixed once the design is set. To accomplish this, Tata Motors worked in collaboration with suppliers very early in the process. They set the functional goals for many parts rather than technical specifications. This approach tapped the ingenuity of the supply chain, delivering parts that met the functional requirements and at extremely low prices
To reduce cost, they look at supply chain upstream rather than downstream. Tata brought in suppliers such as Bosch, a German maker of appliances and motors, and Delphi, a world leader in automotive parts in early-stage design, challenging them to be full partners in the Nano innovation by developing lower-cost components. Tata built partnerships with a limited number of suppliers and put everyone in the same room to work through problems and make suggestions and that created enormous value.
Tata has taken a three-pronged approach. The first one is alternative design and materials with low form factor in design. Second one is low cost manufacturing and logistics allowing the company to capitalize on the region’s comparatively lower cost R&D, manufacturing talent and single market approach. The third one is strategic sourcing approach, extending the use of its e-sourcing (online auctions for 45 per cent of material cost) and competitive online bidding methods with fewer suppliers, and improving supplier development and capacity. With an aggressive timetable for savings, Tata used a mix of sourcing automation and external sourcing and spend category expertise to better control its direct materials costs.
SUPPLY CHAIN AND FINANCE
The financial supply chain parallels the physical supply chain and represents all transaction activities related to cash flow, from the buyer's initial order through reconciliation and payment to the seller. Until recently, the financial supply chain went virtually unnoticed. The amount of time required to process transactions was unthinkably long because the manufacturing supply chain had inefficiencies. Nonetheless, companies prospered, in part due to lack of global competition and, in part, because all domestic companies were saddled with the same poor quality demand forecasting limitations, inefficient distribution and lack of supply chain visibility. They used the same strategy to compensate for these problems and hedge against uncertain demand, excess inventory, excess capacity and surplus labour. Since the cost of capital was low, reserve positions were routinely used.
ABD Bank—Financing the Supply Chain Operations
Supply chain financing is one of the fastest growing segments in the banking sector these days. A more advanced and sophisticated version of the age-old working capital financing (WCF) called supply chain-financing (SCF) has been created and implemented by ABD bank.
Earlier, ABD bank looked at each entity on its own merit, and went by fairly standard and rigid permissible bank financing’ kind of formulae. Now, ABD bank is looking at value chains around large manufacturing companies. ABD Bank is looking at them like original equipment manufacturers (OEMs). ABD is now saying that they are financing the suppliers and distributors of OEMs.
The supplier’s financing is considered safer for the ABD bank, as suppliers can be decent-sized companies (compared to a distributor); and more important, the credit risk is in a way, backed by the original equipment manufacturer (OEM). ABD bank opened a line of credit for a supplier in consultation with the manufacturer (OEM), who is the bank’s customer. This line of credit is very specific to the product that the vendor supplies to the manufacturer. An OEM gives a guarantee to its vendors for a specified offtake of parts over the year. On the basis of this guarantee, the vendor approaches the ABD bank which is usually recommended by the OEM and obtains better financing interest rates and services. In exchange, ABD bank finances the working capital requirements of the vendor. The recovery of the loan is linked to the vendor supplying to the OEM on time schedule. After the vendor supplies the OEM’s, payment is routed through an escrow account, to give further comfort to the bank. In this process, there is little chance of the vendor diverting funds somewhere else. In case there is a cash discount to the OEM from the vendor, the bank may even pay the vendor upfront, and collect from the OEM later. All this also involves, the bank keeping tabs on production, dispatch, payment, and financial health data of the vendor.
It is more like a performance risk on the part of bank. The vendor benefits as he gets cheaper financing than it may get from traditional working capital routes. The OEM benefits in two ways: better supply from the vendor, and also the OEM reduces its own working capital needs. Vendors can supply just in time because their finances are more robust now. This enables the OEM to keep lesser inventory. In other words, the WCF is shifting from OEM to vendors by this route.
On the distribution side, ABD bank provides working capital to selected distributors allowing them to lift output from the manufacturer. Often there is provision of an escrow account kind of mechanism where the sales of the distributor get credited to an account with the bank. The OEM has access to this bank account, and can make payments to himself from this account. So the OEM now has the comfort of getting payments. The bank can monitor sales and receipts of the distributor. In this, the bank also saves on a lot of charges for collection, processing and security.
Today the typical financial supply chain remains somewhat fragmented, complex and not integrated with the physical supply chain. Goods move faster than money, and disparate parties are involved. Moreover, even in today's world, the financial supply chain is partially composed of paper-based processes. To stay competitive, ’just-in-time’ working capital management should be the goal. Financial supply chain solutions enable CFOs and treasury managers to accurately manage their receivables or payables, forecast their company's financial future and reduce their working capital needs.
Customers are impacted most directly by supply chain and shareholders more so by corporate financial performance. There is a synergy between the two. For example, customer may expect consistent on-time delivery to support JIT operations metrics that focus on inventory and transportation activities in the supply chain which will determine how effectively the firm is satisfying a customer's need for JIT support. Getting those activities right may improve the firm's competitive position by yielding higher revenues through greater market share. Financial supply chain management is the most effective approach to optimize working capital levels, streamline accounts receivable processes, and eliminate excess costs linked to payments. The lack of synchronization between the financial supply chain and the material supply chain creates excess working capital, or nonproductive float, which is a hedge against the lack of visibility into the supply chain itself. A better way is to optimize the financial supply chain, integrate it with the material supply chain and substitute information for float.
FINANCIAL—SCM
Despite SCM's potential, relatively few companies utilize SCM as a tool to drive financial performance. Failure to make the financial—SCM connection is driven by several factors. Firstly, many executives continue to view SCM as a tactical cost-centre activity. Secondly, most SCM professionals do not speak the language of finance. Hence, they lack the ability to link SCM to key financial metrics and to articulate in enterprise language. Therefore, SCM strategic and tactical decisions cannot be made in a vacuum. Yet most scorecards and analyses of SCM initiatives are incomplete, as they are not from an enterprise-wide perspective. Decisions on items such as modes of transportation, sourcing, and replenishment are often based solely on operating expenses. If an enterprise-wide perspective is not adopted, the real value of SCM will not be achieved.
FINANCIAL METRICS
SCM drives key financial metrics such as revenue growth, percentage cost of goods sold, and days in inventory (DIL). The values of the gaps may be based on benchmarks from competitors, industry aggregates, historical performance, and aspirations derived from business intelligence tools. The value of the gaps can be measured using a variety of value-based financial measures such as free cash flow, economic profit and stock price.
The values of the gaps are an effective means to communicate to the organization the need for change and the potential value of improved SCM. For example, communicating that closing a 10-day gap in inventory is worth Rs 100 crores in cash flow and can potentially add Rs 100 per share in stock price is likely to generate greater motivation for change compared with the strategy of simply announcing the need to reduce inventory.
Gaps in financial metrics are driven by unique organizational factors such as sales mix, pricing strategies and outsourcing. The next step in the top-down approach is to link gaps in financial metrics to SCM-related business processes and strategies. A gap in profitability related to percentage cost of goods sold, for example, can be mapped to an SCM-related process such as distribution and logistics, which, in turn, is linked to a key activity such as warehouse management. Warehouse management is related to tasks such as receiving, put-away, pick, pack, and ship, to key performance indicators such as labour costs, average time per pick and pick accuracy. This mapping provides a better understanding of the cause-and-effect relationships between SCM business activities and financial performance.
The information provided above that provides a methodology for identifying specific areas of opportunity in supply chain. It also provides a disciplined approach for estimating the monetary benefits and understanding the critical success factors and risks of SCM solutions required for building a business case. Improvements in SCM business processes and strategies typically cannot completely close financial performance gaps. But for many companies, it can make a significant contribution.
Using SCOR model, it can be seen that supply chain integration and specific related measures of supply chain performance have a direct impact on a firm's financial performance.The supply chain metrics used by operating personnel focus attention on the day-to-day activities in the supply chain. By paying attention to the collective details of these daily activities, companies can boost their overall supply chain performance. And this in turn, will be manifested through a positive impact on over all metrics of financial performance.
STRATEGIC ALLIGNMENT
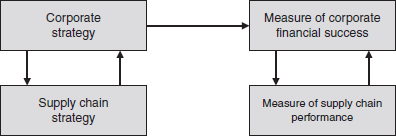
The link (Figure 25.1) between corporate performances and supply chain performance must begin with strategy. For this, the overall business (or business unit) strategy and SCM strategy needs to be aligned. With this the impact of SCM on corporate performance can be effectively measured.
Linkage approach incorporating EVA and the SCOR model is another way of adopting the ’balanced scorecard’. This tool identifies performance drivers and outcomes measures. The elements of the SCOR model are important SC-related performance drivers, while the corporate performance metrics represents important outcomes. Understanding the link between performance objectives and outcomes measures is fundamentals to achieving improved financial performance.
ECONOMIC VALUE ADDED (EVA)
EVA, developed by Stern Stewart, is recognized as a comprehensive measure of value creation. EVA provides a more comprehensive measure of profitability than traditional measures because it indicates how well a firm has performed in relation to the amount of capital employed.
EVA emphasis and isolates activities that help to drive value creation.Those activities may be generally categorized as revenues, costs and assets. By understanding the EVA drivers, managers become more aware of the impact of innovation, cost reduction, technology improvement, and capital base reductions on value creation. As such, the EVA drivers align well with the performance drivers in SCM.
An EVA orientation forces a firm to define its supply chain broadly. Aberdeen group, for example, found that integrating the firm's product development efforts with a supplier's engineering department through e-design technology may reduce time-to-time cycles by 10–15 per cent. In addition, this realtime collaboration may contribute to cost reductions by minimizing re-design time and uncovering opportunities for standardization. Since response time to market and cost control are key factors in market success, effective supply chain management on the input end of the chain may help to boost a firm's revenue through larger market share while lowering costs. These are the two key elements in improving economic value added.
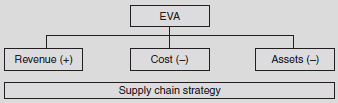
The action that can improve the profitability and value creation in the supply chain are generally under the firm's control. Better management of supply chain should have a major impact on revenue growth, cost reduction and asset turnover. The cost of capital is determined by outside forces and is essentially a given over which management has little control. Therefore, one of the keys to boosting EVA for the firms is to efficiently and effectively manage its supply chain (Figure 25.2).

SCM AND SCOR MODEL
While organizations may have existing process mapping techniques that could make the linkages, whereas the SCOR model provides an especially dynamic and flexible process for assessing supply chain effectiveness. The SCOR approach of standardizing process analysis works both within an organization and across multiple partners in a supply chain.
SCOR model can bring a measure of organization to the supply chain measurement process and provide the link to overall corporate performance. The model identifies the need for corporate level strategies, objectives and business plans as well as a starting point for identifying best practices concepts and tools as well as selecting appropriate metrics. As such it helps to overcome the disconnect between the supply chain metrics and overall corporate performance.
While the SCOR model is a useful tool which demonstrates the direct connection between the SCM and overall corporate financial performance, the model itself does not make that connection. Instead, the SCOR model focuses on hierarchy of planning and business goals, with requirement of objectives, strategies and metrics at multiple levels in the business structure.
SCOR Card Performance Metrics
These are the strategic supply chain metrics. These metrics include performance attributes that have direct impact on customer (customer facing) and the firm (internal facing). SCOR emphasizes the need to continuously focus metrics on the requirements on (first two rows indicate revenue, next five rows indicate cost, the last three rows indicate assets) the next higher level in the process to ensure continuity and support for corporate competitive performance targets (Figure 25.3).

EVA Component
SCOR model level 1 supply chain objective is consistent with customer needs is ‘perfect order fulfilment’ (reliability on delivery performance). Examples of objective to support ’perfect order fulfilment’ is ‘on-time delivery in full’ and ‘order shipped to schedule. High performance here can help the selling firm establish a competitive advantage leading to increase in revenue through capturing greater market share. This impacts on the revenue component of economic value added. The internal-facing level 1 metrics impact the cost and asset components of EVA.
Using economic value added as the measure of overall financial performance, the SCOR model process provides for linking the supply chain metrics to corporate financial goals. The focus is on the components of EVA typically under a firm's control-revenues, costs and assets.
Figure 25.4 shows the relationship between SCOR model metrics and the revenue components of EVA of a business firm. One strategy for increasing revenue is to improve customer satisfaction. The SCOR model provides the process to prioritize and select the most significant supply chain support strategies and performance indicators to achieve these goals.
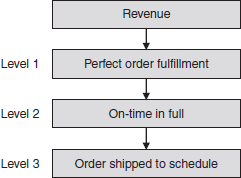
Perfect order fulfilment is a key attribute in SCOR model to support EVA which has many components. Therefore, a decision must be made on the appropriate second level supporting metrics. A metrics is ’on-time, in full, ’ which is critical in industries operating in a JIT environment. The number of processes that support ’on-time, in full’ (level 2) can prove to be significant. Continuing with decomposition process to level 3 to ensure that the efforts of those who impact level 1 perfect order fulfilments goals are properly focused. One of the level 3 performance indicators which are important is ’order shipped to schedule, ’ an important component of perfect order.
In addition to identifying the specific SCM measures, companies need to establish goals for each based on the desired level of performance. Goal setting at each of the levels in the SCOR model plays a major role in establishing the level of effort and creativity required to achieve the goal through continuous process improvement initiatives.
Hence, properly selected and linked performance measures will focus resources on contributing to overall corporate performance.
Cost Component
SCOR model can be linked to metrics in support of the cost component of the EVA (Figure 25.5). SCOR model identifies total SCM costs as the level 1 objective with supporting metrics in levels 2–4. ‘total SCM Costs’ objective is the sum of the costs of a number of significant functional operations. Here, only three types of costs (supply management costs, acquisition costs, receiving costs) have been mentioned and supply management is used as the level 2 performance measure.

The model focuses the managements attention on supply chain management to achieve the above objectives of reducing total SCM costs. The saving on transaction costs is a great deal of additional contribution to profit-boosting EVA.
The decomposition to levels 3 and 4 isolates supply management–related activities that are not included in the actual expenditure for goods and services. Here, product acquisition cost is shown as a level 3 metrics. Those costs may include salaries for all those involved in the purchasing process and other transaction costs. For example, one of those costs relates to the receiving activities, a component of acquisition costs. This is a level 4 metrics. There is a link between actions taken to reduce costs in receiving at level 4 to the effort to reduce total SCM costs at level 1.
Analysing each layer of the supply chain process for every function would produce a very complex network of linked process metrics. Hence, it is important to prioritize the opportunities. The goal is to focus on those factors that will most effectively support the improvement in the EVA cost elements.
Asset Component
A number of factors impact the level of assets a firm puts to use for delivering value to the market. To have a positive impact on EVA, the firm needs to minimize the asset levels used to deliver that value. Factors such as capital utilization, cash velocity, inventory turns, and cycle time reduction will impact how effectively the firm is managing its assets. The planning level of the SCOR model focuses on identifying a balance of supply chain resources necessary to meet supply chain requirements. One of the model's key performance attributes is asset level. The goal here is to provide just the right amount of asset to meet requirements. This balance will improve the model's ’cash-to-cash cycle time’ metric of the model.
Figure 25.6 identifies cash-to-cash cycle time as a level 1 metric. This metric represents the average number of days that elapse between paying for raw materials from suppliers and receiving payments for final products from customers. Cash-to cash cycle time is, in turn, directly impacted by asset turnover at level 2, which itself is impacted by the days of supply in inventory at level 3.Management intent on improving EVA through the asset component that can use the cash-to-cash cycle time metric to force attention on asset turnover by setting objective for the days of supply in inventory. A reduction in inventory should increase turnover at a consistent levels of sales. Ultimately, these actions are reflected in a reduction in cash-to-cash cycle time. In the end, the asset components of EVA are reduced assuming no increase in asset levels. Thus, as in the first two EVA components the asset component is clearly linked to the overall measure of corporate financial performance.

The benefits of the hierarchical mapping process described for the revenue, cost, and asset components of EVA are significant. The process helps to tie the goals and strategies at the operational level to measure the overall organizational performance that demonstrates the impact on shareholder value. The SCOR model provides a hierarchical framework. The overall performance measure of EVA provides the link to shareholder value. Hence, business firms must develop an understanding of how the day-to-day activities of managing the supply chain relate to corporate financial performance leading to healthy EVA.
SUMMARY
Supply chain management helps to provide higher returns to shareholders money. However, in general, a small percentage of companies use SCM to manage overall financial performance. The CFO must take a leadership role in making the financial-SCM connection. CFO should make this connection using a three step, top-down approach: first benchmarks key financial metrics and values gaps; second maps gaps to SCM business processes, activities, and KPI's; and third uses this information to explore and prioritize initiatives to improve SCM business processes. The valuation of gaps in key financial metrics should be extended to SCM-related information found in many business intelligence tools. These tools often provide detailed information at the activity and KPI level. Finally, improving most SCM professionals’ financial understanding is a critical factor in making the financial-SCM connection. SCM professionals must understand how SCM business processes and strategies impact key financial metrics and contribute to returns to shareholders.
REVIEW QUESTIONS
- Discuss various financial issues in managing supply chain.
- What is EVA (economic value addition)? Explain how supply chain can improve EVA.
- Explain how supply chain performance is keyed to EVA.
- Explain through SCOR model the implications of asset component on EVA.
INTERNET EXERCISES
- Visit http://www.valuebasedmanagement.net/methods_eva.html and find out how EVA is calculated and its application area.
- Visit http://www.accessmylibrary.com/article-1G1-133836607/evaluating-internal-operations-and.html for evaluation of SC performance using EVA.
- bm-Business Management is information sources on European business information. Visit http://www.bme.eu.com/article/The-value-of-supply-chain-management/ for information on financial issues in SC.
VIDEO LINKS
- Activity-based costing http://video.google.com/videoplay?docid=8333373775159231485%23
- Contracts—pricing mechanisms http://www.logisticsbureau.com.au/video-supply-chain-logistics.htm
PROJECT ASSIGNMENT
- Select a leading player in the automobile or FMCG or retail sector and map all the business process to understand the cause-and-effect relationships between SCM business activities and financial performance.