
Chapter 4. Content options
The traveler sees what he sees, the tourist sees what he has come to see.
Gilbert Keith Chesterton
This chapter covers
- Licensing content from third parties
- Creating user-generated content
- Creating mashups
The breadth and scope of content options are multiplying as more and more web services converge with mobile services, giving application developers increasing choices as to what to show users of their application. Developers need to deliver new, exciting content if they want to engage their users because an engaged user is a sticky user. This is especially important for location-based social networks.
You can incorporate many different data sources into your LBS application. The main characteristic of all this data is that each data point is associated with a location, that is, each has a latitude and a longitude. With the advent of user-generated content models, now LBS data can also contain user comments, photos, videos, and the like, and content ownership issues are becoming increasingly blurred.
Also, even though most user-generated location-based data originates from mobile devices, it’s also important to have an online component that lets your users view their own and others’ data online in a browser when they’re using a desktop computer.
In the end, it’s important to analyze the needs of your application and incorporate the right content and user-engagement models into your service for the success of your application. You also have to be explicit about terms of service so that your users know the specific limitations and provisions of your service. Figure 4.1 shows an LBS application with various layers of content.
Figure 4.1. Centrl.com application with restaurant and discount layers. Green icons (with knife and fork) represent the discount layer, and blue icons represent the restaurant reviews layer.

In this chapter we’ll discuss available content options for use in your LBS applications, and we’ll start by analyzing license and distribution models for this type of content.
4.1. Content licenses
Each piece of content available for LBS applications comes with an associated license. Content licenses can be divided into three categories: commercial, free to use, and open source.
- Commercial— You can pay for and license a wide variety of data from companies such as NAVTEQ or Tele Atlas to incorporate into your LBS application. For example, you can license gas station pricing data from NAVTEQ and use it in your application.
- Free to use— Depending on the terms of service (TOS), some commercial data providers allow you to use their data in your application without a license fee, provided you fulfill some conditions. For example, Yelp TOS allows some third parties to use their data, if they include a link to Yelp in their application. Yahoo!’s Upcoming property allows you to use their content if you have a noncommercial project (for commercial projects, you have to contact them and get permission explicitly).
- Open source— Some data sources, such as Wikipedia and OpenStreetMap, are open source (mostly Creative Commons License[1] and have licenses that allow anyone (commercial or not) to use the data.
Tip: The Openstreetmap License
OpenStreetMap data is published under an open content license, with the intention of promoting free use and redistribution of the data (both commercial and noncommercial). OSM used to be licensed under the Creative Commons Attribution-ShareAlike 2.0[2] license, but after extensive legal investigation work and community consultation, a new license has been created for it: the Open Database License (ODbL) from Open Data Commons[3] (ODC), which is more suitable for a map dataset.
Most of the content for LBS applications comes as a data feed in different distribution formats.
4.2. Content distribution formats
The top distribution formats for LBS applications are GeoRSS, GeoJSON, and KML. Each of these formats has its own strengths and weaknesses, so let’s look at each of them closely.
4.2.1. GeoRSS
GeoRSS[4] is an emerging standard for encoding location as part of a data feed. It’s derived from RSS (Really Simple Syndication), the most popular data feed and syndication format used by blogs and websites.
GeoRSS so far has two primary encodings called GeoRSS Geography Markup Language (GML) and GeoRSS Simple. GeoRSS GML is a formal Open Geospatial Consortium (OGC) GML Application Profile, and it supports a greater range of features than GeoRSS Simple, notably coordinate reference systems other than WGS 84 latitude/longitude. There’s also a W3C GeoRSS serialization that’s older and fully deprecated but still widely used. You shouldn’t be using W3C GeoRSS for new feeds, but you should be able to handle it to use existing and older feeds.
Listings 4.1 and 4.2 display GeoRSS-format data samples in two different flavors. The first listing displays the GeoRSS Simple format. This Simple serialization of GeoRSS is designed to be maximally concise, in both representation and conception.
Listing 4.1. Sample GeoRSS Simple feed
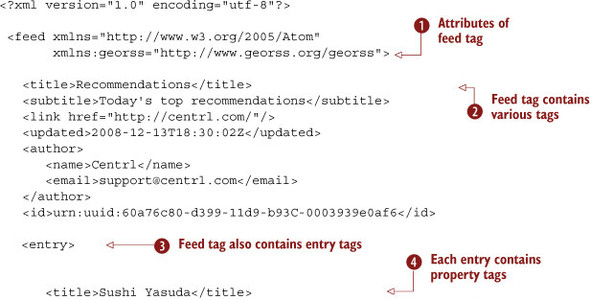
This sample displays some basic characteristics of the GeoRSS Simple format, such as how to specify the attributes of the
feed tag ![]() and how each feed tag may contain many other property tags
and how each feed tag may contain many other property tags ![]() as well as other entry tags
as well as other entry tags ![]() . Each entry tag in turn may contain many property tags
. Each entry tag in turn may contain many property tags ![]() .
.
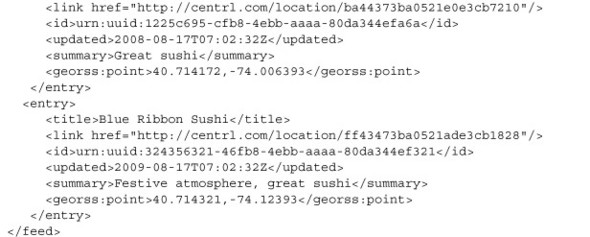
The following code sample displays the W3C GeoRSS format.
Listing 4.2. Sample W3C GeoRSS feed

This sample specifies the attributes of the rss tag ![]() . It also shows that each feed tag may contain many other property tags
. It also shows that each feed tag may contain many other property tags ![]() as well as other item tags
as well as other item tags ![]() . Each item tag in turn may contain many property tags
. Each item tag in turn may contain many property tags ![]() .
.
4.2.2. GeoJSON
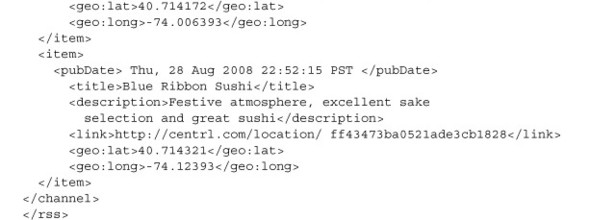
Based on JavaScript Object Notation (JSON), GeoJSON[5] is a new data format for encoding a wide variety of geographic features, including points, linestrings, polygons, multipolygons, and geometry collections. Figure 4.2 is the OpenLayers GeoJSON tool that makes it easy to create polygons and shapes in GeoJSON.[6]
6 mng.bz/8FW1
Figure 4.2. OpenLayers GeoJSON tool showing the GeoJSON encoding of shapes drawn on the map
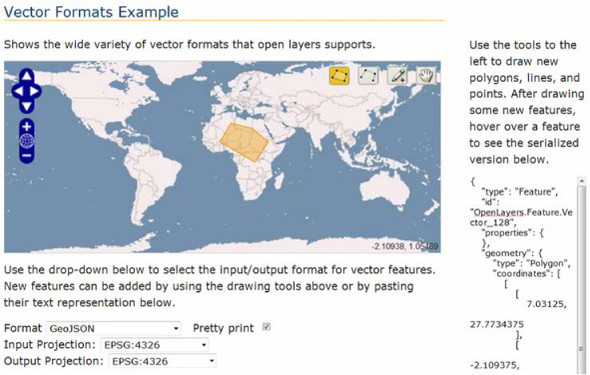
GeoJSON is a more compact data format than GeoRSS, which is based on XML. When compactness is important, GeoJSON presents a good solution. The following listing is an example of the GeoJSON format.
Listing 4.3. Sample GeoJSON feed
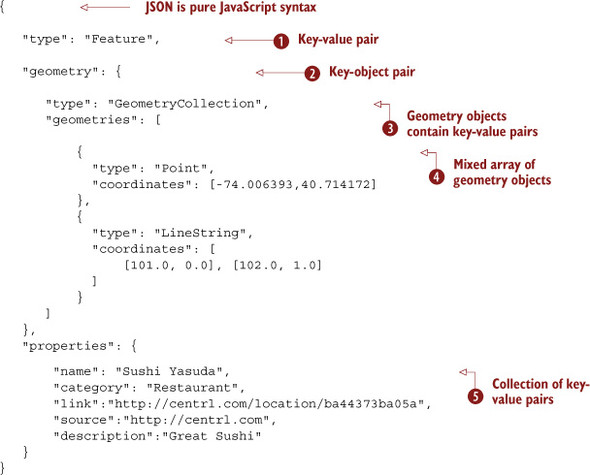

This JSON example (note that because JSON is pure JavaScript, this example can be parsed with eval directly) displays a simple
key-value pair ![]() and a key-object pair
and a key-object pair ![]() as well as a geometry object that contains a bunch of key-value pairs and also some key-object pairs
as well as a geometry object that contains a bunch of key-value pairs and also some key-object pairs ![]() . Each geometry collection is a mixed array of geometry objects
. Each geometry collection is a mixed array of geometry objects ![]() , and each object can contain a collection of property key-value pairs
, and each object can contain a collection of property key-value pairs ![]() .
.
4.2.3. KML
Keyhole Markup Language (KML)[7] is an XML-based language schema for expressing geographic annotation and visualization on existing or future web-based, two-dimensional maps and three-dimensional Earth browsers. KML was developed for use with Google Earth, which was originally named Keyhole Earth Viewer. It was created by Keyhole, Inc., which was acquired by Google in 2004.
KML is now an international standard of the Open Geospatial Consortium. KML support is increasing rapidly. Many applications display KML, including Google Earth, Google Maps, Google Maps for mobile, NASA World Wind, ESRI ArcGIS Explorer, Adobe Photoshop, AutoCAD, and Yahoo! Pipes.
The next listing displays some sample KML data showing some restaurants as Placemarks.
Listing 4.4. Sample KML feed
In this sample KML code, you see some basic XML tags with attributes and values, such as a Placemark ![]() . Each Placemark tag contains attributes such as name
. Each Placemark tag contains attributes such as name ![]() , description, and a Point tag
, description, and a Point tag ![]() .
.
Now that you’ve seen all the different formats that LBS content comes in, let’s look at your options for acquiring content, namely, either licensing content or letting your users create it, or using both options in a hybrid model.
4.3. Licensing content from third parties
Each piece of content you can place on a map is called a point of interest (POI). As the name implies, a POI is a specific location that someone may find useful or interesting. Many third parties license POI content. Many of these providers have POIs across categories. And some POI aggregators provide a simple interface to POI data from many different sources, like SimpleGeo and Factual. Here are some sources where you can license POI content to get you started, broken down into popular categories:
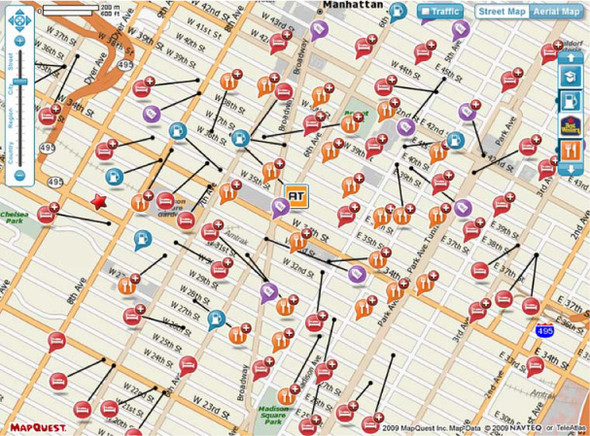
- Dining— Restaurants, cafes, fast-food establishments. This data usually comes with user reviews and ratings. Example sources are Citysearch.com,
Yelp.com, Qype.com, and 11870.com,[8] as shown in figure 4.3.
Figure 4.3. MapQuest map displaying restaurants, hotels, and gas stations in New York City
- Bars/clubs— Bars, clubs, lounges, drinking establishments. This data also usually comes with user reviews and ratings. Example sources
are Citysearch.com, Yelp.com, Qype.com,[9] and 11870.com.
- Lodging— Hotels, motels, resorts. An example source is Cleartrip.com, as shown in figure 4.3.
- Events— Concerts, meetings, festivals. Example sources are Upcoming.org,[10] Eventful.com,[11] and Zvents.com.[12]
12 mng.bz/3gs8
- Retail stores— This includes any local business with a retail storefront, such as a dry cleaner, grocery store, or clothing store. Example
sources are Yahoo! Local,[13] Citysearch.com, MerchantCircle.com, and Localeze.com.
- Services— Any local business that provides a service, such as plumbers and handymen. Example sources are Yahoo! Local and MerchantCircle.com.
- Real estate— This category includes any real estate that’s for sale or for rent or any real estate–related information such as historical pricing information. Example sources are the NYTimes Real Estate API, Zillow, and Trulia.
- Weather— Weather conditions and weather forecasts for a location on the map. Example sources are Weather.com and WeatherBug.com.
- News— Local news that belongs to a specific location. Example sources are Topix.com and Daylife.com.
- Photos and video— Geocoded photos and videos. Example sources are Flickr.com,[14] Panoramio.com, and Picasa.com.
- Traffic— Live traffic conditions on major highways. Example sources are Google Traffic and NAVTEQ’s Traffic.com.
- Travel— Travel information such as hotels, flights, and rental cars. An example source is Kayak.com.
- Friends— Current location of friends. Example sources are Facebook, Twitter, and Google Buzz.
The other option for acquiring content is letting your users create it. Usually most applications license some content from a third party and then let their users add their own data to it to create a unique set of data.
4.4. User-generated content
First-generation LBS applications featured mostly static content, like the Michelin Guide. Second-generation applications had some user-generated feedback associated with the actual content, like Lonely Planet. Third-generation LBS applications are now fully user-generated content (UGC), such as Wikimapia and Virtual Tourist. Users add comments, photos, and videos to locations on the map and share them with others, as shown in figure 4.4.
Figure 4.4. User-generated content for seafood restaurants in London on Google Maps

UGC is a fundamental trend that will shape the future of LBS applications. It’s important to architect your application in a way that encourages user participation and hence user-generated content. Some ways to encourage users to contribute content in your application are enabling voting, ranking all contributed content, enabling favoriting, and sharing of content in all social media channels.
Applications with user-generated content bring up some important points for discussion.
4.4.1. Privacy
For UGC LBS applications, privacy is in the hands of the users. They can choose what they want to do and how private or public they want to be. Privacy is handled by explicitly stating the terms of service for each application, so a user adding an entry to Wikimapia[15] knows exactly how this content will be consumed. If the content is private, obviously it should not be added to a publicly accessible database.
4.4.2. Quality
For any collaborative and open application where anyone can add any content they want, the issues of accuracy, fairness, quality, and the sustainable availability of creative work and effort come up. This is even more important for LBS applications with UGC, because the accuracy of LBS data may sometimes be crucial for the application. Nobody wants to drive half an hour for a restaurant that doesn’t exist. LBS applications have to be very careful about how they let users add content and how they verify this data through collaboration and community filtering.
4.4.3. Copyright issues
Liability is another big problem if users add copyrighted material (such as photos or media files) to your application as UGC. Again, crowd sourcing and collaborative filtering as well as very clear terms of service are key to preventing this kind of issue.
4.4.4. Implementation and performance
The next big problem is indexing all this spatial UGC content and serving it back to the users in real time. The database and application frontend have to be optimized for quick access to UGC in a given area. For a database, proper table layouts and picking the right indexes for the tables is very important.
Tip: PostGIS
PostGIS[16] adds support for geographic objects to the PostgreSQL[17] object-relational database. In effect, PostGIS spatially enables the PostgreSQL server, allowing it to be used as a backend spatial database for geographic information systems, much like ESRI’s SDE or Oracle’s Spatial extension. PostGIS follows the OpenGIS[18] Simple Features Specification for SQL[19] and has been certified as compliant with the Types and Functions profile. PostGIS is released under the GNU General Public License.
Now that you’ve learned how to acquire content from various sources and your users, next we’ll analyze how you can put together many different data sources to create useful applications quickly.
4.5. Mashups
A mashup (or web application hybrid) is a web page or application that merges data or functionality from more than one external source to create a new service that offers more functionality than the sources themselves offer individually. Mashups usually take little time to implement with fast integration because they use open APIs and data sources with Web 2.0 technologies such as Ajax. Figure 4.5 displays the architecture of a typical mashup.
Figure 4.5. The architecture of a typical mashup application. The mashup pulls data from various different sources, such as the web, RSS feeds, and databases, and puts it together (source: mng.bz/88yF).

For example, combining real estate data and recent crime information on a map creates a useful service for buyers to help them pick out the best neighborhood and the best real estate.
Mashups have become extremely popular in recent years because the cost of producing them has come down significantly (to near zero) with open APIs and data sources. The popular website ProgrammableWeb.com[20] officially lists 4298 mashups, created from 1440 APIs.
Now we’ll look at all the different kinds of mashups that you can create using these data sources.
4.5.1. Consumer mashups
Consumer mashups are aimed at the general public. For example, Intel’s Mash Maker[21] helps anyone create mashups, as shown in figure 4.6. It’s a browser plug-in—most functional with Firefox but also available for Internet Explorer—that lets end users create their own mashups on top of existing websites.
Figure 4.6. Intel Mash Maker in action mashing Facebook and Google Maps

4.5.2. Data mashups
Data mashups combine similar types of media and information from multiple sources into a single representation. One example is the Havaria Information Services Alert-Map,[22] which combines data from over 200 sources related to severe weather conditions, biohazard threats, and seismic information and displays them on a map of the world; another is Chicago Crime Map,[23] shown in figure 4.7, which indicates the crime rate and location of crime in Chicago.
Figure 4.7. Chicago Crime Map

4.5.3. Business mashups
Business mashups focus data into a single presentation and allow for collaborative action among businesses. Organizations can unlock and transform diverse sources of information into mashable assets such as feeds and widgets. These assets can then be dynamically assembled into new applications that address daily business challenges. Enabling business users in this way can reduce application backlog, lower development costs, and increase the reuse of existing assets to reach more people cost effectively.
For example, IBM Business Mashup Center[24] helps companies create business mashups easily and quickly.
24 mng.bz/ZdS5
Tip: Yahoo! Pipes
Yahoo! Pipes,[25] as seen in figure 4.8, is a web application from Yahoo! that provides a graphical user interface for building data mash-ups that aggregate web feeds, web pages, and other services, creating web-based apps from various sources, and publishing those apps. The application works by enabling users to pipe information from different sources and then set up rules for how that content should be modified (for example, filtering).
Figure 4.8. Yahoo! Pipes in action

Now let’s look at some code examples to get a better understanding of how to create mashups.
4.6. Our coding mashup example
Let’s create a mashup that shows Yelp[26] business listings on Google Maps.[27] For this, you’ll need to get a Yelp API key from http://www.yelp.com/developers and a Google Maps API key from http://code.google.com/apis/maps/signup.html. Figure 4.9 displays our mashup in action.
Figure 4.9. Yelp business listings on a Google Map

We can accomplish our mashup in two different ways. One of them is using KML format input and utilizing the Google Maps API to load POIs directly in JavaScript. This first technique is explained more in detail in section 4.6.1. The other technique, discussed in section 4.6.2, uses pure JavaScript to load each map item from a JSON feed.
4.6.1. Using KML
If you have a KML file with all the needed Yelp business listings, you can utilize the KML support in the Google Maps API and finish your mashup in two lines, as shown in the following listing.
Listing 4.5. Using the KML support in the Google Maps API
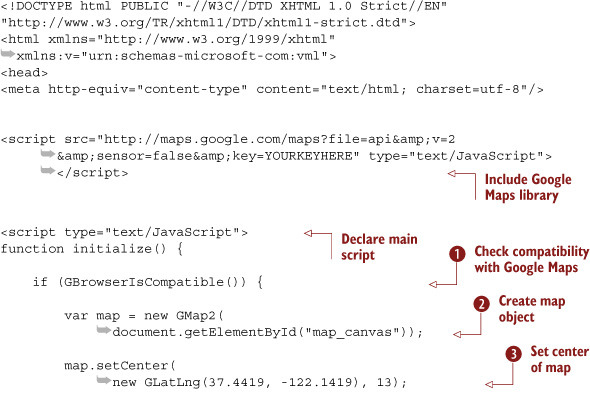

This KML code sample checks to see if the user’s browser is Google Maps compatible ![]() and then creates the map object
and then creates the map object ![]() and centers it
and centers it ![]() as well as sets its UI to the default
as well as sets its UI to the default ![]() . After this initialization step, we import the KML file into a KML object
. After this initialization step, we import the KML file into a KML object ![]() and add its contents to the map as an overlay
and add its contents to the map as an overlay ![]() . Overlays are Google Maps API constructs that displays data over an existing map; they can be manipulated as a group.
. Overlays are Google Maps API constructs that displays data over an existing map; they can be manipulated as a group.
4.6.2. Using JavaScript
If you don’t have a KML file but you want to pull data from Yelp dynamically as the user moves around the map, you can use JavaScript to parse the incoming data and create markers for each item on the map. The next listing shows the code for this mashup with comments.
Listing 4.6. Full source code for the Yelp/Google Maps mashup example

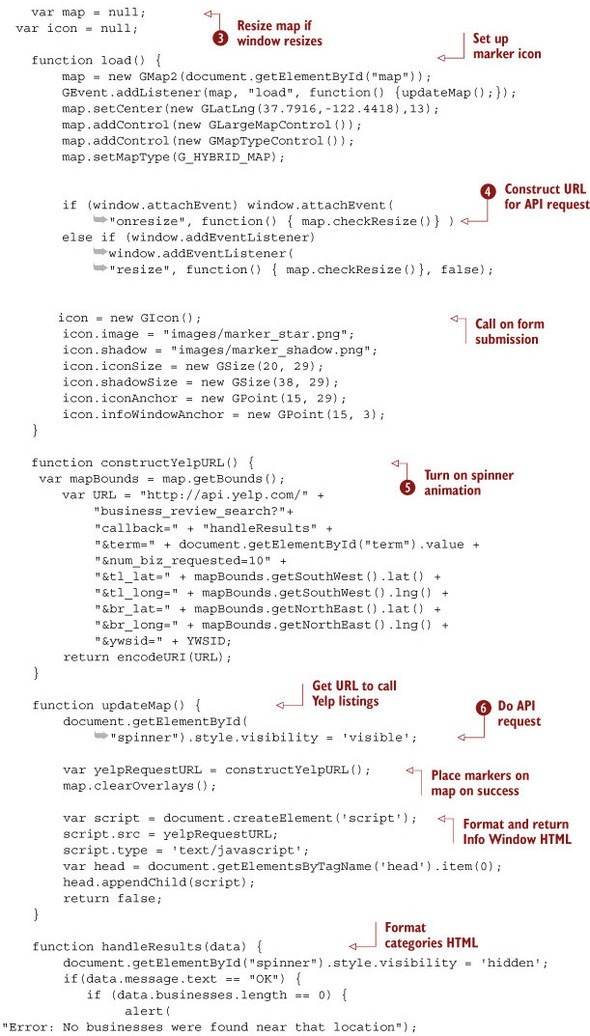
This code sample includes the Google Maps API libraries ![]() and initializes some variables first
and initializes some variables first ![]() . Then the main script
. Then the main script ![]() is loaded, which creates the map object
is loaded, which creates the map object ![]() and centers it
and centers it ![]() . The code also makes sure that the map will be resized if the user resizes the browser window
. The code also makes sure that the map will be resized if the user resizes the browser window ![]() .
.
The code then constructs the URL to call to get the data from Yelp ![]() . It clears the existing overlays, calls the URL
. It clears the existing overlays, calls the URL ![]() , puts up a loading graphic
, puts up a loading graphic ![]() , and then starts processing the returned data. It’s important to check the validity of the returned data because the code
won’t get any data from Yelp for some areas in the world.
, and then starts processing the returned data. It’s important to check the validity of the returned data because the code
won’t get any data from Yelp for some areas in the world.
If some listings are returned from Yelp, they’re added to the map as markers ![]() after each field is formatted properly. After all the markers are created, the first marker is opened automatically
after each field is formatted properly. After all the markers are created, the first marker is opened automatically ![]() so that the map shifts to that location to show the first listing to the user.
so that the map shifts to that location to show the first listing to the user.
4.7. Summary
Location is the most exciting new dimension to the data that we consume daily. Soon almost all phones in the world will include location capabilities, and users will require the use of location in all applications. It’s important to integrate content with location in your app in such a way that users can make use of it in the best possible way.
When adding content to your LBS application, you have to be careful about the licensing terms of the content. Analyze the terms carefully.
After you decide on a content source, choose the best distribution format according to your deployment platform. If you have a lot of data that has to be downloaded to a mobile phone over unreliable data connections, choose a lighter format, such as GeoJSON. Give your users the option to add their own comments, photos, and videos, but be careful about accuracy, quality, and privacy issues. Implement community filtering features.
If you add many sources of content to your application, don’t overcrowd the map with too many markers. Use map layers, so that users can turn data on and off as they like.
Also, localization of all your content (licensed or user generated) is an important issue. Make sure to include language as a field in your database for each POI, and think of ways to automatically translate the text to each requested language.
In the next chapter we’ll examine some consumer applications that leverage LBS.