Listening to students’ voices to enhance their experience of university
Abstract:
In recent years, the student voice has gained significant prominence in assessing and monitoring quality assurance of learning and teaching. In a number of countries, governments use student satisfaction and other academic outcome measures to assess institutional performance. While universities and governments have actively used quantitative data gathered from student surveys, there has been a limited emphasis on analysis, reporting and triangulation of qualitative data at national, university, faculty, course, campus, support services and unit of study or teacher levels. This chapter outlines the results of the course experience questionnaire in one Australian university with graduating students in the arts, education and social sciences disciplines.
Introduction
Student feedback has gained significant prominence at universities worldwide over recent years. In a number of countries such as the United States, the United Kingdom, Australia and Sweden, governments are using student feedback to assess institutional performance as part of an effort to improve learning and teaching quality, promote good practice and, in some cases, reward better performing institutions (Shah and Nair, 2011). In the UK, the government uses the results of the National Student Survey (NSS) to publish institutional performance for public access. In Australia, the results of the various national student surveys have been published on the My University website (http://myuniversity.gov.au/) for public access from 2012. The government also plans to use student experience measures in assessing and rewarding public universities.
The Australian federal government monitors university student experience via the national Australian Graduate Survey (AGS) which includes the Course Experience Questionnaire (CEQ) and Graduate Destination Survey (GDS). The results were made publicly available through the new My University website in 2012. In the United Kingdom, the government has been using the NSS since 2005 and the results are accessible to the general public via the Unistats website. The Australian government also plans to introduce a new instrument called the University Experience Survey, which aims to measure student engagement and experience at early and later stages of their studies.
In 2003, the Australian government announced the Learning and Teaching Performance Fund (LTPF). The fund was established in order to reward financially institutions demonstrating excellence in learning and teaching each year, with the first funding round in 2006 (DEST, 2006). The LTPF score was largely based on graduate satisfaction and self-report outcome measures in the CEQ and GDS.
The LTPF ranking appeared to be controversial, with some critiques of the validity of the instruments used (Scott 2006, Scott et al., 2008), methodology of rankings of universities’ performance (Coates, 2007), fairness of reward distribution (Moodie, 2005; Scott et al., 2007), data collecting processes and response rates which differed too widely among universities to be comparable (Armitage, 2006; Coaldrake, 2005). According to James et al. (2010), the influence of performance-based funding on improvements in undergraduate education is far from clear, despite the attention which has been drawn to the quality of teaching for the best part of a decade or more, with a lack of evidence of improvement. This aligns with the suggestion of Shah and Nair (2011) that performance-based funding and other government policies such as external quality audits in the last 10 years have not contributed significantly to the enhancement of student experience and retention in Australian higher education.
One possible explanation for this may be a limited focus on the qualitative data from student feedback surveys. Internationally, observations of insufficient use of comments collected through national student surveys were reported in Canada (Chambers, 2010) and most recently in Thailand (Wongsurawat, 2011). The literature on thematic analysis of students’ comments and on case studies describing their systematic use is also limited. When they are mentioned in research reports on learning and teaching in higher education, it is often from the point of view of processing difficulties, particularly from the viewpoint of the vast resource requirements needed to analyse such data (Bolden and Moscarola, 2000; Richardson, 2005).
At the same time, these qualitative data seem to be a lot richer than may be expected. For example, an analysis of the business graduate comments by Kabanoff et al., (2003) suggests that there are recurring themes regarding various aspects of the course, which are untapped in existing evaluations of university experience. Research that investigated students’ use of online faculty rating sites has found that students believe qualitative comments to be more informative than quantitative rankings (Davison and Price, 2009; Kindred and Mohammed, 2005). This is supported by other studies indicating that some closed-ended survey items, even if based on extensive psychometric studies, may not cover issues that are really important for students because they may reflect a teacher-centred or researchers’ preconceived framework (Bolden and Moscarola, 2000; Kabanoff et al., 2003; Scott, 2006).
On further investigation, the open-ended comments are likely to identify reasons for statistical results which may be different from what researchers assume (Palermo, 2003; Scott, 2006; Scott et al., 2008). Thus, to be successful, it is suggested that universities focus more on what students have to say in their own words and incorporate such feedback into their priorities (Poindexter, 2006; Symons, 2006a, 2006b). Additionally, it is suggested that tailoring survey contents to what students themselves find highly important should be considered (Scott, 2006). The quantitative and qualitative data should complement each other, as together they cover a broader range of student views on their university experience (e.g. Erickson and Kaplan, 2000; Harper and Khu, 2007; Jackson and Trochim, 2002; Ory, 2000; Schwarz, 1999, Shah and Nair 2009, etc.).
This chapter outlines the case of one Australian university that made significant use of qualitative comments collected through its various surveys over the last decade. All surveys used by the university invite respondents to answer two questions in their own words: ‘What were the best aspects of your course/unit?’ and ‘What aspects of your course/unit are most in need of improvement?’. The comments are automatically classified by the CEQuery qualitative analysis tool into five main domains and 26 sub-domains. The CEQuery trend results are integrated into consolidated annual course and unit reports in order to identify better key ‘hot spots’ for improvement and actual solutions from the student perspective to these improvement priorities. The high importance areas are also used in course accreditation and review, and to validate rating items on surveys.
This chapter outlines the analysis of qualitative data generated at the university by the national CEQ in 2010 in arts, education and social sciences disciplines. In total, approximately 2475 student open-ended comments have been analysed via CEQuery.
Method
The CEQ instrument and participants
Each year, graduates from all Australian higher education institutions who complete a coursework (non-research) degree are invited to complete the CEQ. This instrument aims to measure graduate perceptions of various aspects of the course they have just completed. Participants are asked to indicate the extent to which they agree or disagree with each of three core statements using a five-point Likert-style scale, where one represents strong disagreement and five strong agreement. The items cover such areas of course experience as quality of teaching, course outcomes, and overall satisfaction. At the end of the questionnaire respondents are asked to provide comments on the best aspects of their course, and on those most needing improvement.
In this study, more than 1200 arts, education and social science graduates from the university completed the CEQ. The response samples were representative of the university’s profile in terms of gender, age, college, level of study, campus, indigenous descent, payment mode, and language background. The respondents made some 2475 ‘best aspect’ (BA) and ‘needs improvement’ (NI) written comments about their course experience.
Findings
Table 2.1 presents the results on BA and NI in the arts, education and social science disciplines which is benchmarked with the overall university results for the same year.
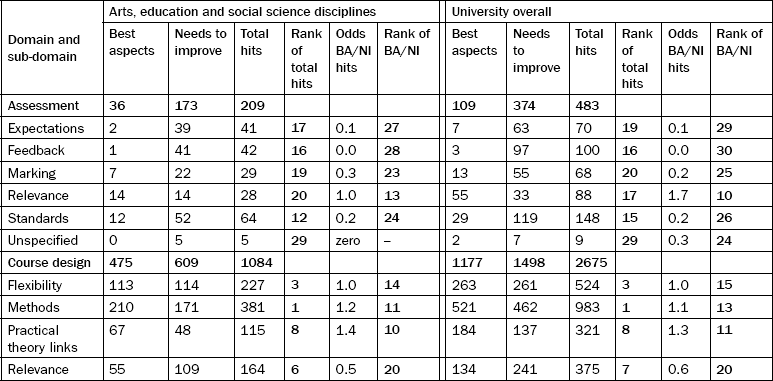
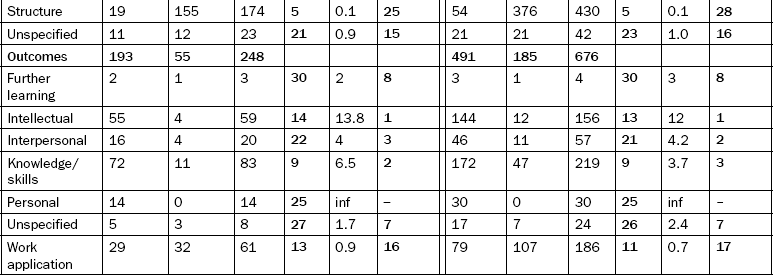

The analysis of qualitative data in Table 2.1 benchmarks the arts, education and social sciences disciplines with the overall university results. The left side of the table shows the results for the arts, education and social sciences disciplines and right side the overall university. The domain in the CEQuery software is in the far left column. The number of hits on BA and NI are shown in the respective columns with the total in the column entitled ‘total hits’. The ‘rank of total hits’ column outlines the domain that has attracted the highest number of BA/NI comments. The most important columns to interpret the results include: odds BA/NI hits and the rank of BA/NI (highlighted in grey shades). These two columns outline the proportion of BA comments with NI. The highest ranked domains, for example assessment expectation which is ranked 27 in arts, education and social sciences and 29 in overall university, suggest an area where there are more NI comments then BA.
The total number of ‘hits’ (BA+NI) for each domain and sub-domain is taken to be a proxy measure of perceived importance. This is because it is assumed that, if students choose to write (positively or negatively) about an aspect of their university experience in an open-ended comment, it must be of importance to them. It is also assumed that the ratio of BA to NI comments in each sub-domain (BA / NI) is a proxy measure of perceived quality. For example, when the ratio of BA to NI comments is 2.0 it means that there are twice as many ‘best aspect’ comments as ‘needs improvement’ comments. When the ratio is 0.5, it means that there are half as many ‘best aspect’ comments as there are ‘needs improvement’ comments.
The key findings based on the analysis in Table 2.1 suggest the following:
▀ the findings in arts, education and social sciences disciplines are comparable with the findings for the overall university
▀ the areas where NI comments are more than BA (areas requiring improvement) include the following:
▀ the areas where BA comments are more than NI (areas performing well and needs to be maintained) include the following:
Discussion
The findings in this chapter illustrate the effectiveness of students’ voices via their comments in highlighting good practice as well areas that need improvement. Based on this type of feedback, the university in this case study introduced a range of measures to improve the student experience with all cohorts of students, in particular first-year student retention. In terms of student experience, the university introduced a number of student survey instruments which measured student experience at various levels, including university level; early student experience; course and unit of study; and teacher level. The qualitative and quantitative data from student surveys have been used at the university for a number of years, along with other performance data related to learning and teaching, and research to introduce changes to enhance the student experience. For example, the university introduced one of the best student complaints management systems to track and manage student complaints so that continuous feedback could be obtained from the student cohort.
In addition, the university developed a system of communicating such feedback back to its staff at different levels. In this instance, performance reports were developed and provided to faculties, schools, administrative units and individual lecturers to review performance on an annual basis. The university gives responsibility to associate deans and heads of administrative units to review performance and outline areas needing improvement as a direct result of student feedback and other performance data. The recurring areas needing improvement are endorsed by the university-level committee, and actions are discussed with all students and staff. The university systematically monitors the impact of the promised improvements in the next cycle of student surveys to monitor the extent to which the improvements have made an impact on student experience.
On first-year student retention initiative, the university conducts student attrition surveys and actions are taken to improve student retention. Some of the key improvements implemented include: enhanced academic advice; university-wide student assessment project; identification of students at risk and providing relevant academic support; phone contact with all first-year students to find out how they are progressing; and setting student blogs for students to provide feedback.
The impact of all this work has been both positive and significant. The university’s retention rates overall increased by 4.2 per cent from 2004 to 2006 and for first-year undergraduate students, the increase was 3.9 per cent over that time. On a broader measure, over the same period, the university improved its overall satisfaction rating on the CEQ by 6.4 per cent. Benchmarking indicated that this was the third largest increase on this CEQ measure in the sector during that time. The average change from 2004 to 2006 across the whole sector was 1.5 per cent.
Conclusion
This chapter provides an example of a way in which qualitative data generated by student feedback surveys analysed by CEQuery can be used in Australian higher education as an effective and robust tool to track and improve the student experience, as part of a broader system of student feedback. Specifically, it shows how the qualitative data from the national CEQ is helping this university to examine strategies and initiatives implemented over ten years.
The example shows that efficient use of student qualitative feedback, and timely response to it, helps increase student satisfaction and retention. It confirms that the triangulation of various sources of data is important in comprehensive understanding and improving student experience inside and beyond the classroom. Additionally, through inviting comments which are systematically analysed and acted upon, students are given more opportunities to influence decision-making in both academic and non-academic spheres of university life. This approach engages staff at all levels to review qualitative data regularly, along with quantitative measures to identify areas that may require follow-up action, with a view to ensure a greater consistency of quality in the student experience.
Effective analysis and use of both quantitative and qualitative feedback, along with other performance measures, have enabled the university to identify areas needing improvement in a systematic manner. The triangulation of various performance data, such as student experience and academic outcomes, is important to identify trends, patterns and recurring themes requiring attention.
References
Armitage, C. Teaching Prize Fund “Dreadful”. The Australian. 22, 2006. [November].
Bolden, R., Moscarola, J. Bridging the Qualitative-quantitative Divide. Social Science Computer Review. 2000; 18(4):450–460.
Chambers, T. What I hear you saying is … Analysis of Student Comments from the NSSE. College Student Journal. 2010; 44(1):3–24.
Coaldrake, P. Let an Umpire Decide: the Government’s Latest University Ranking System Aims to Improve Teaching Standards, but these Critics Claim it is More Likely to Retard Real Progress. The Australian. 17, 2005. [August].
Coates, H. Universities on the Catwalk: Models for Performance Ranking in Australia. Higher Education Management and Policy. 2007; 19(2):1–17.
Davison, E., Price, J. How Do We Rate? An Evaluation of Online Student Evaluation. Assessment & Evaluation in Higher Education. 2009; 34(1):51–65.
DEST (Commonwealth Department of Education Science and Training), Learning and Teaching Performance Fund Advisory Group: Report to the Minister. 2006. [Canberra ACT].
Erickson, P. I., Kaplan, C. P. Maximizing Qualitative Responses about Smoking in Structured Interviews. Qualitative Health Research. 2000; 10:829–840.
Jackson, K. M., Trochim, W. M. K. Concept Mapping as an Alternative Approach for the Analysis of Open-ended Survey Responses. Organisational Research Methods. 2002; 5(4):307–336.
James, R., Krause, K., Jennings, C. The First Year Experience in Australian Universities: Findings from 1994 to 2009. University of Melbourne: Centre for the Study of Higher Education; 2010.
Harper, S. R., Khu, G. D. Myths and Misconceptions about using Qualitative Methods in Assessment. New Directions for Institutional Research. 2007; 136:5–14.
Kabanoff, B., Richardson, A., Brown, S. Business Graduates’ Perception of the Quality of their Course: a View from their Workplace. Journal of Institutional Research. 2003; 12:1–12.
Kindred, J., Mohammed, S. N. ‘He will Crush You like an Academic Ninja!: Exploring Teacher Ratings on Ratemyprofessors. com’, Journal of Computer-Mediated. Communication. 10(3), 2005.
Moodie, G. Comment on the Learning and Teaching Performance Fund. The Australian. (17):2005. [August].
Ory, J. C. Teaching Evaluation: Past, Present and Future. New Directions for Learning and Teaching. 2000; 83:13–18.
Palermo, J., 20 Years On-Have Student Evaluations Made a Difference? Melbourne. Proceedings of the 2003 Australian Universities Quality Forum. 2003:11–13. [June, 136–40. ].
Poindexter, M. Are Colleges Listening to Students? Connection: New England’s Journal of Higher Education. 2006; 20(4):19–20.
Richardson, J. T. E. Instruments for Obtaining Student Feedback: a Review of the Literature. Assessment & Evaluation in Higher Education. 2005; 30(4):387–415.
Schwarz, N. Self-reports: How Questions are Answered. American Psychologist. 1999; 54(2):93–105.
Scott, G., Accessing the Student Voice: Using CEQuery to Identify what Retains Students and Promotes Engagement in Productive Learning in Australian Higher Education. 2006. [Canberra: ACT].
Scott, G., Grebennikov, L., Johnston, K. Study of Australian multi-campus universities. Journal of Institutional Research. 2007; 13(1):1–23.
Scott, G., Grebennikov, L., Shah, M., Using Qualitative Data to Prove and Improve Quality in Australian Higher Education Melbourne. Proceedings of the 2008 Australasian Higher Education Evaluation Forum. 2008:2–3. [October, 97–111].
Shah, M., Nair, C. S. Using Student Voice to Improve Student Satisfaction: Two Australian Universities the Same Agenda. Journal of Institutional Research (South East Asia). 2009; 7(2):43–55.
Shah, M., Nair, S. The Influence of Strategy and External Quality Audit on University Performance: a Case of an Australian University. Tertiary Education and Management. 2011; 17(2):139–150.
Symons, R. In their Own Words: Finding Out What Students Think about their University Learning Experience. Synergy. 2006; 23:34–35.
Symons, R. Listening to the Student Voice at the University of Sydney: Closing the Loop in the Quality Enhancement and Improvement Vycle. In: paper presented at the 2006. Coffs Harbour, NSW: Australian Association for Institutional Research Forum; 2006:21–24. [November].
Wongsurawat, W. What’s a Comment Worth? How to Better Understand Student Evaluations of Teaching. Quality Assurance in Education. 2011; 19(1):67–83.