Tools for effective student feedback
Abstract:
Over the last twenty years student feedback data has become an important means of driving quality assurance and improvement in university education. This chapter reviews different kinds of assessments that have been used for this purpose. It begins with an overview of a series of survey instruments. This provides context for investigating the relationship between external and internal assessments, which is undertaken via a range of psychometric analyses. The results of these analyses highlight a number of discontinuities between the instruments used for external and internal quality management. These are explored, and a final concluding section looks at prospects for taking a more considered approach.
An assessment of student feedback instruments
With the rise of the higher education quality assurance agenda over the last few decades, institutions in Australia have sought ways to assess and monitor the quality of teaching. A range of approaches have been considered and implemented, such as peer review and certificate training courses, but the most pervasive quality assurance mechanism would appear to be the development of survey systems to capture student feedback.
A range of different survey systems have been developed. For instance, since the early 1990s Australia has made good use of the nationally administered Course Experience Questionnaire (CEQ) (GCA and ACER, 2009), which is sent to all graduates soon after degree completion. Institutions have also developed their own subject-specific teaching quality instruments (TQI) for local use in evaluating teaching. Since 2007, a cross-institutional survey of student engagement (the Australasian Survey of Student Engagement, AUSSE) has implemented a Student Engagement Questionnaire (SEQ).
Together, these instruments provide a useful sample of the kinds of feedback mechanisms being used by Australian universities. As such, this chapter concentrates on exploring these instruments, their interrelationships, and how they are or could be used for quality assurance and enhancement. As this focus suggests, the chapter does not attempt to offer a comprehensive audit of all existing instruments – a very complex exercise and one which many institutions themselves find difficult to produce even for their own internal activities.
The chapter begins with an overview of the three listed assessments – the CEQ, TQI and SEQ. This provides context for investigating the relationship between the CEQ and TQI instruments, which is undertaken via a range of psychometric analyses. The results of these analyses highlight a number of discontinuities between the instruments used for external and internal quality management. These are explored, and the concluding section looks at prospects for a more considered approach.
Overview of selected assessments
Course Experience Questionnaire
Since the early 1990s recent graduates in Australia have been invited to respond to the nationally administered Course Experience Questionnaire (CEQ). This instrument is deployed alongside the Graduate Destination Survey (GDS) around four months after graduation.
The CEQ is designed to probe key elements of the university learning process and, in doing so, obtain data on the quality of teaching. The original CEQ scales were developed with an assumption of a strong association between the quality of student learning and student perceptions of teaching. Working from research conducted on student learning styles in the UK in the 1970s and 1980s (Perry, 1970; Marton and Saljo, 1976; Pask, 1976; Entwistle and Ramsden, 1983), the items and scales are specifically tuned to obtain information on what were considered by Ramsden (1991a) to be the defining elements of teaching and its organisation. By considering the extent to which pedagogy encourages a ‘deep’ rather than a ‘surface’ understanding of concepts and materials, the original CEQ attempted to provide a domain-neutral indicator of university course quality. A scale measuring generic skills was added soon after the development of the original CEQ.
A series of new CEQ scales were developed in response to concerns within the higher education community that the original 24-item questionnaire did not examine a sufficiently broad range of aspects of the university student experience. In the late 1990s, research was conducted (McInnis, Griffin, James and Coates, 2001) to expand the existing instrument so as to include other important facets of student experience while retaining the integrity of the existing CEQ. An additional 25 items forming five new scales were introduced in the 2002 questionnaire.
While the current instrument measures 11 facets of the student experience using 49 items, only three scales and 13 ‘core’ items are administered by all institutions. Table 6.1 shows these 13 CEQ items, which in this chapter are henceforth labelled C1 to C13. Together, these provide measurement of ‘good teaching’, ‘generic skills’ and ‘overall satisfaction’, although they also combine psychometrically to measure a single dimension of student satisfaction (Coates, 2007).
Table 6.1
Core CEQ items considered in this analysis
| Label | Item |
| C1 | The lecturers put a lot of time into commenting on my work |
| C2 | The lecturers normally gave me helpful feedback on how I was going |
| C3 | The lecturers of this course motivated me to do my best work |
| C4 | My lecturers were extremely good at explaining things |
| C5 | The lecturers worked hard to make their subjects interesting |
| C6 | The lecturers made a real effort to understand difficulties I might be having with my work |
| C7 | The course helped me develop my ability to work as a team member |
| C8 | The course sharpened my analytic skills |
| C9 | The course developed my problem-solving skills |
| C10 | The course improved my skills in written communication |
| C11 | As a result of my course, I feel confident about tackling unfamiliar problems |
| C12 | My course helped me to develop the ability to plan my own work |
| C13 | Overall, I was satisfied with the quality of this course |
All 49 CEQ items share a common response scale. Respondents are asked to express their degree of agreement or disagreement on a five-point scale. By convention, only the ‘strongly disagree’ and ‘strongly agree’ points on this scale are labelled on the survey form. In line with the initial development work led by Ramsden (1991b), and the findings of GCCA and ACER (2000) and Mclnnis et al. (2001), the five-point response categories are interpreted in this report as ‘strongly disagree’, ‘disagree’, ‘undecided’, ‘agree’ and ‘strongly agree’.
Teaching Quality Instruments
To complement the CEQ’s lagging, summative and global perspective on the quality of teaching, institutions have developed their own local teaching quality instruments. While several external forces have shaped the formation of institutional survey systems, they have primarily taken shape for the purpose of continuous quality improvement. This context has driven a particular approach to design and delivery. Rather than relying on standard instruments, for instance, each institution has instead developed its own survey forms. Administration strategies have been shaped in line with various institutional policies and practices, and the nature and use made of resulting data has varied considerably across each institution. In general, however, these assessments tend to be administered toward the end of a period of teaching and ask questions about instructional quality and other key facets of institutional support and provision.
A meta-analysis of these TQI was conducted in an attempt to build an integrated understanding of what they are trying to assess (Coates et al., 2010). This involved sourcing TQI items from all Australian public institutions, and transcribing and thematically analysing the items. The thematic analysis built on the earlier research of Davies et al. (2008).
Analysis of the TQI produced a series of broad insights, even before the main analysis had begun. One of the earlier insights was of the vast diversity in the instruments being used, despite the fact that they could all loosely be seen as attempting to measure the same broad phenomena. Further, many of the instruments had clear measurement deficiencies, such as ambiguous or double-barrelled items, unclear response scales, or unclear explanatory statements. While often being deployed for high-stakes use within institutions, critical review of the forms suggests that many would be unlikely to meet quality requirements set by institutional ethics review boards or peer-review research. While no detailed attempt is made here to explain these characteristics, it would appear that they arose due to the non-technical and consensus-driven nature of the development.
After an iterative process of thematic analysis and expert review, the TQI meta-analysis suggested that the instruments attempted to measure the following broad phenomena: clear aims, clear expectations, organisation, teacher enthusiasm, teacher respect for student, access to teachers, teacher knowledge, overall satisfaction, student enthusiasm, stimulating interest, feedback, responsiveness, assessment, student needs, competency development, student encouragement, teaching resources, and workload. As this list suggests, these phenomena tap into diverse and core characteristics of teaching competence and performance. In line with their focus, the instruments did not attempt to measure students’ contribution to education outcomes – the extent to which students themselves actively engaged in effective forms of learning and development.
The analysis presented later in this chapter concentrates on TQI items from a sample of four institutions. Together, this sample goes some way to reflect the diversity of items and response formats used across the system, to the extent this is possible. Table 6.2 presents items for each of the four institutions (A, B, D and E) along with their labels. The response categories provided on the survey forms are not shown in Table 6.2, but they are worth noting in order to register their diversity. Specifically:
Table 6.2
Institution-specific TQI items
| Label | Item |
| A1 | Activities within the subject provided relevant learning experiences |
| A2 | I understood the concepts presented in this subject |
| A3 | The subject content was presented at an appropriate pace |
| A4 | The subject content was presented at an appropriate level of difficulty |
| A5 | The teaching materials and resources were helpful in directing my learning |
| A6 | Teaching materials and resources were culturally inclusive |
| A7 | This subject helped me develop my thinking skills (e.g. problem solving, analysis) |
| A8 | My ability to work independently has increased |
| A9 | I understood the assessment requirements of the subject |
| A10 | I received useful feedback on my learning |
| A11 | I was able to access quality support (e.g. from lecturers, other students, the university) when appropriate |
| A12 | Overall I was satisfied with the quality of this subject |
| B1 | I had a clear idea of what was expected of me in this subject |
| B2 | This subject was well taught |
| B3 | This subject was intellectually stimulating |
| B4 | I received helpful feedback on how I was going in this subject |
| B5 | In this subject, lecturers showed an interest in the academic needs of the students |
| B6 | I felt part of a group of students and lecturers committed to learning in this subject |
| B7 | There was effective use of computer-based teaching materials in this subject |
| B8 | Web-based materials for this subject were helpful |
| B9 | Overall, I was satisfied with the quality of the learning experience in this subject |
| D1 | The unit addressed the learning outcomes stated in the Unit Outline |
| D2 | The criteria for each assessment component were clearly identified |
| D3 | The workload in this unit was appropriate |
| D4 | There was reasonable opportunity for interaction with lecturers |
| D5 | I was given useful feedback on my assessment work |
| D6 | Submitted work was returned to me in a reasonable time frame |
| D7 | The unit stimulated my interest in the subject area |
| D8 | I gained a good understanding of the subject matter |
| D9 | I enhanced my skills in this unit |
| D10 | The unit was well taught |
| E1 | In this subject the learning objectives were made clear to me |
| E2 | The assessment criteria were clearly stated at the beginning of the subject |
| E3 | Feedback on my work was provided to me in time to prepare for other assessment tasks |
| E4 | This subject helped me gain a better understanding of an area of study |
| E5 | My learning in this subject was well supported by access to lecturers |
| E6 | My learning in this subject was well supported by access to other assistance |
| E7 | My learning in this subject was well supported by learning tasks |
| E8 | My learning in this subject was well supported by learning resources |
| E9 | My learning in this subject was well supported by eLearning (if used) |
| E10 | Overall I was satisfied with the quality of this subject |
![]() University A students are asked to register their responses using a seven-point rating scale of ‘strongly disagree’, ‘disagree’, ‘mildly disagree’, ‘undecided’, ‘mildly agree’, ‘agree’ and ‘strongly agree’;
University A students are asked to register their responses using a seven-point rating scale of ‘strongly disagree’, ‘disagree’, ‘mildly disagree’, ‘undecided’, ‘mildly agree’, ‘agree’ and ‘strongly agree’;
![]() University B students respond using the following scale: ‘strongly disagree’, ‘disagree’, ‘neither agree nor disagree’, ‘agree’ and ‘strongly agree’;
University B students respond using the following scale: ‘strongly disagree’, ‘disagree’, ‘neither agree nor disagree’, ‘agree’ and ‘strongly agree’;
![]() University D’s questionnaire uses the same form as University B except that the middle category is labelled ‘neutral’; and
University D’s questionnaire uses the same form as University B except that the middle category is labelled ‘neutral’; and
![]() the eight-point University E rating scale is most extensive: ‘strongly disagree’, ‘disagree’, ‘mildly disagree’, ‘mildly agree’, ‘agree’, ‘strongly agree’, ‘unable to judge’ and ‘N/A’.
the eight-point University E rating scale is most extensive: ‘strongly disagree’, ‘disagree’, ‘mildly disagree’, ‘mildly agree’, ‘agree’, ‘strongly agree’, ‘unable to judge’ and ‘N/A’.
Student Engagement Questionnaire
The Student Engagement Questionnaire (SEQ), developed as part of the Australasian Survey of Student Engagement (AUSSE) (Coates, 2008), was designed to usher in a new way of thinking about education quality in Australian higher education. Rather than focusing on the quality of teaching and service provision, emphasis is placed first on student participation, and then on how institutions are supporting this. It is useful, given this shift in perspective, to provide a brief background on the concept itself.
‘Student engagement’, broadly considered, is defined as students’ involvement with activities and conditions likely to generate high-quality learning and institutions’ support of people’s involvement (NSSE, 2009; Coates, 2009). The concept, which is clearly central to higher education quality, provides a practical lens for assessing and responding to the significant dynamics, constraints and opportunities facing higher education institutions. It provides key insights into what students are actually doing, a structure for framing conversations about quality, and a stimulus for guiding new thinking about best practice.
Student engagement touches on aspects of teaching, the broader student experience, learners’ lives beyond university, and institutional support. It operationalises research that has identified the educational practices linked empirically with high-quality learning and development (see, for instance: Astin, 1979, 1985, 1993; Pace, 1979, 1995; Chickering and Gamson, 1987; Pascarella and Terenzini, 1991). While students are seen to be responsible for constructing their knowledge, learning is also seen to depend on institutions and staff generating conditions that stimulate and encourage involvement.
Surprisingly, given its centrality to education, information on student engagement has only recently been available to Australasian higher education institutions. The AUSSE, conducted with 25 institutions for the first time in 2007, 29 institutions in 2008 and 25 in 2009, provides data that Australian and New Zealand higher education institutions can use to engage students in effective educational practices. Through a licence agreement, the AUSSE builds directly on foundations laid by the North American National Survey of Student Engagement NSSE, 2009).
The SEQ collects data from institutionally representative samples of first- and later-year students, and provides a foundation for analysing change over time. Although these are not assessments of value added in the statistical sense, examining change across year levels provides insight into the extent to which people are being challenged and pushing themselves to learn. An increase in engagement in active learning practices, for instance, indicates that learners are investing more time constructing new knowledge and understanding. It also indicates that learners are intrinsically more engaged in their work, and hence more likely to be developing their knowledge and skill.
Since 2008, institutions have also had access to a Staff Student Engagement Survey (SSES), which provides a complement to the student collection. The SSES is a survey of academic staff about students, which builds directly on the foundations set by the Faculty Survey of Student Engagement (FSSE) (FSSE, 2009). The Staff Student Engagement Questionnaire (SSEQ) measures academics’ expectations for student engagement in educational practices that have been linked empirically with high-quality learning and development. Data is collected from staff, but students remain the unit of analysis.
Compared with student feedback, relatively little information from academic staff is collected in Australasian higher education. The SSES builds on processes developed in recent surveys of staff and leaders (Coates, Goedegebuure, van der Lee and Meek, 2008; Scott, Coates and Anderson, 2008). Information from staff is important, as it can help identify relationships and gaps between student engagement and staff expectations, and engage staff in discussions about student engagement and in student feedback processes. It can also provide information on staff awareness and perceptions of student learning and enable benchmarking of staff responses across institutions.
The suite of survey instruments – the Student Engagement Questionnaire (SEQ) and the Staff Student Engagement Questionnaire (SSEQ) – that are used in the AUSSE collect information on around 100 specific learning activities and conditions along with information on individual demographics and educational contexts. The instruments contain items that map onto six student engagement scales:
![]() Academic Challenge – the extent to which expectations and assessments challenge students to learn;
Academic Challenge – the extent to which expectations and assessments challenge students to learn;
![]() Active Learning – students’ efforts to actively construct knowledge;
Active Learning – students’ efforts to actively construct knowledge;
![]() Student and Staff Interactions – the level and nature of students’ contact and interaction with teaching staff;
Student and Staff Interactions – the level and nature of students’ contact and interaction with teaching staff;
![]() Enriching Educational Experiences – students’ participation in broadening educational activities;
Enriching Educational Experiences – students’ participation in broadening educational activities;
![]() Supportive Learning Environment – students’ feelings of support within the university community; and
Supportive Learning Environment – students’ feelings of support within the university community; and
![]() Work Integrated Learning – integration of employment-focused work experiences into study.
Work Integrated Learning – integration of employment-focused work experiences into study.
The instruments also contain items that map onto seven outcome measures. Average overall grade is captured in a single item, and the other six are composite measures which reflect responses to several items:
![]() Higher-Order Thinking – participation in higher-order forms of thinking;
Higher-Order Thinking – participation in higher-order forms of thinking;
![]() General Learning Outcomes – development of general competencies;
General Learning Outcomes – development of general competencies;
![]() General Development Outcomes – development of general forms of individual and social development;
General Development Outcomes – development of general forms of individual and social development;
![]() Career Readiness – preparation for participation in the professional workforce;
Career Readiness – preparation for participation in the professional workforce;
![]() Average Overall Grade – average overall grade so far in course;
Average Overall Grade – average overall grade so far in course;
![]() Departure Intention – non-graduating students’ intentions on not returning to study in the following year; and
Departure Intention – non-graduating students’ intentions on not returning to study in the following year; and
![]() Overall Satisfaction – students’ overall satisfaction with their educational experience.
Overall Satisfaction – students’ overall satisfaction with their educational experience.
In summary, through the SEQ and SSEQ, the AUSSE provides information about students’ intrinsic involvement with their learning, and the extent to which they are making use of available educational opportunities. As such, it offers information on learning processes, is a reliable proxy for learning outcomes, and provides diagnostic measures for learning-enhancement activities. This data can be a powerful means for driving educational change, particularly when linked with feedback from staff.
Connecting the dots: external and internal links
Introduction
Clearly it is essential that there be useful synergies between internal and external quality assessments like those described above. Deliberate triangulation and diversification of information helps strength assessment and review, but it would be counterproductive if evidence from one assessment inadvertently contradicted that of another. This could promote confusion, and might lead to change that in fact resulted in quality reduction rather than improvement.
To explore this matter, the following analysis examines relationships between institution-specific teaching quality instruments (TQI) and the nationally administered Course Experience Questionnaire (CEQ). The analysis was replicated across four universities, each with different TQI items listed in Table 6.2. As noted, in broad terms TQI are designed for continuous improvement while the CEQ is used for summative external evaluation.
This being the case, it is imperative that TQI are empirically aligned with CEQ. If institutions undertake internal improvement activities in response to TQI and these TQI are unaligned with the metrics used for external quality monitoring, then the internal or external systems or their linkages are corrupted. Of course, institutions may look to enhance aspects of education that are not considered by external quality-monitoring activities. But on those measures where there are overlaps, one would expect a relatively high level of relationship. Clearly, it would be counterproductive if institutions enhanced the quality of their teaching and learning and were penalised for this. Equally, it would be perverse if institutions which did not enhance the quality of their teaching received recognition for so doing.
Before comparing scores from the sets of items, it is important to determine whether the items themselves in fact measure the same phenomenon. If institutions’ own forms measure different things to those on the CEQ, then driving internal change in ways that register as external improvement could be difficult. The key question is, therefore, whether the institution forms and the CEQ items measure the same constructs.
A series of covariance analyses were conducted to test this proposition. The first looked at whether the CEQ and institution-specific items displayed high levels of consistency when scaled together. The second looked at whether the two groups of items loaded on a single underpinning factor. Finally, confirmatory psychometric modelling was undertaken using Rasch item response modelling to test whether the items provided uni-dimensional measurement of a single construct. This was assessed by reviewing how the items distribute along a single variable, the relative difficulty of each item, and by reviewing mean square statistics which expose the fit of the item to the variable.
In addition to the analysis of construct invariance, a series of analyses were conducted to test the relationship among the CEQ and TQI scale means. While it may make little sense to progress to analysis of the empirical relationship between national and institutional mean scores if the instruments are not measuring the same construct, this relationship is frequently explored in practice and it is worth doing so here. For this, all scale scores were converted into a common reporting metric ranging from 1 to 5.
The analyses below are undertaken within the business field of education. The results are based on 1,022 observations in total. Data was secured by inviting students at four institutions to complete a purposefully designed survey form that contained the 13 CEQ items along with the institution-specific TQI items. In line with the design of the study and data requirements, each analysis was replicated separately for each institution.
Cross-institutional results
Figure 6.1 presents the variable map produced from Rasch analysis of the CEQ and University A items. It shows the distribution of the item demand items on the right-hand side of the variable, and the distribution of students’ responses on the left-hand side. Review of the item distribution indicates that it is bi-modal, and that the CEQ and university A instruments are largely measuring different constructs. The institution-specific items are considerably ‘easier’ to agree with than those of the CEQ, and do not appear to scale in an integrated fashion along the common latent variable.
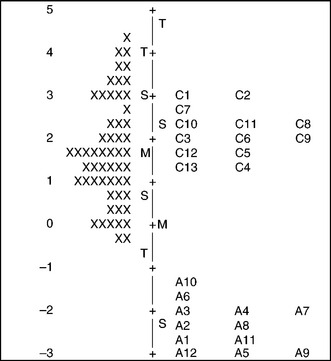
Figure 6.2 shows the mean square fit statistics arising from the Rasch analysis. These have an expected value of 1.0, and figures greater than 1.3 are conventionally read as reflecting a random relationship between the item and latent variable. The CEQ items show good fit to the variable. Many of the institutional items, by contrast, show a loose connection with the variable, particularly item A4, ‘The subject content was presented at an appropriate level of difficulty’.
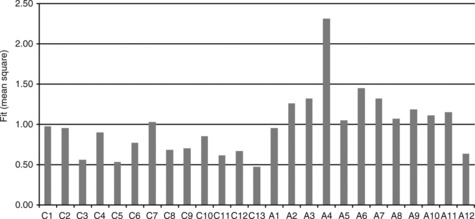
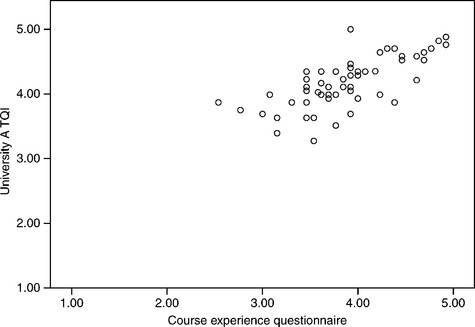
Figure 6.3 charts the relationship between the mean scale scores. The correlation between these was only 0.72. The plot confirms a relatively loose relationship between the external and internal metrics, particularly at the lower end of the distribution.
The presentations given above were repeated for universities B, C, D and E. The results showed that:
![]() for University B most of the national and institution-specific items do work together to map out a common underpinning variable, and that the overall relationship between the items is relatively linear;
for University B most of the national and institution-specific items do work together to map out a common underpinning variable, and that the overall relationship between the items is relatively linear;
![]() the relationship between the CEQ and University D TQI appears relatively robust, although three items do not fit the common variable;
the relationship between the CEQ and University D TQI appears relatively robust, although three items do not fit the common variable;
![]() there appears to be a rough but relatively linear relationship between the CEQ and University D TQI scale means, with the correlation between these being 0.69; and
there appears to be a rough but relatively linear relationship between the CEQ and University D TQI scale means, with the correlation between these being 0.69; and
![]() items in the University E TQI have the lowest relationship to the CEQ. As with University A, the variable map shows that these items cluster together rather than spreading out to measure a common variable. Almost all of the University E items have mean square fit statistics that lie beyond the acceptable limit of 1.3 – the exceptions are E6, E7, E8 and E10. The correlation between the national and institutional scores is 0.62.
items in the University E TQI have the lowest relationship to the CEQ. As with University A, the variable map shows that these items cluster together rather than spreading out to measure a common variable. Almost all of the University E items have mean square fit statistics that lie beyond the acceptable limit of 1.3 – the exceptions are E6, E7, E8 and E10. The correlation between the national and institutional scores is 0.62.
A psychometric disconnect
Overall, these results highlight an alarmingly low level of relationship between the CEQ and TQI. While based on a relatively small amount of evidence, the broad observation holds across various contexts and instruments. There may be several reasons why the CEQ and institutional items appear to measure different constructs.
First, the frame of reference may be different. The institutions’ instruments may seek students’ perspective on a single subject whereas the CEQ seeks an aggregate perspective on the overall course. In principle, if the instruments are measuring the same constructs, the measurement process should not be confounded by this difference in the level of analysis.
Second, the response scales used by institutions and the CEQ do not align. Variations include the number and labelling of response categories, the presence and positioning of ‘not applicable’ categories, and the direction of the wording. The direction of wording is likely to introduce most disturbance into the response process, for respondents who complete many such forms may be unlikely to check the precise labelling of the categories before responding. All categories were labelled in a uniform direction for the current analysis, but this alone may have given rise to the response interference effect in question.
Third, and most pointedly, it may be that the instruments do indeed measure different constructs. This is likely given that the instruments were developed at different times for different purposes, and because the institution-specific forms have not been psychometrically validated.
Concluding thoughts on a more considered approach
The above analysis is highly concerning, for it suggests that an institution may be investing considerably to drive continuous improvement in one direction while being prompted to move in another direction by external reinforcement. Ideally, of course, internal and external assessments should be empirically aligned to ensure a non-random relationship between local practice and national estimates of performance.
Developing assessments of student learning that provide sound information to students, institutions and systems remains one of the biggest challenges for higher education. Considerable progress has been made in the last few decades, yet as the above results affirm there are frequent disconnects between the methods used for learning, improvement and accountability purposes. It remains common for classroom practice to play out in completely separate ways to the organisation-level assessments managed by institutional researchers, and for both of these to operate in relative isolation from external quality assurance activities.
There are of course distinct contexts and focuses that shape practice at each of these levels of analysis, yet they share the common basic goal of assessing what learning has been achieved. There would appear to be value, therefore, in identifying approaches that work towards an integration across these levels of analysis. In light of the evidence such as that given above, it is very tempting to consider what productive steps may be taken to align internal and external quality assessments. To this end, this section reviews a new approach being developed with reference to AUSSE, the third assessment considered in this chapter. This involves developing a local version of the external assessment that can help institutions form direct links between local teaching practice and institutional, national and even international performance.
The idea builds on a considerable amount of work undertaken in the USA, and which is scheduled for development and validation in Australasia in 2010. It involves production and use of what, in the USA, has been referred to as the CLASSE (NSSE, 2009). The CLASSE is a class-level adaptation of the USA NSSE, the AUSSE’s parent survey (Ouimet and Smallwood, 2005).
The CLASSE is composed of two instruments. As with the SEQ, a student instrument asks students how frequently they participate in effective learning activities within a specific subject. Like the SSEQ, a teacher instrument asks the instructor of that subject how important the defined learning practices are for student success. As with the AUSSE and SSES, student and teacher outcomes can then be contrasted to identify practices that are occurring less frequently than desired or expected. This form of gap analysis provides a highly useful means of stimulating productive change.
Given the results of the analyses above, the advantages of this close integration between internal and external quality assessment instruments are obvious. Subject-level insights about the quality of student engagement can aid instructors’ and institutions’ efforts to enhance the adoption of engaging educational practices. Framed by institutional or national findings, local results can help spotlight engaging pedagogical practices, shape teaching and learning experiences, and inform staff development activities. The common psychometric thread running through these different levels of analysis – levels which have been hitherto disconnected – provides a firm foundation of evidence for this work.
Our capacity to improve university education hinges in important ways on the technology that is used to define, assess, monitor and enhance core phenomena. This chapter has reviewed key initiatives undertaken in Australian higher education over the last twenty years. It has provided summary descriptions of three different kinds of student feedback instruments, and explored the empirical relationships between those used widely in Australia for quality assurance and continuous improvement for some time. Review of the instruments, and results from this analysis, implied that a new more strategic approach to aligning the assessment of university education could facilitate more advanced forms of assessment and improvement. As suggested by way of conclusion, finding better ways to link how learners, teachers, institutions and systems use feedback information to improve remains a core challenge for research and practice.
References
Astin, A.W. Four Critical Years: Effects of college on beliefs, attitudes and knowledge. San Francisco: Jossey-Bass; 1979.
Astin, A.W. Achieving Educational Excellence: A critical analysis of priorities and practices in higher education. San Francisco: Jossey-Bass; 1985.
Astin, A.W. What Matters in College: Four critical years revisited. San Francisco: Jossey-Bass; 1993.
Chickering, A.W., Gamson, Z.F. Seven principles for good practice in undergraduate education. AAHE Bulletin. 1987; 39(7):3–7.
Coates, H. Universities on the catwalk: models for performance ranking in Australia. Higher Education Management and Policy. 2007; 19(2):1–17.
Coates, H. Attracting, Engaging and Retaining: New conversations about learning. Australasian Student Engagement Report. Camberwell, Australia: Australian Council for Educational Research; 2008.
Coates, H. Development of the Australasian Survey of Student Engagement (AUSSE). Higher Education. 2009; 60(1):1–17.
Coates, H., Goedegebuure, L., van der Lee, J., Meek, L. ‘The Australian academic profession: a first overview’. Report of the International Conference on the Changing Academic Profession Project, 2008. Hiroshima University: Research Institute for Higher Education; 2008.
Coates, H., Hirschberg, J., Lye, J., The matching of quality of teaching indicators and the Course Experience Questionnaire. Paper presented at the 15th Australasian Teaching Economics Conference, Hamilton, New Zealand, 2010.
Davies, M., Hirschberg, J., Lye, J., Johnston, C., A systematic analysis of quality of teaching surveys. Department of Economics Working Papers Series 1050. University of Melbourne, 2008.
Entwistle, N.J., Ramsden, P. Understanding Student Learning. Manuka: Croom Helm Australia; 1983.
Faculty Survey of Student Engagement Available online at:. Faculty Survey of Student Engagement (FSSE)., 2009.. http://nsse.iub.edu [(accessed 1 February 2009).].
GCA, A.C.E.R. Graduate Course Experience, 2008: The Report of the Course Experience Questionnaire. Parkville, Australia: GCA, 2009.
GCCA, A.C.E.R. 1999 Course Experience Questionnaire. Australia: GCCA: Melbourne; 2000.
Marton, F., Saljo, R. On qualitative differences in learning: outcome as a function of the learner’s conception of the task. British Journal of Educational Psychology. 1976; 46:4–11.
Mclnnis, C., Griffin, P., James, R.H., Coates, H.B. Development of the Course Experience Questionnaire. Canberra, Australia: Department of Employment, Training and Youth Affairs; 2001.
National Survey of Student Engagement Available online at:. National Survey of Student Engagement (NSSE), 2009. (accessed 1 February 2009).. http://nsse.iub.edu
Ouimet, J.A., Smallwood, R.A. Assessment measures: CLASSE – the class-level survey of student engagement. Assessment Update. 2005; 17(6):13–15.
Pace, C.R. Measuring Outcomes of College: Fifty years of findings and recommendations for the future. San Francisco: Jossey-Bass; 1979.
Pace, C.R. From good practices to good products: Relating good practices in undergraduate education to student achievement.. Boston, USA: Paper presented at the Association for Institutional Research; 1995.
Pascarella, E.T., Terenzini, P.T. How College Affects Students: Findings and insights from twenty years of research. San Francisco: Jossey-Bass; 1991.
Pask, G. Conversational techniques in the study and practice of education. British Journal of Educational Psychology. 1976; 46:12–25.
Perry, W.G. Forms of Intellectual and Ethical Development in the College Years: A scheme. New York:Holt: Rinehart & Winston; 1970.
Ramsden, P. A performance indicator of teaching quality in higher education: The Course Experience Questionnaire. Studies in Higher Education. 1991; 16(2):129–150.
Ramsden, P. Report on the CEQ trial. In: Linke R., ed. Performance Indicators in Higher Education Volume 2. Canberra, Australia: Australian Government Publishing Service, 1991.
Scott, G., Coates, H., Anderson, M. Learning leaders in times of change: Academic leadership capabilities for Australian higher education. Sydney, Australia: Carrick Institute for Learning and Teaching in Higher Education; 2008.