
9
Using Microsoft Sentinel
The previous chapter covered recipes for enabling and using Microsoft Defender for Cloud.
This chapter will teach you how to implement Microsoft Sentinel, collect data, set up security alerts through analytics, and create automated responses.
By the end of this chapter, you will have learned the following recipes to make the most effective use of Microsoft Sentinel:
- Reviewing the components of Microsoft Sentinel
- Enabling Microsoft Sentinel
- Creating automation
- Setting up a data connector and analytics rule
Technical requirements
This chapter assumes that you have an Azure AD tenancy and an Azure subscription from completing the recipes in previous chapters of this cookbook. If you skipped straight to this section, the information needed to create a new Azure AD tenancy and an Azure subscription for these recipes is included in the following list of requirements.
For this chapter, the following are required:
- A device with a browser, such as Edge or Chrome, to access the Azure portal https://portal.azure.com.
- An Azure AD tenancy and Azure subscription; you may use existing or sign up for free: https://azure.microsoft.com/en-us/free.
- An Owner role for the Azure subscription.
- A Global Administrator or Security Administrator role on the Tenant Azure AD.
Terminology reference
We will start with the terminology used with Microsoft Sentinel:
- Security operations (SecOps): This function deals with managing the incorporation of day-to-day security monitoring needs of an organization into IT operations.
- Security information and event management (SIEM): A SIEM system analyzes real-time security data and events. It can be used as a single pane of glass and a birds-eye view of security operations across an organization’s estate; it is often utilized as the primary tool to support a security operations center (SoC) and Soc-as-a-Service.
- Security orchestration, automation, and response (SOAR): SOAR works with SIEM to provide a full solution set of capabilities that allow the automation and orchestration of responses once critical incidents occur.
Now that we have covered the terminology, we will move on to our first recipe for this section.
Enabling Microsoft Sentinel
Sentinel is Microsoft’s cloud-based SIEM and SOAR tool; it is a complete solution that can provide security and event data aggregation, threat analysis, and response across public cloud, hybrid, and on-premises environments.
This recipe will teach you to enable Microsoft Sentinel in your environment.
Getting ready
This recipe requires the following:
- A device with a browser, such as Edge or Chrome, to access the Azure portal: https://portal.azure.com
- Access to an Azure subscription, where you have access to the Owner role
How to do it…
This task consists of the following step:
- Enabling Microsoft Sentinel
Task – enabling Microsoft Sentinel
Perform the following steps:
- Sign in to the Azure portal: https://portal.azure.com.
- In the search bar, type Microsoft Sentinel; select Microsoft Sentinel from the list of services shown.

Figure 9.1 – Search for the Microsoft Sentinel resource
- When Microsoft Sentinel opens, click on Create from the top-menu bar.

Figure 9.2 – Create a Sentinel instance
- From the Add Microsoft Sentinel to a workspace page, review the information regarding the 31-day free trial, then click Create a new workspace.

Figure 9.3 – Create a new workspace for Microsoft Sentinel
- From the Basics tab of the Create Log Analytics workspace page, fill in the required information for Project Details and Instance details and click Review + Create.

Figure 9.4 – Create Log Analytics workspace
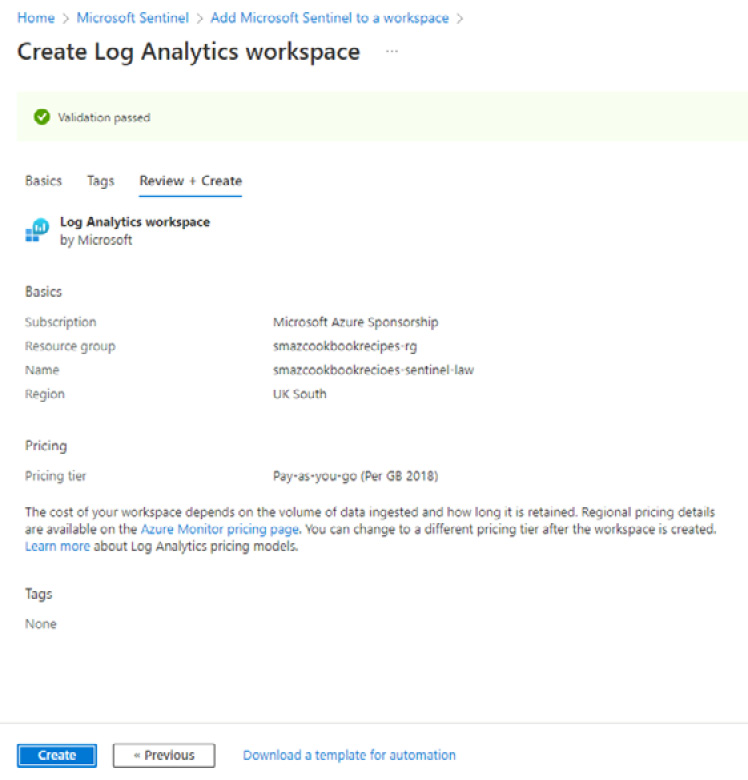
Figure 9.5 – Create workspace validation

Figure 9.6 – Add Sentinel to a workspace
- You will receive a Successfully added Microsoft Sentinel notification to confirm that it was added to the created Log Analytics workspace.
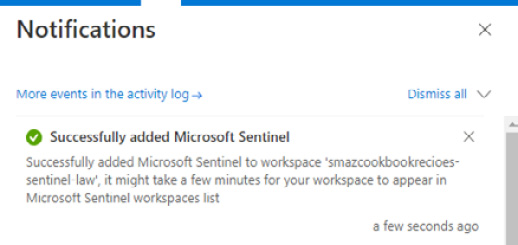
Figure 9.7 – Notification of success
- You will be redirected to the Microsoft Sentinel page and presented with a page banner displaying a Microsoft Sentinel free trial activated message. You must review the billing information provided in the Learn more hyperlink. Then click OK to dismiss the banner.

Figure 9.8 – Sentinel landing page
- You will be directed to the Get started tab on the News & guides page in the General section of Microsoft Sentinel.

Figure 9.9 – Sentinel Get started tab
- On the Get started tab, you will see three keys steps that we will follow in the remaining recipes in this chapter; for clarity, they are as follows:
- Collect data
- Create security alerts
- Automate & orchestrate

Figure 9.10 – Sentinel Get started steps
This task to enable Microsoft Sentinel is completed.
How it works…
Microsoft Sentinel collects security signaling (security log data) and examines this signal data for patterns that may indicate an attack; this then correlates event information to identify potentially abnormal activity. Issues that are identified create an automated alert response, and remediation is carried out. This relationship is represented in the following diagram:

Figure 9.11 – Sentinel positioning
Azure Sentinel provides the following core capabilities:
- Collects: Security data is collected across an organization
- Detects: Threats are detected through AI-powered threat intelligence
- Investigates: Threat-generated critical incidents are investigated
- Responds: Responses are generated through automated reactions and remediations
The end-to-end security operations capabilities of Sentinel are represented in the following diagram:

Figure 9.12 – Sentinel security operations capabilities
See also
Should you wish to learn more about this and related topics, you can refer to the following Microsoft Learn articles:
- Microsoft Sentinel documentation: https://learn.microsoft.com/en-us/azure/sentinel/
- Quickstart: Onboard Microsoft Sentinel: https://learn.microsoft.com/en-us/azure/sentinel/quickstart-onboard
- Microsoft Learn training modules and paths: https://learn.microsoft.com/en-us/training/browse/?expanded=azure&products=azure-sentinel
Reviewing Microsoft Sentinel components
Now that we have learned how to enable Microsoft Sentinel in your environment, this recipe will provide you with a high-level overview of its capabilities and components.
As a cloud-based SIEM and SOAR solution, Sentinel can act as the tooling to support a SOC and SOC-as-a-Service approach.
Getting ready
This recipe requires the following:
- A device with a browser, such as Edge or Chrome, to access the Azure portal: https://portal.azure.com
- Access to an Azure subscription, where you have access to the Owner role
- The subscription should have Microsoft Sentinel enabled
How to do it…
This task consists of the following step:
- Review the Microsoft Sentinel components
Task – Microsoft Sentinel
Perform the following steps:
- Sign in to the Azure portal: https://portal.azure.com.
- From the search bar, type Microsoft Sentinel; click Microsoft Sentinel from the list of services shown.

Figure 9.13 – Search for the Microsoft Sentinel resource
- When Sentinel opens, click on the workspace created in the previous recipe.

Figure 9.14 – Select the Sentinel workspace
- When the Sentinel workspace opens, you will see the Selected workspace you are viewing. The left-hand menu bar is categorized into the following settings:
- General
- Threat management
- Content management
- Configuration

Figure 9.15 – The Workspace menu
- The Overview (Preview) page, under the General section, is split into four main operational area tiles as follows:
- Incidents
- Automation
- Data
- Analytics (alert rules)

Figure 9.16 – Sentinel operational areas
- Under Threat management, click Incidents and review the information presented by the capabilities of this area of Sentinel.
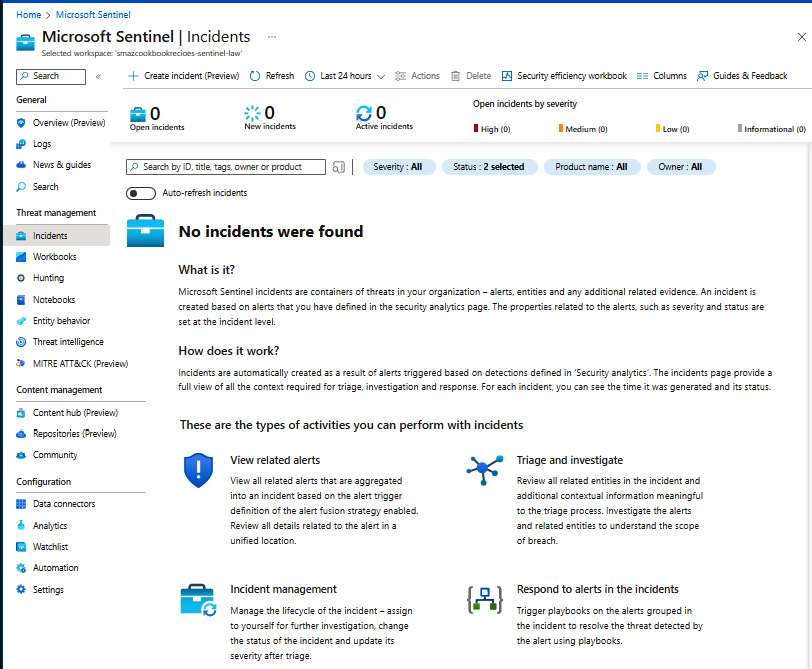
Figure 9.17 – Incidents
- Under Configuration, click Automation and review the information presented by the capabilities of this area of Sentinel.

Figure 9.18 – Automation
- Under Configuration, click Data connectors and review the information presented by the capabilities of this area of Sentinel.

Figure 9.19 – Data
- Under Configuration, click Analytics and review the information presented by the capabilities of this area of Sentinel.

Figure 9.20 – Analytics
This task to review the components and capabilities of Microsoft Sentinel is completed.
How it works…
For this recipe, we reviewed the components and capabilities of Microsoft Sentinel as a cloud-based SIEM and SOAR solution that can act as the tooling to support a SOC and SOC-as-a-Service approach.
See also
Should you wish to learn more about this and related topics, you can refer to the following Microsoft Learn articles:
- Microsoft Sentinel documentation: https://learn.microsoft.com/en-us/azure/sentinel/
- Microsoft Learn training modules and paths: https://learn.microsoft.com/en-us/training/browse/?expanded=azure&products=azure-sentinel
- What is Microsoft Sentinel?: https://learn.microsoft.com/en-gb/azure/sentinel/overview
Creating automation
Now that we have learned how to enable Azure Sentinel in your environment, this recipe will teach you how to set up playbooks so that you can automate responses to incidents that we will trigger from data connector signal data and alert log rules that we will set up in the following recipe in this chapter.
Getting ready
This recipe requires the following to be in place:
- A device with a browser, such as Edge or Chrome, to access the Azure portal: https://portal.azure.com
- Access to an Azure subscription, where you have access to the Owner role
- The subscription should have Microsoft Sentinel enabled
How to do it…
This task consists of the following step:
- Creating a playbook
Task – creating a playbook
Perform the following steps:
- Sign in to the Azure portal: https://portal.azure.com.
- From the search bar, type Microsoft Sentinel; click Microsoft Sentinel from the list of services shown.

Figure 9.21 – Search for the Sentinel resource

Figure 9.22 – Select the Sentinel workspace
- From the Sentinel workspace, click News & guides under the General section; then, from the Get started tab, click Create from the Automate & orchestrate step.
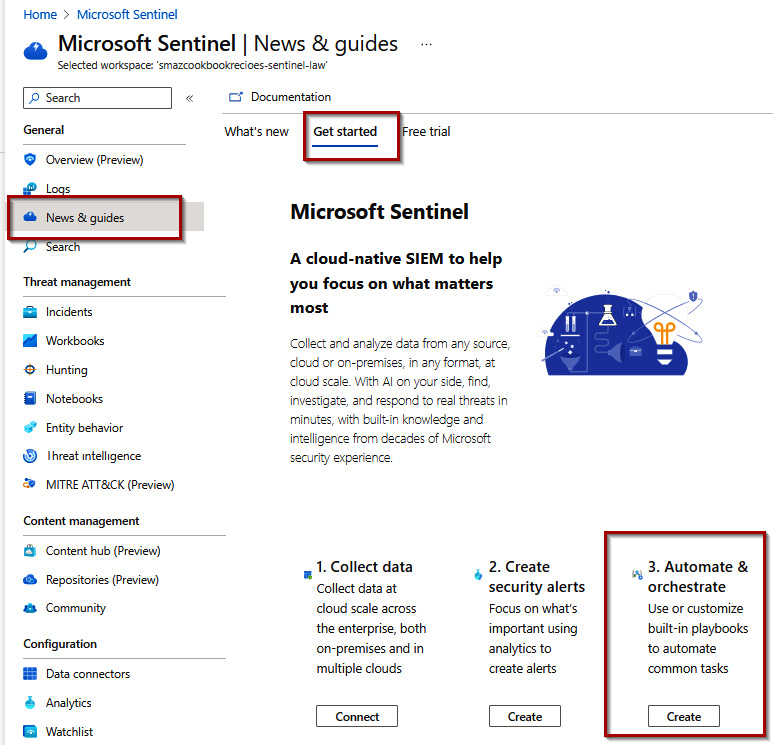
Figure 9.23 – The Get started tab

Figure 9.24 – Automation
- In the list of available playbook templates on the Playbook templates (preview) tab, search for and open the Send email with formatted incident report template; then click Create playbook.

Figure 9.25 – Create a playbook
- On the Basics tab, click Next : Parameters >, then from the Parameters tab, enter the required information in the NotificationEmail field, and then either leave the default or change the Company logo link and Company name fields. Then, click Next : Connections >.
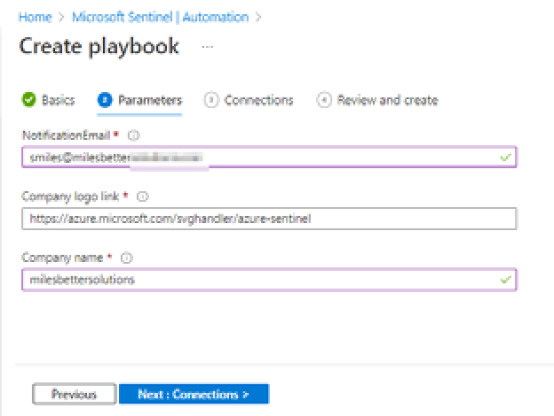
Figure 9.26 – The Create playbook parameters tab

Figure 9.27 – The Create playbook Connections tab

Figure 9.28 – Create a playbook review
- After creating the playbook, we must complete two further actions: grant permissions to run the playbook and authorize the mail connection. We will step through these actions in this recipe.

Figure 9.29 – Playbook Connections actions
- From the Logic app designer, you need to authorize the mail connection and validate the M365 email address selected to receive the email response. Click the information symbol, which will trigger a pop-up window to prompt you to complete signing in with the account used with the M365 email address.
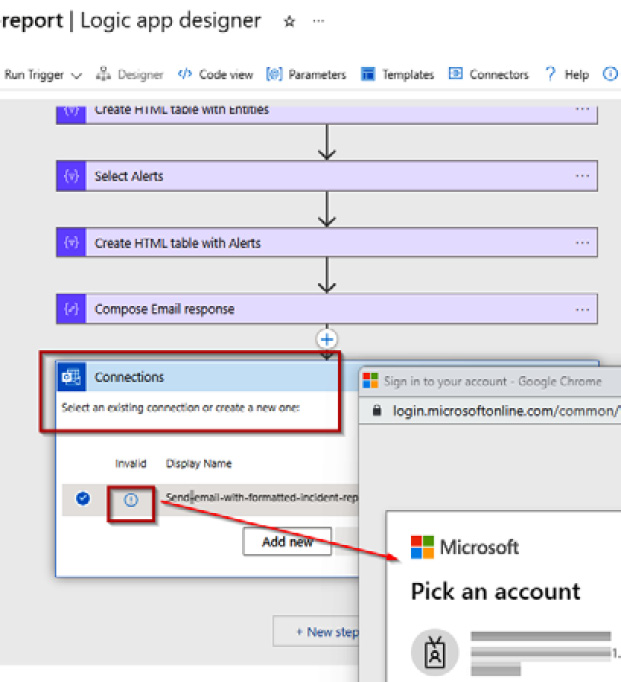
Figure 9.30 – Logic app designer
- If the M365 email address was validated successfully, the Logic app designer steps should appear, as represented in the following screenshot:

Figure 9.31 – Logic app designer steps

Figure 9.32 – Active playbooks
- Next, we need to assign permissions for Sentinel to the playbook. In Sentinel, click on Settings in the Configuration section.

Figure 9.33 – Sentinel settings
- Click on the Settings tab of the Settings page.

Figure 9.34 – The Settings tab
- Expand the Playbook permissions section on the Settings page, and click on Configure permissions.
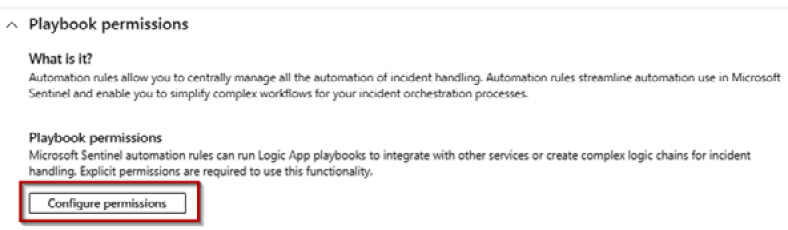
Figure 9.35 – Configure permissions
- Select the resource groups on the Manage permissions blade that contains the playbooks that Sentinel can run, then click Apply.
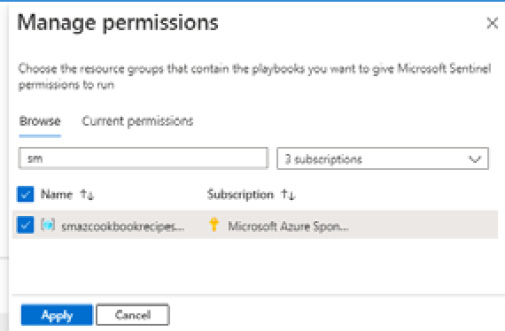
Figure 9.36 – Manage permissions

Figure 9.37 – Notification of success
This task to create a playbook is completed.
How it works…
For this recipe, we created a playbook for use with incidents to provide an automated response via email. We will use this playbook for the analytics rule we create in the next recipe.
See also
Should you wish to learn more about this and related topics, you can refer to the following Microsoft Learn articles:
- Microsoft Sentinel documentation: https://learn.microsoft.com/en-us/azure/sentinel/
- Microsoft Learn training modules and paths: https://learn.microsoft.com/en-us/training/browse/?expanded=azure&products=azure-sentinel
- Tutorial: Use playbooks with automation rules in Microsoft Sentinel: https://learn.microsoft.com/en-us/azure/sentinel/tutorial-respond-threats-playbook
Set up data connectors
Now that we have learned how to enable Azure Sentinel in your environment, this recipe will teach you how to set up data connectors so that you can start collecting signal information for analysis and alerting.
Getting ready
This recipe requires the following to be in place:
- A device with a browser, such as Edge or Chrome, to access the Azure portal: https://portal.azure.com
- Access to an Azure subscription, where you have access to the Owner role
- The subscription should have Microsoft Sentinel enabled
How to do it…
This task consists of the following steps:
Task – gather signal data using data connectors
- Sign in to the Azure portal: https://portal.azure.com.
- In the search bar, type Microsoft Sentinel; click Microsoft Sentinel from the list of services shown.

Figure 9.38 – Search for the Sentinel resource
- When Sentinel opens, click on the workspace created in the previous recipe.

Figure 9.39 – Select workspace
- In the Sentinel workspace, click News & guides in the General section; then, from the Get started tab, click Connect from the Collect data step.

Figure 9.40 – The Get started tab
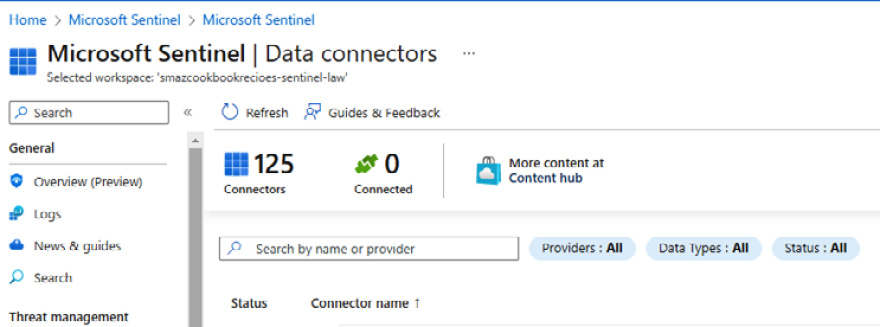
Figure 9.41 – Data connectors
- In the search box, type azure active directory and click the Azure Active Directory data connector listed in the search results.

Figure 9.42 – Data connector

Figure 9.43 – Data connector information
- On the Connector page, check the boxes for all log types to be collected for analysis by Sentinel, then click Apply Changes.
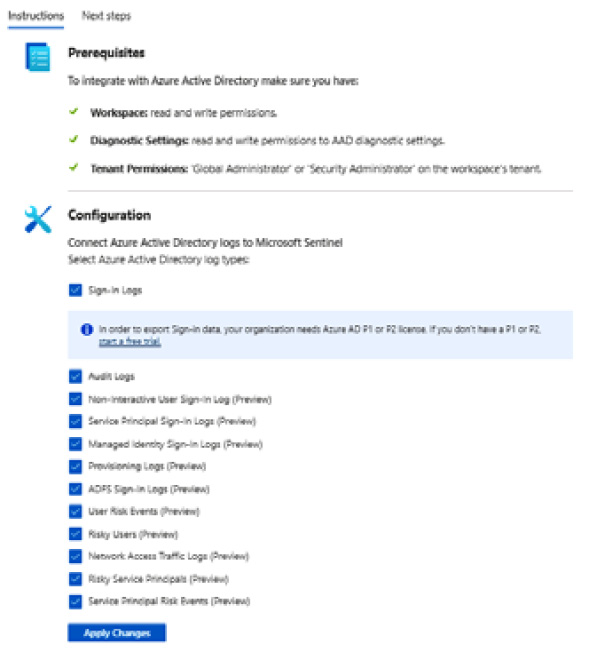
Figure 9.44 – Data connector configuration

Figure 9.45 – Notification of success
This task to connect a data connector is completed.
Task – create an analytics rule
- On the Azure AD Connector page created in the previous recipe, click the Next steps tab.
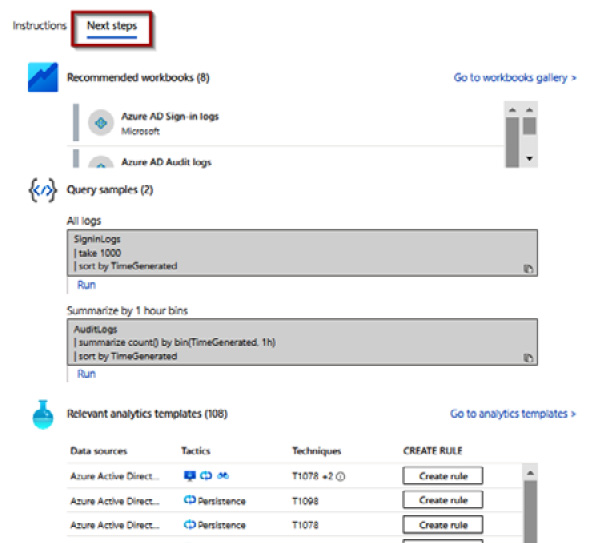
Figure 9.46 – Data connector page
- On the Next Steps tab of the connector, you should review all the activities you would like to be alerted about.
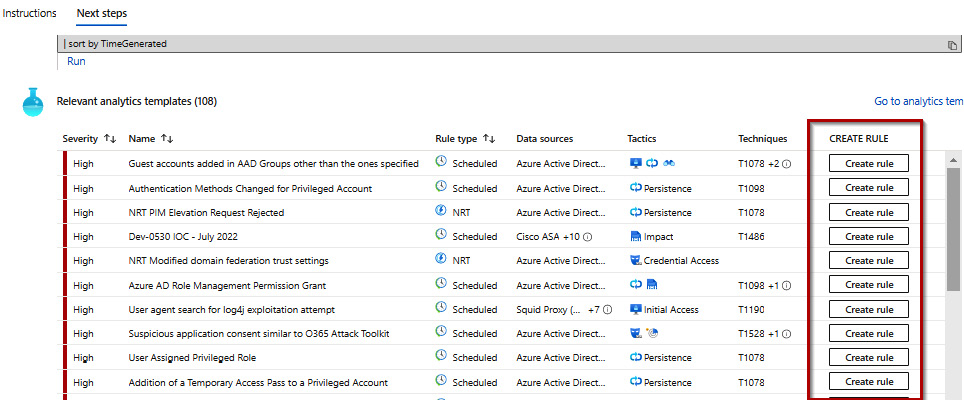
Figure 9.47 – Analytics templates
- For our example, we wish to use the Failed login attempts to Azure Portal rule; to do so, click on Create rule against the analytics template’s Name value.
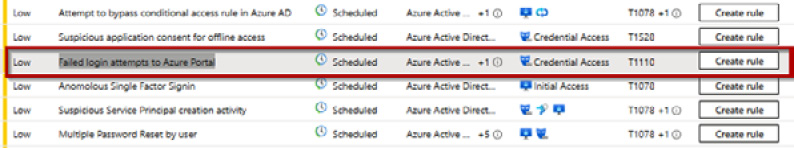
Figure 9.48 – Create analytics rule
- In Analytics rule wizard, click Next : Set rule logic >.
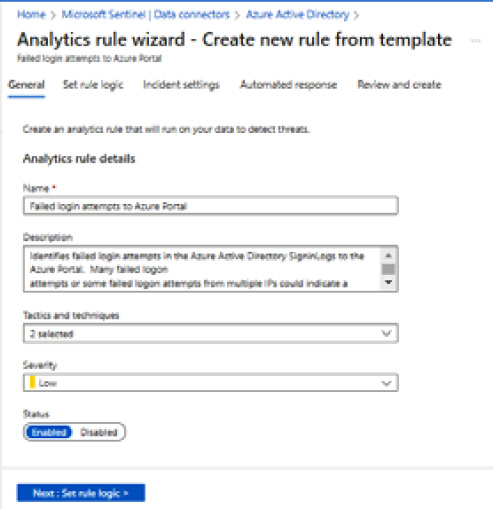
Figure 9.49 – Analytics rule wizard
- Review the information on the Set rule logic tab in the Rule query tab. For an incident to trigger, a threshold must be met, which can be edited as required. For this recipe, edit the values as follows:
- let threshold_Failed = 1;
- let threshold_FailedwithSingleIP = 1;
- let threshold_IPAddressCount = 1;
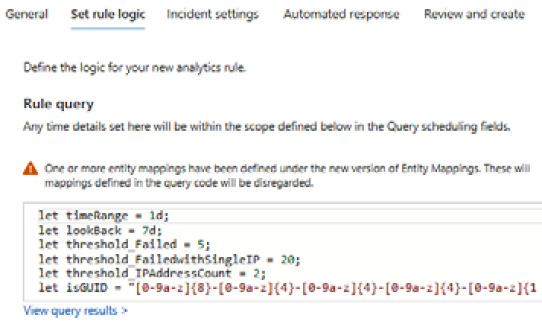
Figure 9.50 – Analytics rule logic
- Next, click Next : Incident settings > and Next : Automated response >.
- On the Automated response tab, click Add new in the Automation rules section.

Figure 9.51 – Analytics automated response
- Enter the Automation rule name value as required on the Create new automation rule blade, then set the Actions option to Run playbook.

Figure 9.52 – Automation rule actions
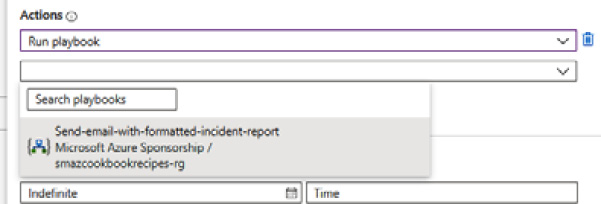
Figure 9.53 – Select the playbook
- Then click Apply.

Figure 9.54 – Apply automation rule

Figure 9.55 – Automation rule added
- Click Next : Review >.
- Once you have reviewed the information on the Review and create tab, click Create.

Figure 9.56 – Analytics rule creation validation

Figure 9.57 – Notification of success
- On the Analytics screen, in the Configuration section, we can see the Failed login attempts to Azure portal rule in the Active rules section.
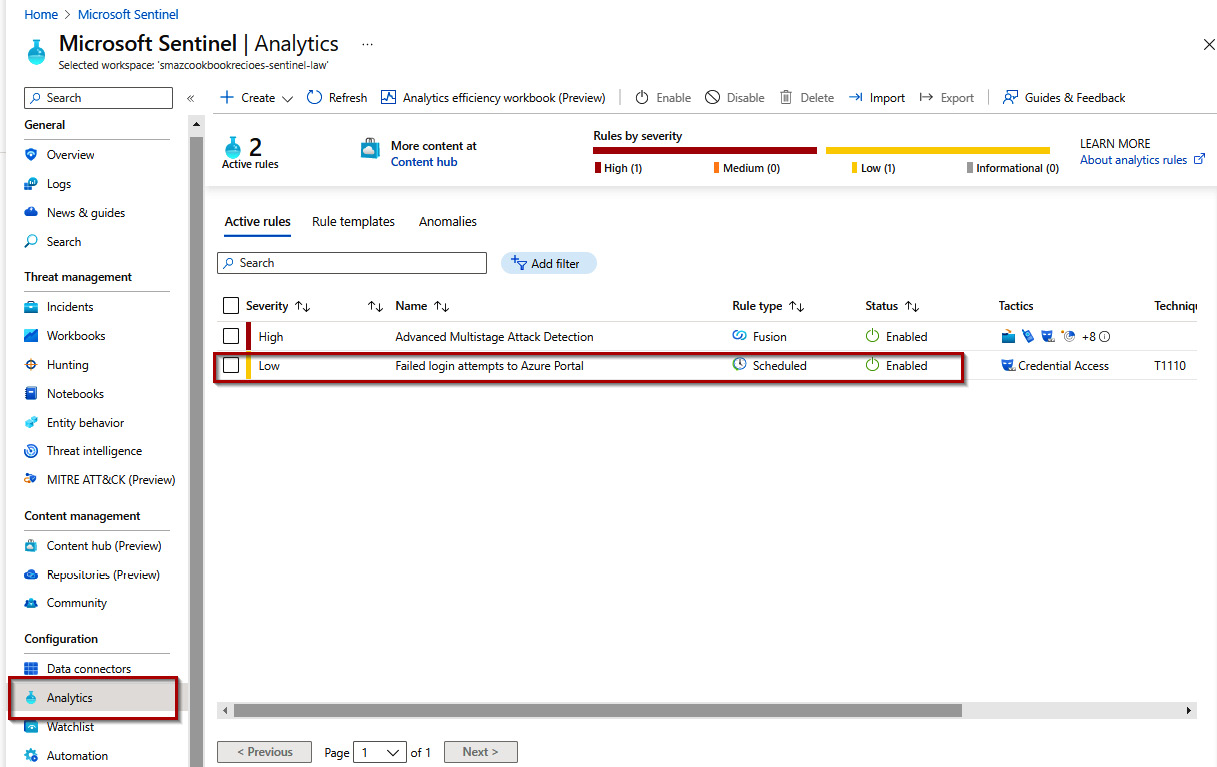
Figure 9.58 – Analytics active rules
- After a short period of time, make some failed attempts to log in to the Azure portal to trigger the analytics rule logic.

Figure 9.59 – Failed portal login attempts

Figure 9.60 – Incidents
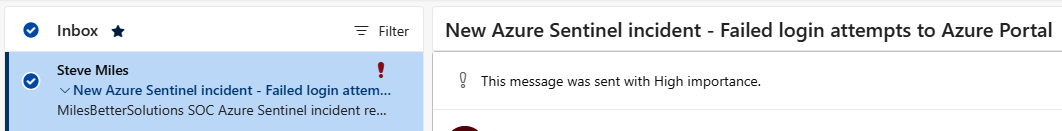
Figure 9.61 – Incident automated response notification
- When the email notification is opened, further details of the incident can be found, such as the accounts that failed the Azure portal login process, an IP address, and a time stamp.
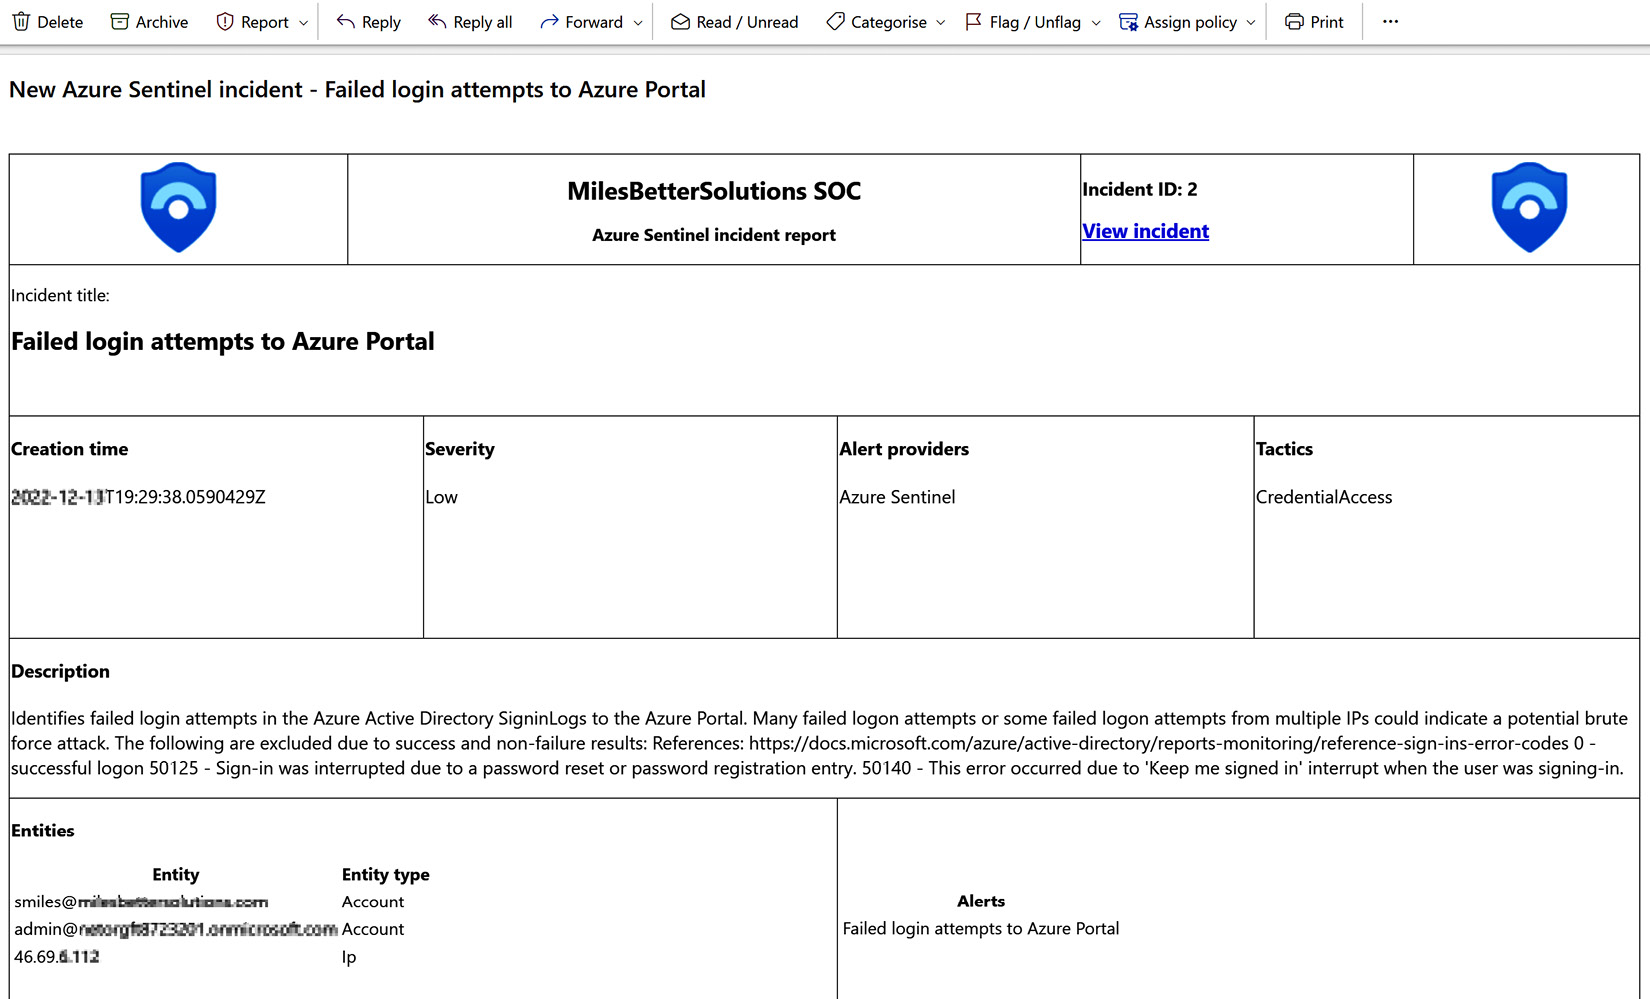
Figure 9.62 – Response notification email body
This task is completed.
How it works…
We saw how to add a data connector to collect signal data for this recipe. We then configured an analytics rule and viewed an incident triggered by the analytics rule logic.
See also
Should you wish to learn more about this and related topics, you can refer to the following Microsoft Learn articles:
- Microsoft Sentinel documentation: https://learn.microsoft.com/en-us/azure/sentinel/
- Microsoft Learn training modules and paths: https://learn.microsoft.com/en-us/training/browse/?expanded=azure&products=azure-sentinel
- Microsoft Sentinel data connectors: https://learn.microsoft.com/en-gb/azure/sentinel/connect-data-sources
- Data collection best practices: https://learn.microsoft.com/en-gb/azure/sentinel/best-practices-data
- Detect threats out-of-the-box: https://learn.microsoft.com/en-gb/azure/sentinel/detect-threats-built-in