
13
Integration with Other Services
In the previous chapters, we looked at the different parts of Ansible Automation Platform (AAP). In this chapter, we will look at using other services and how they interact with some of the lesser-known parts of AAP. These different services each focus on a different aspect of information generated by AAP. This includes job and event logs and metrics. Having a searchable log that contains this information can be invaluable for detecting problems and trends as your automation grows.
In this chapter, we’re going to cover the following main topics:
- Logging services
- Automation Analytics for Red Hat AAP
- Prometheus metrics logging
Technical requirements
All the code referenced in this chapter is available at https://github.com/PacktPublishing/Demystifying-Ansible-Automation-Platform/tree/main/ch13. It is assumed that you have Ansible installed to run the code provided.
Logging services
Most enterprise deployments of AAP use some form of log aggregation to get a better view of utilization and trends. The AAP services provide good logs and views of general information and tasks, but it can be hard to keep track as things grow. This section will explain how to deploy and integrate the Automation controller with the Splunk service, but the logging aggregation on the controller is also compatible with Loggly, Sumologic, and the Elastic Stack. More details can be found on the documentation site: https://docs.ansible.com/automation-controller/latest/html/administration/logging.html.
Note
Numerous times, I’ve heard people asking, "Why doesn’t AAP have better logging capabilities?" And the answer I always come back with is that AAP is not a kitchen sink. There are numerous other services out there that will do a better job than the Ansible team would be able to build and support, so they focus on making the product interact as best as possible with external services, rather than building their own.
Creating an event collector on Splunk
Splunk can be downloaded and installed on a variety of servers. More information about how to install and configure a Splunk server can be found at https://www.splunk.com/.
The steps for connecting Splunk to an Automation controller are as follows:
- Log into the Splunk web interface.
- Click Add Data | Monitor | HTTP Event Collector.
- Fill in the Name field and click Next.
- On the Select Source Type page, make sure Automatic is selected.
- Click Create a new index and give it a name such as ansible or controller. Then, click Save.
- Click Review. You should see the following:
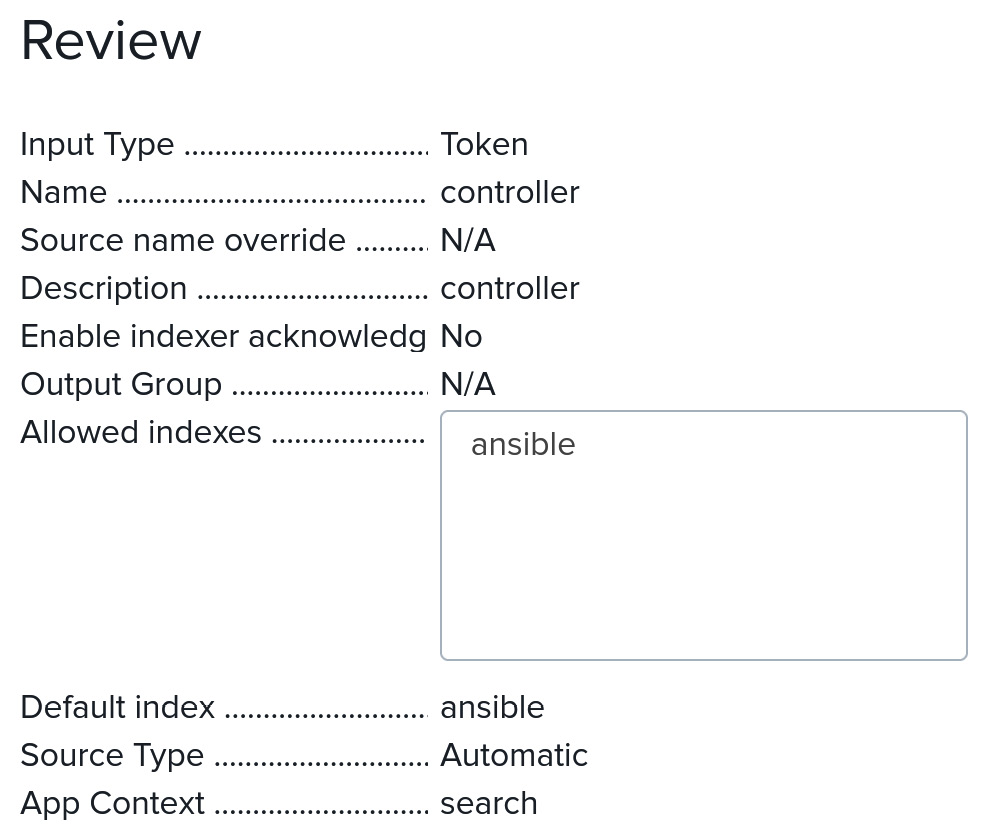
Figure 13.1 – Splunk Event Collector settings
- Click Submit.
- Go to Settings | Data Inputs | HTTP Event Collector. You should see something like the following:
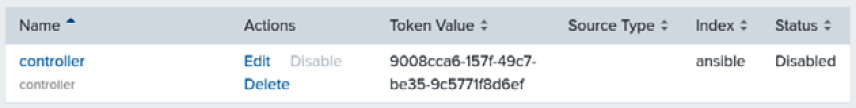
Figure 13.2 – Splunk Event Collector status page
- Navigate to Global settings at the top right and enable tokens.
- Navigate to Settings | Server Settings | General Settings | Set Enable SSL (HTTPS) in Splunk Web and set it to On.
- Also, make sure that ports 8000 and 8088 are open on the firewall of the Splunk server.
With the connector on Splunk created, the next step is to start sending events from the Automation controller.
Connecting the Automation controller to Splunk
To connect Splunk to the Automation controller, navigate to the Automation controller’s Settings page. Then, select Logging settings.
The following fields need to be changed:
- Logging Aggregator: The web address for the logging aggregator – that is, https://10.242.42.36/services/collector/event.
- Port: The port to use. By default, this is 8088.
- Type: The type of logging aggregator – in this case, Splunk.
- Username: The admin. This is not specified in Splunk and there will be errors unless it’s set.
- Password: This is the token from the HTTP event collector.
- Individual Facts: This is a Boolean that’s set to true. This allows for better searching as facts are sent individually instead of in a group.
- Enable External Logging: This turns the logging on and off.
- Enable Certificate Verification: Turn this on or off, depending on whether you want to verify the Splunk server’s certificates.
The page should look like this:
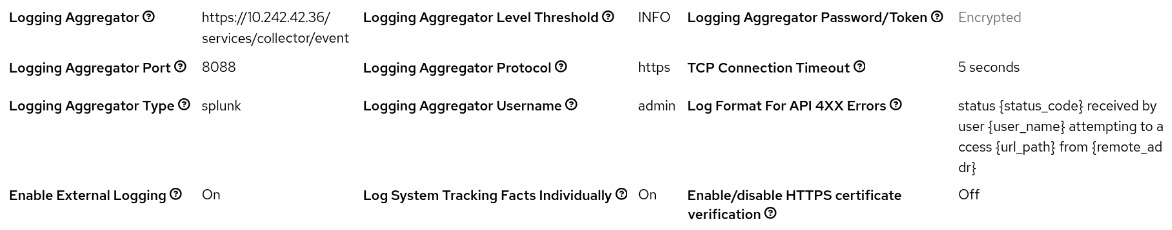
Figure 13.3 – Automation controller logging settings
In addition, the settings to use for roles or modules, as well as a playbook to implement them, can be found at //splunk/splunk_settings.yaml:
controller_settings:
  settings:
    LOG_AGGREGATOR_HOST: https://10.242.42.36/services/collector/event
    LOG_AGGREGATOR_PORT: 8088
    LOG_AGGREGATOR_TYPE: splunk
    LOG_AGGREGATOR_USERNAME: admin
    LOG_AGGREGATOR_PASSWORD: 9008cca6-157f-49c7-be35-9c5771f8d6ef
    LOG_AGGREGATOR_INDIVIDUAL_FACTS: true
    LOG_AGGREGATOR_ENABLED: true
    LOG_AGGREGATOR_VERIFY_CERT: false
This should start the process of sending data to Splunk. If no events appear in the Ansible index, then it is best to look in the logs. Now, let’s learn how to troubleshoot issues with the log aggregator.
Troubleshooting with the log aggregator
To troubleshoot any problems with the log aggregator, check /var/log/tower/rsyslog.err on an Automation controller node.
The following are a few of the errors I found while troubleshooting:
- The requested URL was not found on this server.: When HTTPS was not used
- Token is required: When the admin username was not set
The full error outputs can be found at //splunk/splunk_errors.
Splunk search queries
To search the data that’s been gathered, navigate to Search & Reporting on the Splunk dashboard.
Here, you can use the following commands:
- See user login history:
index=ansible message="User * logged *"
- Find the most used playbooks:
index=ansible | chart count by event_data.playbook | sort by count
- Find the most used modules being run:
index=ansible | chart count by event_data.task_action
- Find the jobs that hosts have run, removing null data:
index=ansible "event_data.remote_addr" !=NULL AND "event_data.playbook" !=NULL | chart count by event_data.remote_addr event_data.playbook
- See what tasks are using what modules:
index=ansible | chart count by event_data.task_action event_data.task
This is not an exhaustive list of searches that can be made, but it is a good representation of what can be done. These searches can then be used to create dashboards.
Splunk dashboards
These search commands can be used in dashboards to create graphs similar to the following:
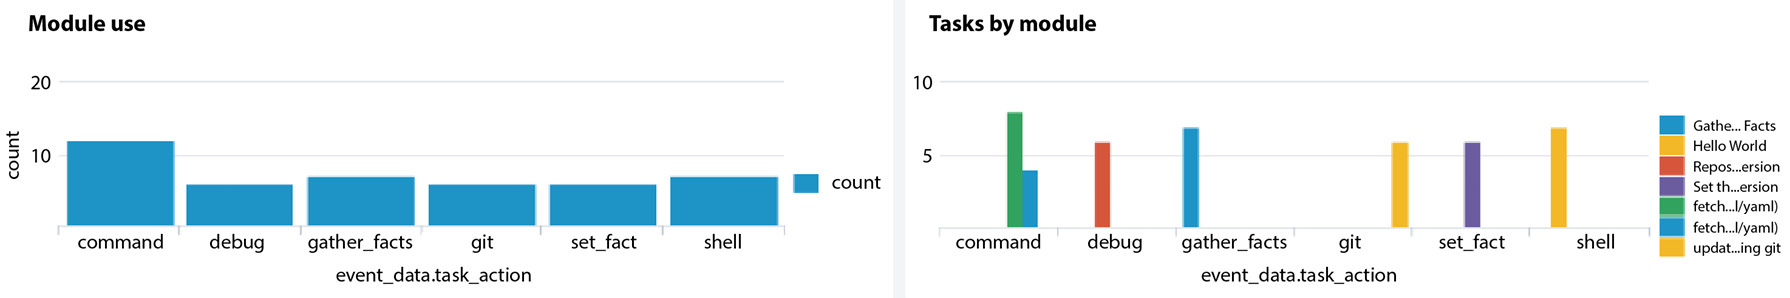
Figure 13.4 – Splunk dashboard graphics
To create a dashboard, follow these steps. This example will use the most used modules search:
- Navigate to https://splunk_address/en-US/app/search/dashboards.
- Click Create New Dashboard and give your dashboard a Name and Description. Decide whether it should be a Private or Public dashboard for others to see. Then, click Dashboard Studio | Grid | Create.
- Click the Chart icon, as shown in the following screenshot, and choose which type of chart to make:
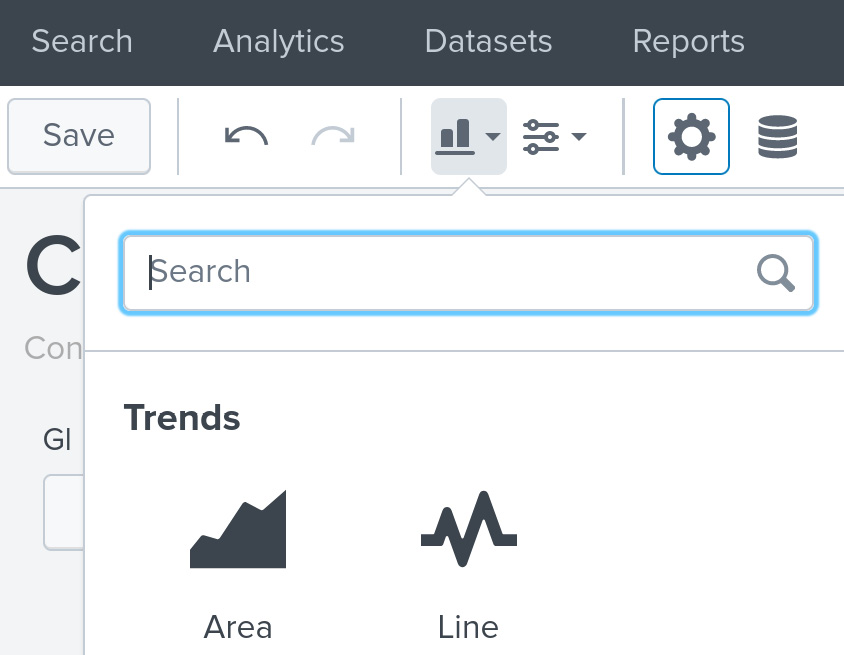
Figure 13.5 – Creating a Splunk dashboard
- Select Column, fill in Data Source Name, and fill in Search with SPL with index=ansible | chart count by event_data.task_action. Click Run and Save.
- The form provides options for the title, axes titles, and positional options – that is, everything to customize the given chart.
- From here, more charts can be created, or the dashboard can be saved by clicking Save in the top-left-hand corner.
Splunk and other log aggregators can be useful tools to supplement the Automation controller and can provide insight into usage and other trends over time. Another tool that can help you do some of this is Red Hat Insights for AAP.
Automation Analytics for Red Hat AAP
Automation Analytics is a tool for exploring the performance and return on investment of either single or multiple Automation controllers. There are also reports, savings calculators, job explorers, and notifications of cluster status. These can be viewed by going to https://console.redhat.com/ansible. This section will go through the basic configuration for the Automation controller so that you can send reports to Red Hat, as well as some of the features it provides. The first step is configuring the Automation Analytics reporting.
Automation Analytics configuration
To configure Automation Analytics in the GUI, follow these steps:
- From the Automation controller, navigate to Settings | Miscellaneous System settings. Then, click Edit.
Toggle Gather data for Automation Analytics on and fill in the fields for Red Hat customer username and Red Hat customer password:
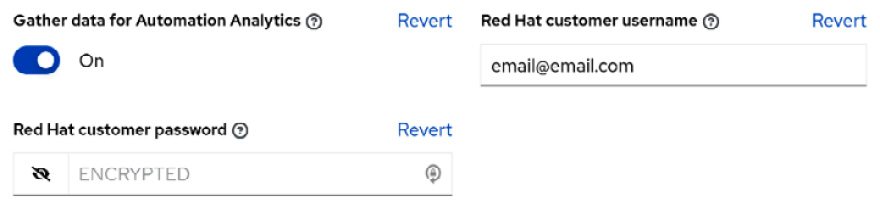
Figure 13.6 – Red Hat Insights settings
- Click Save.
- The Last gathered entries from the data collection service of Automation Analytics field should populate shortly after.
- An update can be forced from the command line by using the sudo awx-manage gather_analytics --ship command. The result should look like this:
[root@controller username]# awx-manage gather_analytics --ship
/tmp/d72a5fec-5f8e-41a8-8568-f353690677a1-2022-06-11-204019+0000-0.tar.gz
/tmp/d72a5fec-5f8e-41a8-8568-f353690677a1-2022-06-11-204019+0000-1.tar.gz
The result should show up on console.redhat.com after 5 to 10 minutes, depending on the time needed to process the data. The default time to send new data is 4 hours. This can be changed with the Automation Analytics Gather Interval setting.
Configuring the insights settings with roles/modules
The configuration in the preceding GUI can be configured using the settings for roles or modules. A playbook for implementing them can be found at //analytics/analytics_settings.yaml:
controller_settings:
  settings:
        INSIGHTS_TRACKING_STATE: true
        REDHAT_USERNAME: [email protected]
        REDHAT_PASSWORD: nothing
        AUTOMATION_ANALYTICS_GATHER_INTERVAL: 14400
With the integration configured, let’s cover what can be done with the reported information.
Charts and other information accessible from the dashboard
Reports and an overview of the Automation controllers are the biggest features that can be gained from the reported information. The following reports can be accessed:
- Jobs/tasks by organization report
- Hosts by organization
- Templates explorer
- Job template run rate
- Changes made by job template
- Hosts changed by job template
- Module usage by organization
- Module usage by job template
- Module usage by task
- Most used modules
In addition, there is also a job explorer that gives a brief rundown of the jobs that have run, similar to the Jobs tab on the Automation controller itself. Information about what data is uploaded to generate these reports can be found here: https://docs.ansible.com/automation-controller/latest/html/administration/usability_data_collection.html#automation-analytics.
In addition to these reports, there is an Automation calculator.
Automation calculator
There is also an Automation calculator, which allows the user to input the costs of manually doing the changes per hour, the cost of the automation, and set the time it would take to do the jobs manually. This will help generate an estimate of how much time is saved per year by using automation:
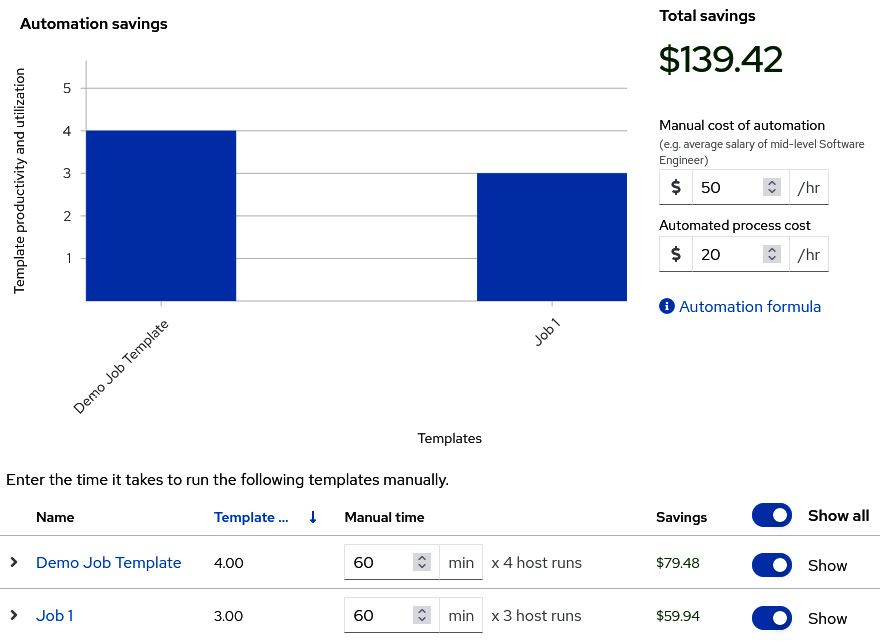
Figure 13.7 – Red Hat Insights Automation calculator
The calculator can be configured for each template to reach a rough estimation. It is not a perfect tool, but it is a good approximation for using in reports to justify expenditures.
Beyond the reports, one of the key advantages of Automation Analytics is its ability to observe multiple clusters from a single user interface. Another popular monitoring tool for logging metrics is Prometheus, which we will cover in the next section.
Prometheus metrics logging
Prometheus is a monitoring and observability tool that can incorporate data from the Automation controllers via /api/v2/metrics/. Using the data reported over time, we can gather information about user sessions, the number of jobs running on each node, and license counts. All of the data that’s been tracked can be viewed in the metrics endpoint. Now, let’s learn how to install and configure Prometheus so that it can be connected to the Automation controller.
Installation and configuration
A playbook has been created that uses the cloudalchemy.prometheus role to install and configure a basic installation of Prometheus on a server. The basic configuration uses the following variables:
- static_configs.targets: The servers to target.
- bearer_token: The OAuth token to use to authenticate. The username or password can also be used.
- metrics_path: The path on the API to read from.
The playbook for installation can be found at //prometheus/prometheus_install.yaml:
  vars:
    prometheus_scrape_configs:
      - job_name: 'controller.node'
        tls_config:
            insecure_skip_verify: True
        metrics_path: /api/v2/metrics
        scrape_interval: 5s
        scheme: https
        bearer_token: token
        static_configs:
            - targets:
                - controller.node
Running this playbook will target a server, install Prometheus, and configure it to connect to the Automation controller. Use the ansible-playbook –i inventory prometheus_install.yaml command to do so.
Prometheus Graphs
Graphs for Prometheus are very simple. You can use a query on the variable from the metrics API, which reports how that value has changed over time. A good example of this is the status total searches:
- awx_status_total
- awx_status_total{status="error"}
- awx_status_total{status="failed"}
- awx_status_total{status="canceled"}
- awx_status_total{status="successful"}
The awx_status primary field’s total will return data on all four of the subfields; a search that includes the status will only return that field. This will result in a graph:
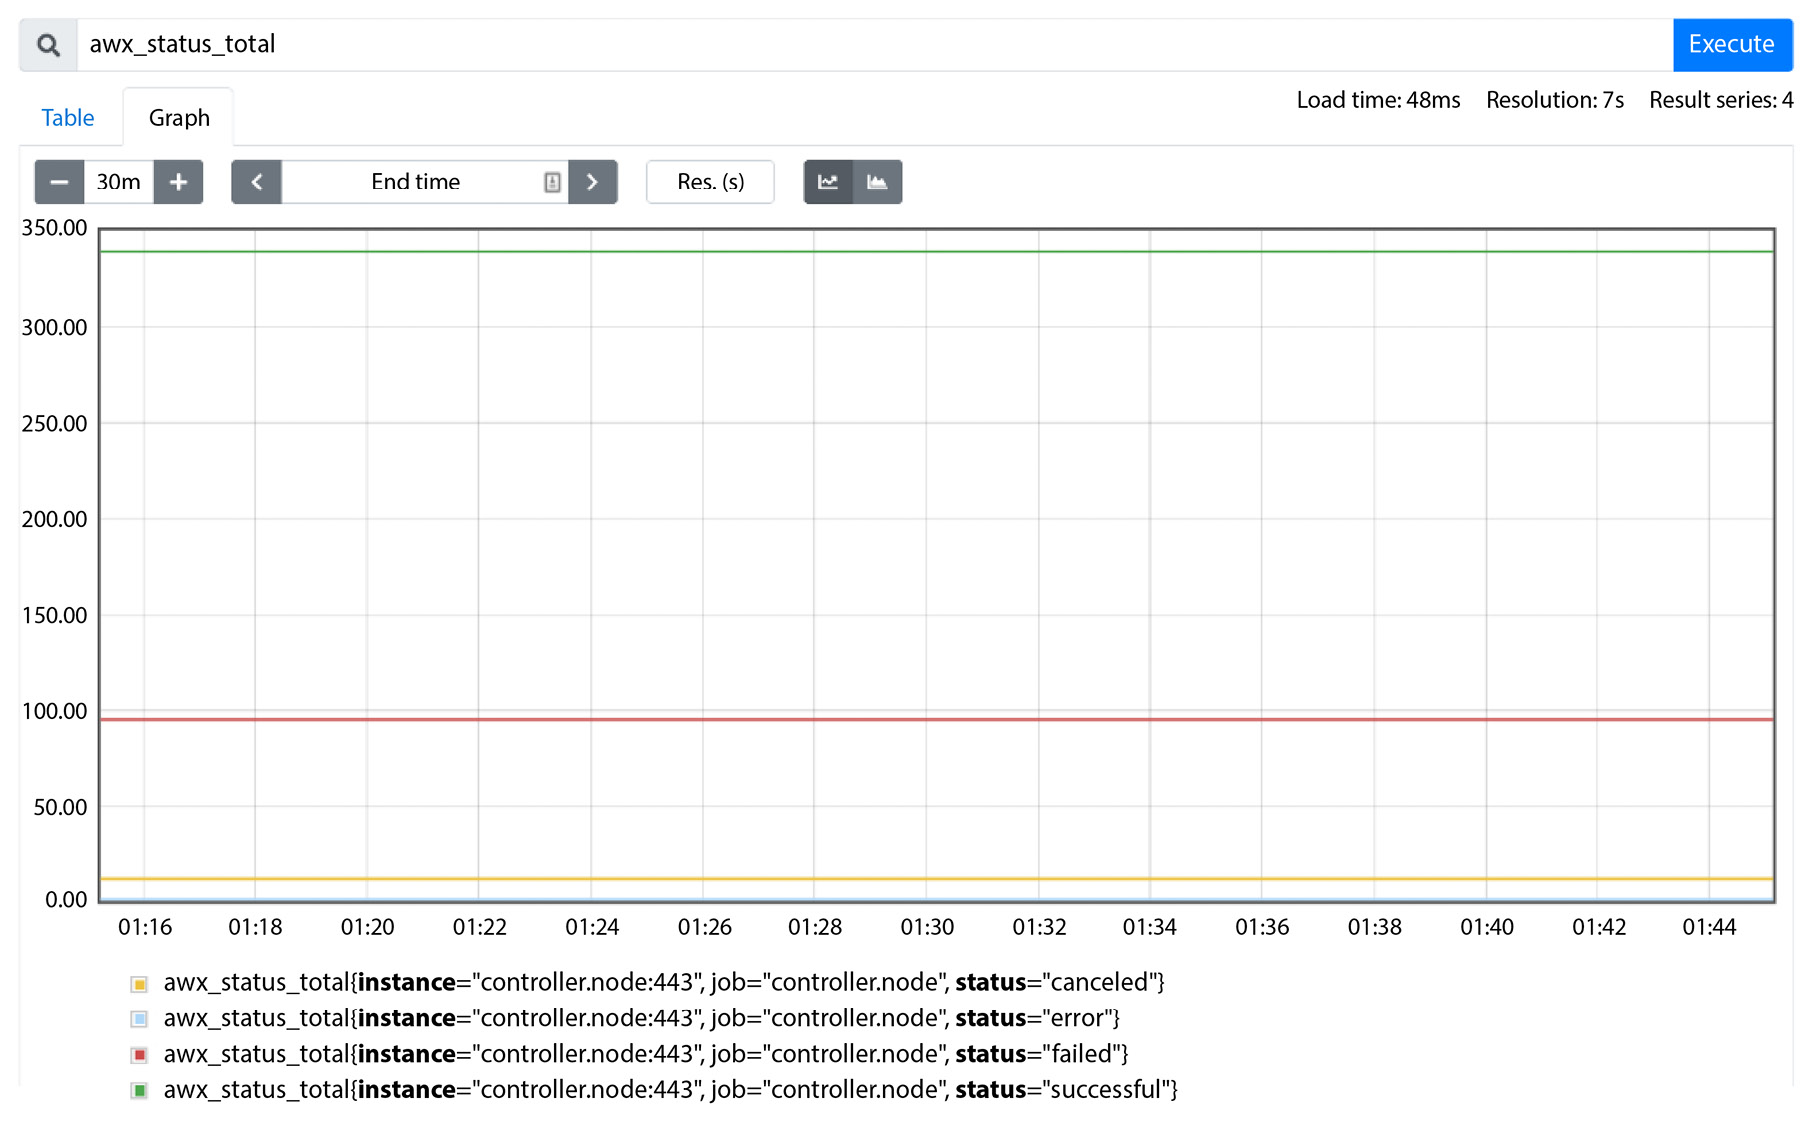
Figure 13.8 – Prometheus awx_status graph
The graph can be customized for a specific period or to show data on other fields. Prometheus Alert Manager can also be configured to send alerts, should certain conditions be met. Overall, it is a useful tool to see historical data and use it for monitoring purposes.
Summary
This chapter covered integration with logging services, Prometheus, and Red Hat Insights. These are useful tools to get more information and reports out of the automation services that are being utilized. While this chapter just provided a brief overview, it only scratches the surface of what can be done with the available information. The next chapter will cover Automation mesh, which allows us to scale the Automation controller using nodes in disparate networks to execute jobs.