
17
Sharing Your Data Story
Throughout this book, we’ve focused on Tableau Desktop and learned how to visually explore and communicate data with visualizations and dashboards. Once you’ve made discoveries, designed insightful visualizations, and built stunning dashboards, you’re ready to share your data stories.
Tableau enables you to share your work using a variety of methods. In this chapter, we’ll take a look at the various ways to share visualizations and dashboards, along with what to consider when deciding how you will share your project.
Specifically, we’ll look at the following topics:
- Presenting, printing, and exporting
- Sharing with users of Tableau Desktop and Tableau Reader
- Sharing with users of Tableau Server, Tableau Cloud, and Tableau Public
There are no examples to follow in this chapter, but it is highly recommended to read through the material for a solid understanding of the various options available for sharing your insights and discoveries.
Let’s start with an overview of the presenting, printing, and exporting processes.
Presenting, printing, and exporting
Tableau is primarily designed to build richly interactive visualizations and dashboards for consumption on a screen. This has been our default approach throughout the book as most often, you will expect users to interact with your dashboards and visualizations. However, there are times when you might leverage options for presenting, printing, or exporting as a means of communicating data to your audience.
Presenting
Tableau gives you multiple options for personally presenting your data story. You might walk your audience through a presentation of a single dashboard or view, or you might create an entire presentation. While there are multiple ways you might structure a presentation, consider the following options:
- Exporting to PowerPoint
- Presentation mode
Tableau Desktop and Server allow you to export directly to PowerPoint. In Tableau Desktop, select File | Export as PowerPoint.... After selecting a location and filename, Tableau will generate a PowerPoint file (.pptx), converting each tab in the Tableau workbook to a single slide in PowerPoint. Each slide will contain a static image of the views and dashboards as they exist at the time of the export. As each slide is simply a screenshot, there will be no dynamic interactivity following the export.
If you are creating a dashboard specifically for export to PowerPoint, set the fixed size of the dashboard to Tableau’s predefined PowerPoint dimensions of 1600 x 900.
If you prefer a more dynamic presentation experience, consider using Presentation mode. This mode shows you all dashboards and views in full screen mode. It hides all toolbars, panes, and authoring objects. To activate presentation mode, select Window from the top menu or press F7 or the option on the top toolbar. Press F7 or the Esc key to exit presentation mode. While in presentation mode, you may still interact with dashboards and views using actions, highlighting, filtering, and other options. This enriches the presentation and gives you the ability to answer questions on the fly. When used with compelling dashboards and stories, presentation mode makes for an effective way to personally walk your audience through the data story.
In addition to interactive dashboards, and presentations via PowerPoint or Presentation mode, your audience may sometimes require a printed copy of dashboards and visualizations. Let’s turn our attention to some aspects of design that meet this requirement.
Printing
Tableau enables printing for individual visualizations, dashboards, and stories. From the File menu, you can select Print to send the currently active sheet in the workbook to the printer or the Print to PDF option to export to a PDF. Either option allows you to export the active sheet, selected sheets, or the entire workbook to a PDF. To select multiple sheets, hold the Ctrl key and click individual tabs.
When printing, you also have the option to Show Selections. When this option is checked, marks that have been interactively selected or highlighted on a view or dashboard will be printed as selected. Otherwise, marks will print as though no selections have been made. The map in the following dashboard has marks for the western half of the United States selected:
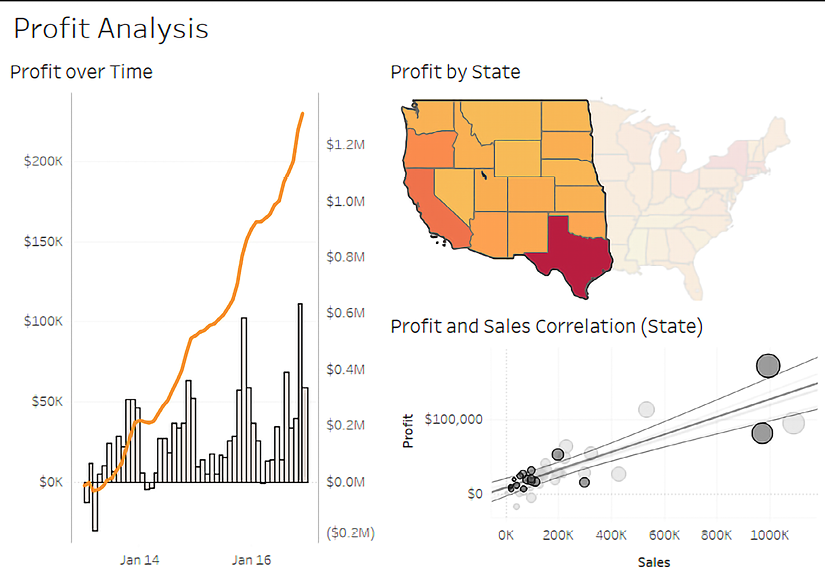
Figure 17.1: You can see states and circles that are selected in this screenshot. You may optionally print views with selections
Here are some considerations, tips, and suggestions for printing:
- If a dashboard is being designed for printing, select a predefined paper size as the fixed size for the dashboard or use a custom size that matches the same aspect ratio.
- Use the Page Setup screen (available from the File menu) to define specific print options, such as what elements (legends, title, caption) will be included, the layout (including margins and centering), and how the view or dashboard should be scaled to match the paper size. The Page Setup options are specific to each view. Duplicating or copying a sheet will include any changes to the Page Setup settings:
If you are designing multiple sheets or dashboards for printing, consider creating one as a template, setting up all the desired print settings, and then duplicating it for each new sheet.

Figure 17.2: The Page Setup dialog contains options for layout and print scaling
- Fields used on the Pages shelf will define page breaks in printing (for individual sheets, but not dashboards or stories). The number of pages defined by the Pages shelf is not necessarily equivalent to the number of printed pages. This is because a single page defined by the Pages shelf might require more than one printed page.
- Each story point in a story will be printed on a new page.
- Printing the entire workbook can be an effective way to generate a single PDF document for distribution. Each visible sheet will be included in the PDF in the order of the tabs, from left to right. You may hide sheets to prevent inclusion in the PDF or reorder sheets to adjust the order of the resultant document.
Consider also creating dashboards with images and text for title pages, table of contents, page numbers, and commentary. You might experiment with complete workbooks from previous chapters to see how various visual elements are retained or changed in the PDF conversion.
- Avoid scrollbars in dashboards as they will print as scrollbars, and anything outside the visible window will not be printed.
- Make sure all necessary information is displayed and not hidden in tooltips or other interactivity that is not accessible on the printed page.
- Consider color choices carefully as colors output by a printer may not exactly match those on a screen. Consider using more contrast (darker and lighter colors) or fewer colors than you might normally to communicate important aspects of the data story.
- You can also select multiple sheets in the workbook (hold the Ctrl key while clicking each tab) and then print only selected sheets.
Sheets may be hidden if they are views that are used in one or more dashboards or tooltips, or if they are dashboards used in one or more stories. To hide a view, right-click the tab or thumbnail on the bottom strip or in the left-hand pane of the dashboard or story workspace and select Hide Sheet. To show a sheet, locate it in the left-hand pane of the dashboard or story workspace, right-click it, and uncheck Hide Sheet. You can also right-click a dashboard or story tab and hide or show all sheets used.
If you don’t see a Hide Sheet option, this means this sheet is not used in any dashboard and can be deleted.
In addition to printing or outputting to PDF, we can also export data and images from views and dashboards. Let’s see how!
Exporting
Tableau also makes it easy to export images of views, dashboards, and stories for use in documents, documentation, and even books like this one! Images may be exported as .png, .emf, .jpg, or .bmp. You may also copy an image to the clipboard to paste into other applications. You may also export the data as a cross-tab (Excel), a .csv file, or Microsoft Access database (on Windows).
To copy an image or export images or data, use the menu options for Worksheet, Dashboard, or Story.
We’ll consider using Tableau Server, Tableau Cloud, and Tableau Public in detail shortly. For now, let’s consider some of the exporting features available on these platforms.
When interacting with a view on Tableau Server, Online, or Public, you will see a toolbar (unless you don’t have the required permissions or the toolbar has been specifically disabled by a Tableau Server administrator):
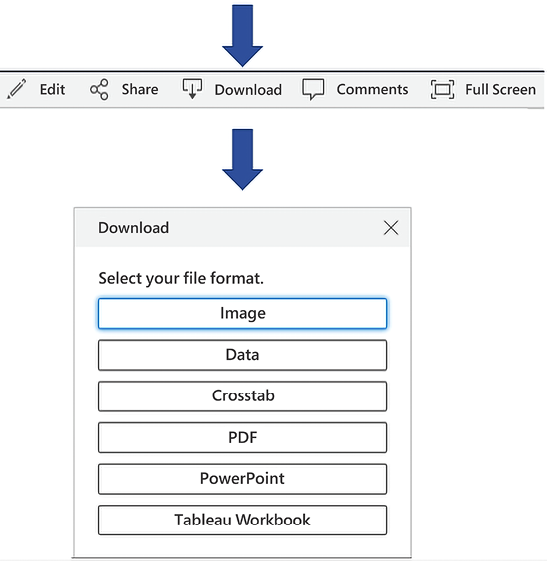
Figure 17.3: Exporting from the toolbar provides a similar experience for Server, Online, and Public
The Download option from the toolbar allows you to download an Image, Data, Crosstab (Excel), PDF, PowerPoint, or the Tableau Workbook. Images are exported in .png format and render the dashboard in its current state. Exporting a .pdf document will give the user many options, including layout, scaling, and whether to print the current dashboard, all sheets in the workbook, or all sheets in the current dashboard.
Exporting data or a crosstab will export for the active view in the dashboard; that is, if you click a view in the dashboard, it becomes active and you can export the data or crosstab for that particular view.
Other options exist for exporting from Tableau Server:
- Dashboards with Export buttons give end-users a friendly way of downloading exports. You may recall the Export button as one of the objects available to include on a dashboard. These can be configured to export the entire dashboard as a PDF, PowerPoint, or an image, and are a nice alternative to the toolbar option. This also allows for easy exporting from Tableau Desktop.
- Tabcmd, a command-line utility included with a Tableau Server installation, gives you the ability to export data, images, or documents in a wide variety of formats via the command line or scripts.
- The REST API gives you the ability to programmatically export data, images, or documents in a wide variety of formats. This option is available with Tableau Server but may be disabled by a Tableau Server administrator.
- You may append the extension to the URL of a view hosted on Tableau Server or Online to view or download in the format defined by the link. For example, appending
.pdfso that the URL would be something likehttps://tableauserver/#/views/Dashboard/View.pdfwould render the view as a PDF document in the browser.
Beyond sharing image or document exports, most often you’ll want to share fully interactive dashboards with others. Let’s consider how you might accomplish this.
Sharing with users of Tableau Desktop and Tableau Reader
You may share workbooks with other users of Tableau Desktop and Tableau Reader. We’ll consider the options and note some differences in the following sections.
Sharing with Tableau Desktop users
Sharing a workbook with other Tableau Desktop users is fairly straightforward, but there are a few things to consider.
One of the major considerations is whether you will be sharing a packaged workbook (.twbx) or an unpackaged workbook (.twb). Packaged workbooks are single files that contain the workbook (.twb), extracts (.hyper), file-based data sources that have not been extracted (.xls, .xlsx, .txt, .cub, .mdb, and others), custom images, and various other related files. When you share a packaged workbook, you are sharing extracted and file-based data and images with the end-user. If you share an unpackaged workbook, the other Desktop user will need to connect to the data, have local copies of file-based data sources and images, or have access to a shared location (e.g. a network drive) that contains the data and images.
To share with users of Tableau Desktop, you have a variety of options:
- You may share either a packaged (
.twbx) or unpackaged (.twb) workbook by simply sharing the file with another user who has the same or a newer version of Tableau Desktop.Workbook files will be updated when saved in a newer version of Tableau Desktop. You may receive errors or warnings when you open the workbook in an older version of Tableau. You will be prompted about updates when you first open the workbook and again when you attempt to save it. You may optionally export a workbook as a previous version from the File menu.
- If you share an unpackaged (
.twb) workbook, then anyone else using it must be able to access any data sources, and any referenced images must be available to the user in the same directory where the original files were referenced. For example, if the workbook uses a live connection to an Excel (.xlsx) file on a network path and includes images on a dashboard located inC:Images, then all users must be able to access the Excel file on the network path and have a localC:Imagesdirectory with image files of the same name.
Consider using a Universal Naming Convention (UNC) path (for example, \servernamedirectoryfile.xlsx) for common files if you use this approach.
Regardless of whether you share an unpackaged or packaged workbook, if it uses live connections, then anyone using the workbook must be able to access the live connection data source and have appropriate permissions.
Sharing with Tableau Reader users
Tableau Reader is a free application provided by Tableau Software that allows users to interact with visualizations, dashboards, and stories created in Tableau Desktop. Unlike Tableau Desktop, it does not allow for the authoring of visualizations or dashboards. However, all interactivity, such as filtering, drilldown, actions, and highlighting, is available to the end user.
Think of Tableau Reader as being similar to many PDF readers that allow you to read and navigate the document, but do not allow for authoring or saving changes.
When sharing with users of Tableau Reader, consider the following:
- Reader will only open packaged (
.twbx) workbooks. - The packaged workbook may not contain live connections to server or cloud-based data sources. Those connections must be extracted.
Be certain to take into consideration security and confidentiality concerns when sharing packaged workbooks (.twbx). Since packaged workbooks most often contain the data, you must be certain that the data is not sensitive. Even if the data is not shown on any view or dashboard, if it is a part of an extract or file packaged with the workbook, it is still accessible.
Reader and Desktop are good options but do require other users to have the application installed. You might also consider using Tableau Server, Online, or Public to share and collaborate with a wider audience.
Sharing with users of Tableau Server, Tableau Cloud, and Tableau Public
Tableau Server, Tableau Cloud (formerly called Tableau Online), and Tableau Public are all variations on the same concept: hosting visualizations and dashboards on a server and allowing users to access them through a web browser.
The following table provides some of the similarities and differences between the products, but as details may change, please consult with a Tableau representative prior to making any purchasing decisions:
|
Tableau Server |
Tableau Cloud |
Tableau Public | |
|
Description |
A server application installed on one or more server machines that hosts views and dashboards created with Tableau Desktop. |
A cloud-based service maintained by Tableau Software that hosts views and dashboards created with Tableau Desktop. |
A cloud-based service maintained by Tableau Software that hosts views and dashboards created with Tableau Desktop or the free Tableau Public client. |
|
Licensing cost |
Yes |
Yes |
Free |
|
Administration |
Fully maintained, managed, and administered by the individual or organization that purchased the license. |
Managed and maintained by Tableau Software with some options for project and user management by users. |
Managed and maintained by Tableau Software. Users have some options for managing their content. |
|
Authoring and publishing |
Users of Tableau Desktop may author and publish workbooks to Tableau Server. Web Authoring allows Tableau Server users the capability to edit and create visualizations and dashboards in a web browser. |
Users of Tableau Desktop may author and publish workbooks to Tableau Cloud. Web Authoring allows Tableau Cloud users the capability to edit and create visualizations and dashboards in a web browser. |
Users of Tableau Desktop or the free Tableau Public client can publish workbooks to Tableau Public. Web authoring (currently in beta) allows users to create content with only a web browser. |
|
Interaction |
Licensed Tableau Server users may interact with hosted views. Views may also be embedded in intranet sites, SharePoint, and custom portals. |
Licensed Tableau Cloud users may interact with hosted views. Views may also be embedded in intranet sites, SharePoint, and custom portals. |
Everything is public-facing. Anyone may interact with hosted views. Views may be embedded in public websites and blogs. |
|
Tableau Server |
Tableau Cloud |
Tableau Public | |
|
Limitations |
None except those based on licensing purchased and hardware used. |
Most data sources must be extracted before workbooks can be published. Most non-cloud-based data sources must have extracts refreshed using Tableau Desktop on a local machine or through the Tableau Bridge. Certain storage and load-time limits are also in place. |
All data must be extracted and each data source is limited to 15 million rows. |
|
Security |
The Tableau Server administrator may create sites, projects, and users and adjust permissions for each. Access to the underlying data can be restricted, and downloading of the workbook or data can be restricted. |
The Tableau Server administrator may create projects and users and adjust permissions for each. Access to the underlying data can be restricted, and downloading of the workbook or data can be restricted. |
By default, anyone may download and view data; however, access to these options may be restricted by the author. |
|
Good uses |
Internal dashboards and analytics and/or use across departments/ divisions/clients through multi-tenant sites. |
Internal dashboards and analytics, especially where most data sources are cloud-based. Sharing and collaboration with remote users. |
Sharing visualizations and dashboards with the public. Embedding dashboards on public-facing websites or blogs. |
With an understanding of the key differences, let’s consider the practical details of how you might publish and share your data story using each platform.
Publishing to Tableau Public
You may open workbooks and save to Tableau Public using either Tableau Desktop or the free Tableau Public client application. With the Tableau Public application, you’ll use the menu and select File | Save to Tableau Public…. Using Tableau Desktop, you’ll select Server | Tableau Public | Save to Tableau Public….
Please keep the following points in mind:
- In order to use Tableau Public, you will need to register an account
- With Tableau Desktop and the proper permissions, you may save and open workbooks to and from Tableau Public using the Server menu and by selecting options under Tableau Public
- With the free Tableau Public client, you may only save workbooks to and from the web
With these options, be aware that anyone in the world can view what you publish. You may optionally hide views from your online account.
- Selecting the option to Manage Workbooks will open a browser so you can log in to your Tableau Public account and manage all your workbooks online
- Workbooks saved to Tableau Public may contain any number of data source connections, but they must all be extracted and must not contain more than 15 million rows of extracted data each
Consider using Tableau Public when you want to share your data story with the world!
Publishing to Tableau Server and Tableau Cloud
Publishing to Tableau Server and Tableau Cloud is a similar experience. To publish to Tableau Server or Tableau Cloud, you’ll need to use Tableau Desktop and from the menu select Server | Publish Workbook. If you are not signed into a server, you will be prompted to sign in:
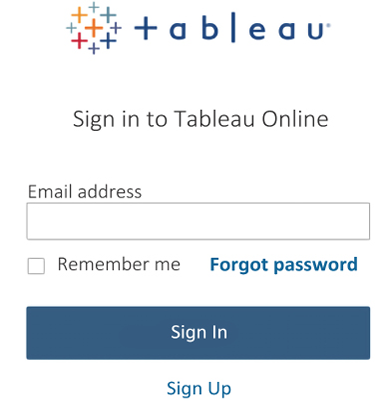
Figure 17.4: The sign-in screen for Tableau Cloud
You must have a user account with publish permissions for one or more projects. Enter the URL or IP address of the Tableau Server or the Tableau Cloud URL, your username, and password. Once signed in, you will be prompted to select a site, if you have access to more than one.
Finally, you will see the publish screen:

Figure 17.5: Publishing to Tableau Cloud
You have multiple options when you publish:
- Select the Project to which you wish to publish and Name your workbook. If a workbook has already been published with the same name as the selected project, you will be prompted to overwrite it.
- You may give the workbook a Description and use Add Tags to make searching for and finding your workbook easier.
- You may also specify which Sheets to include in the published workbook. Any sheets you check will be included; any you uncheck will not.
- You may edit user and group Permissions to define who has permission to view, interact with, and alter your workbook. By default, the project settings are used. Here is an example workbook with individual users and permissions:
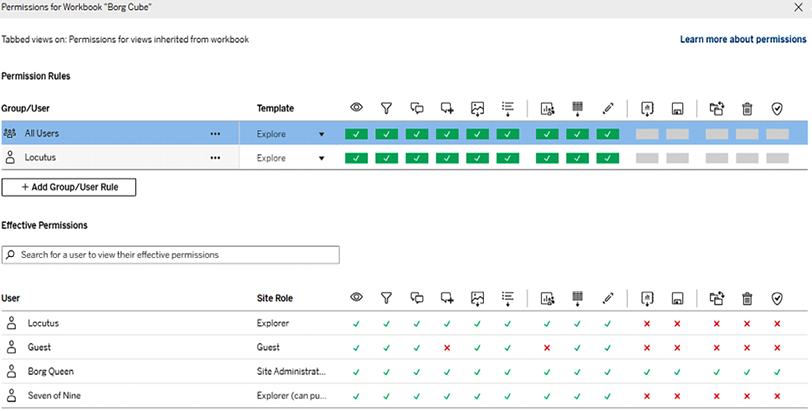
Figure 17.6: Tableau Server allows for a robust set of permissions. You can adjust individual and group permissions for viewing, filtering, commenting, editing, saving, and more
- You may edit properties for data sources. The options are described in detail in the next section.
- You also have the option to Show Sheets as Tabs. When checked, users on Tableau Server will be able to navigate between sheets using tabs similar to those shown at the bottom of Tableau Desktop. This option must be checked if you plan to have actions that navigate between views.
- Show Selections indicates that you wish any active selections of marks to be retained in the published views.
Editing data sources gives you options for authentication and scheduling:
- For each data connection used in the workbook, you may determine how database connections are authenticated. The options will depend on the data source as well as the configuration of Tableau Server. Various options include embedding a password, impersonating a user, or prompting a Tableau Server user for credentials.
- You may specify a schedule for Tableau Server to run refreshes of any data extracts.
Any live connections or extracted connections that will be refreshed on the server must define connections that work from the server. This means that all applicable database drivers must be installed on the server; all network, internet connections, and ports required for accessing database servers and cloud-based data must be open.
Additionally, any external files referenced by a workbook (for example, image files and non-extracted file-based data sources) that were not included when the workbook was published must be referenced using a location that is accessible by Tableau Server (for example, a network path with security settings allowing the Tableau Server process read access).
Using the Workbook Optimizer to maximize performance on Server or Cloud
When you initially publish a workbook to Tableau Server or Tableau Cloud, you will have the option to run the Workbook Optimizer prior to publishing (notice the Workbook Optimizer link at the bottom of the publish window in Figure 17.5. You can also run the optimizer at any time by selecting Server | Run Optimizer from the main menu.
The workbook optimizer evaluates your workbook and suggests various optimizations such as reducing calculation complexity, removing unused fields, checking the number of sheets used in dashboards, and much more. When you run the optimizer you’ll see a list of results and the optimizer’s suggestions as to whether you need to take action or merely review potential issues:

Figure 17.7: The Workbook Optimizer is a great option for increasing the efficiency of your workbook prior to publishing
Take a moment to review the suggestions and take any actions you feel are necessary.
The suggestions from the Tableau Workbook Optimizer are just that: suggestions. They are based on generally accepted best practices but are not always the best approach. For example, you may have long calculations that are actually quite efficient. Or you may have more than the generally recommended number of sheets in a dashboard, but it may be necessary your data story and it may not be negatively impacting performance. Use the suggested actions as guidance.
Once dashboards and views have been optimized and published to Tableau Server, you and other users with access will be able to interact with them. We’ll consider the details next.
Interacting with Tableau Server
After a workbook is published to Tableau Server, other users will be able to view and interact with the visualizations and dashboards using a web browser. Once logged in to Tableau Server, they will be able to browse content for which they have appropriate permissions. These users will be able to use any features built into the dashboards, such as quick filters, parameters, actions, or drilldowns. Everything is rendered as HTML5, so the only requirement for the user to view and interact with views and dashboards is an HTML5-compatible web browser.
The Tableau Mobile app, available for iOS and Android devices, can enhance the experience for mobile users. Use Tableau’s device designer to target layouts for specific devices.
For the most part, interacting with a workbook on Server or Online is very similar to interacting with a workbook in Tableau Desktop or Reader. Quick filters, parameters, actions, and tooltips all look and behave similarly.
You will find some additional features: the side menu gives you various options related to managing and navigating Tableau Server. Below that, you’ll find a breadcrumb trail informing you which workbook and view you are currently viewing.
Beneath that, you’ll find a toolbar that includes several features:

Figure 17.8: The Tableau Server toolbar
- Undo and Redo give you the ability to step backward and forward through interactions.
- Revert gives you the ability to undo all changes and revert to the original dashboard.
- Refresh reloads the dashboard and refreshes the data. However, this does not refresh any extracts of the data.
- Pause allows you to pause refreshing of the dashboard based on actions, filter selections, or parameter value changes until you have made all the changes you wish.
- View allows you to save the current state of the dashboard based on selections, filters, and parameter values so you can quickly return to it at a later point. You can also find your saved views here.
- Alert allows you to set up a conditional alert. When a mark in a view reaches a threshold you define, you will receive an alert through email. For example, you might have a line chart of profitability and expect an alert on a day when you meet an organizational goal. Or you might set an alert to receive notification when the count of errors indicated in the data exceeds
0. - Subscribe allows you to schedule periodic emails of a screenshot of the dashboard. Administrators may also subscribe other users. You might want to consider this option to distribute daily performance reports, sales updates, inventory counts, or any other information you want to push out!
- Edit allows you to edit the dashboard. The interface is very similar to Tableau Desktop. The Tableau Administrator can enable or disable web editing per user or group and also control permissions for saving edited views.
- Share gives you options for sharing the workbook. These options include a URL you can distribute to other licensed users, as well as code for embedding the dashboard in a web page.
- The Download button allows you to download the data, images of the dashboard, the
.pdf, or the workbook, as described earlier. - Comments give you the ability to collaborate with other Tableau Server users by making comments on the view and responding to the comments of others.
- Full Screen allows you to view the dashboard or view in full screen mode.
- Metrics (not shown in Figure 17.7) give you the ability to define key numbers or indicators that you wish to track.
Now that we’ve explored some of Tableau Server’s interactive capabilities, we’ll turn our attention to a specific interactive option on Tableau Server: Ask Data.
Leveraging Ask Data for a natural language guided analysis
Ask Data is a Natural Language Processing (NLP) feature available on Tableau Server and Tableau Cloud that allows you to query a data source using natural language phrases to ask questions of the data and get answers visually.
In order to use Ask Data, you will need to publish a data source and create a lens. To publish a data source from Tableau Desktop, select the data source you wish to publish from the Data menu and select Publish to Server.
Once published, you can create a new Lens. An Ask Data lens is a view of the data which defines a subset of data, limits the number of fields to those of interest, and optionally allows you to specify synonyms for fields so that natural language questions are more likely to find matches.
With the published data source, select New | Lens:
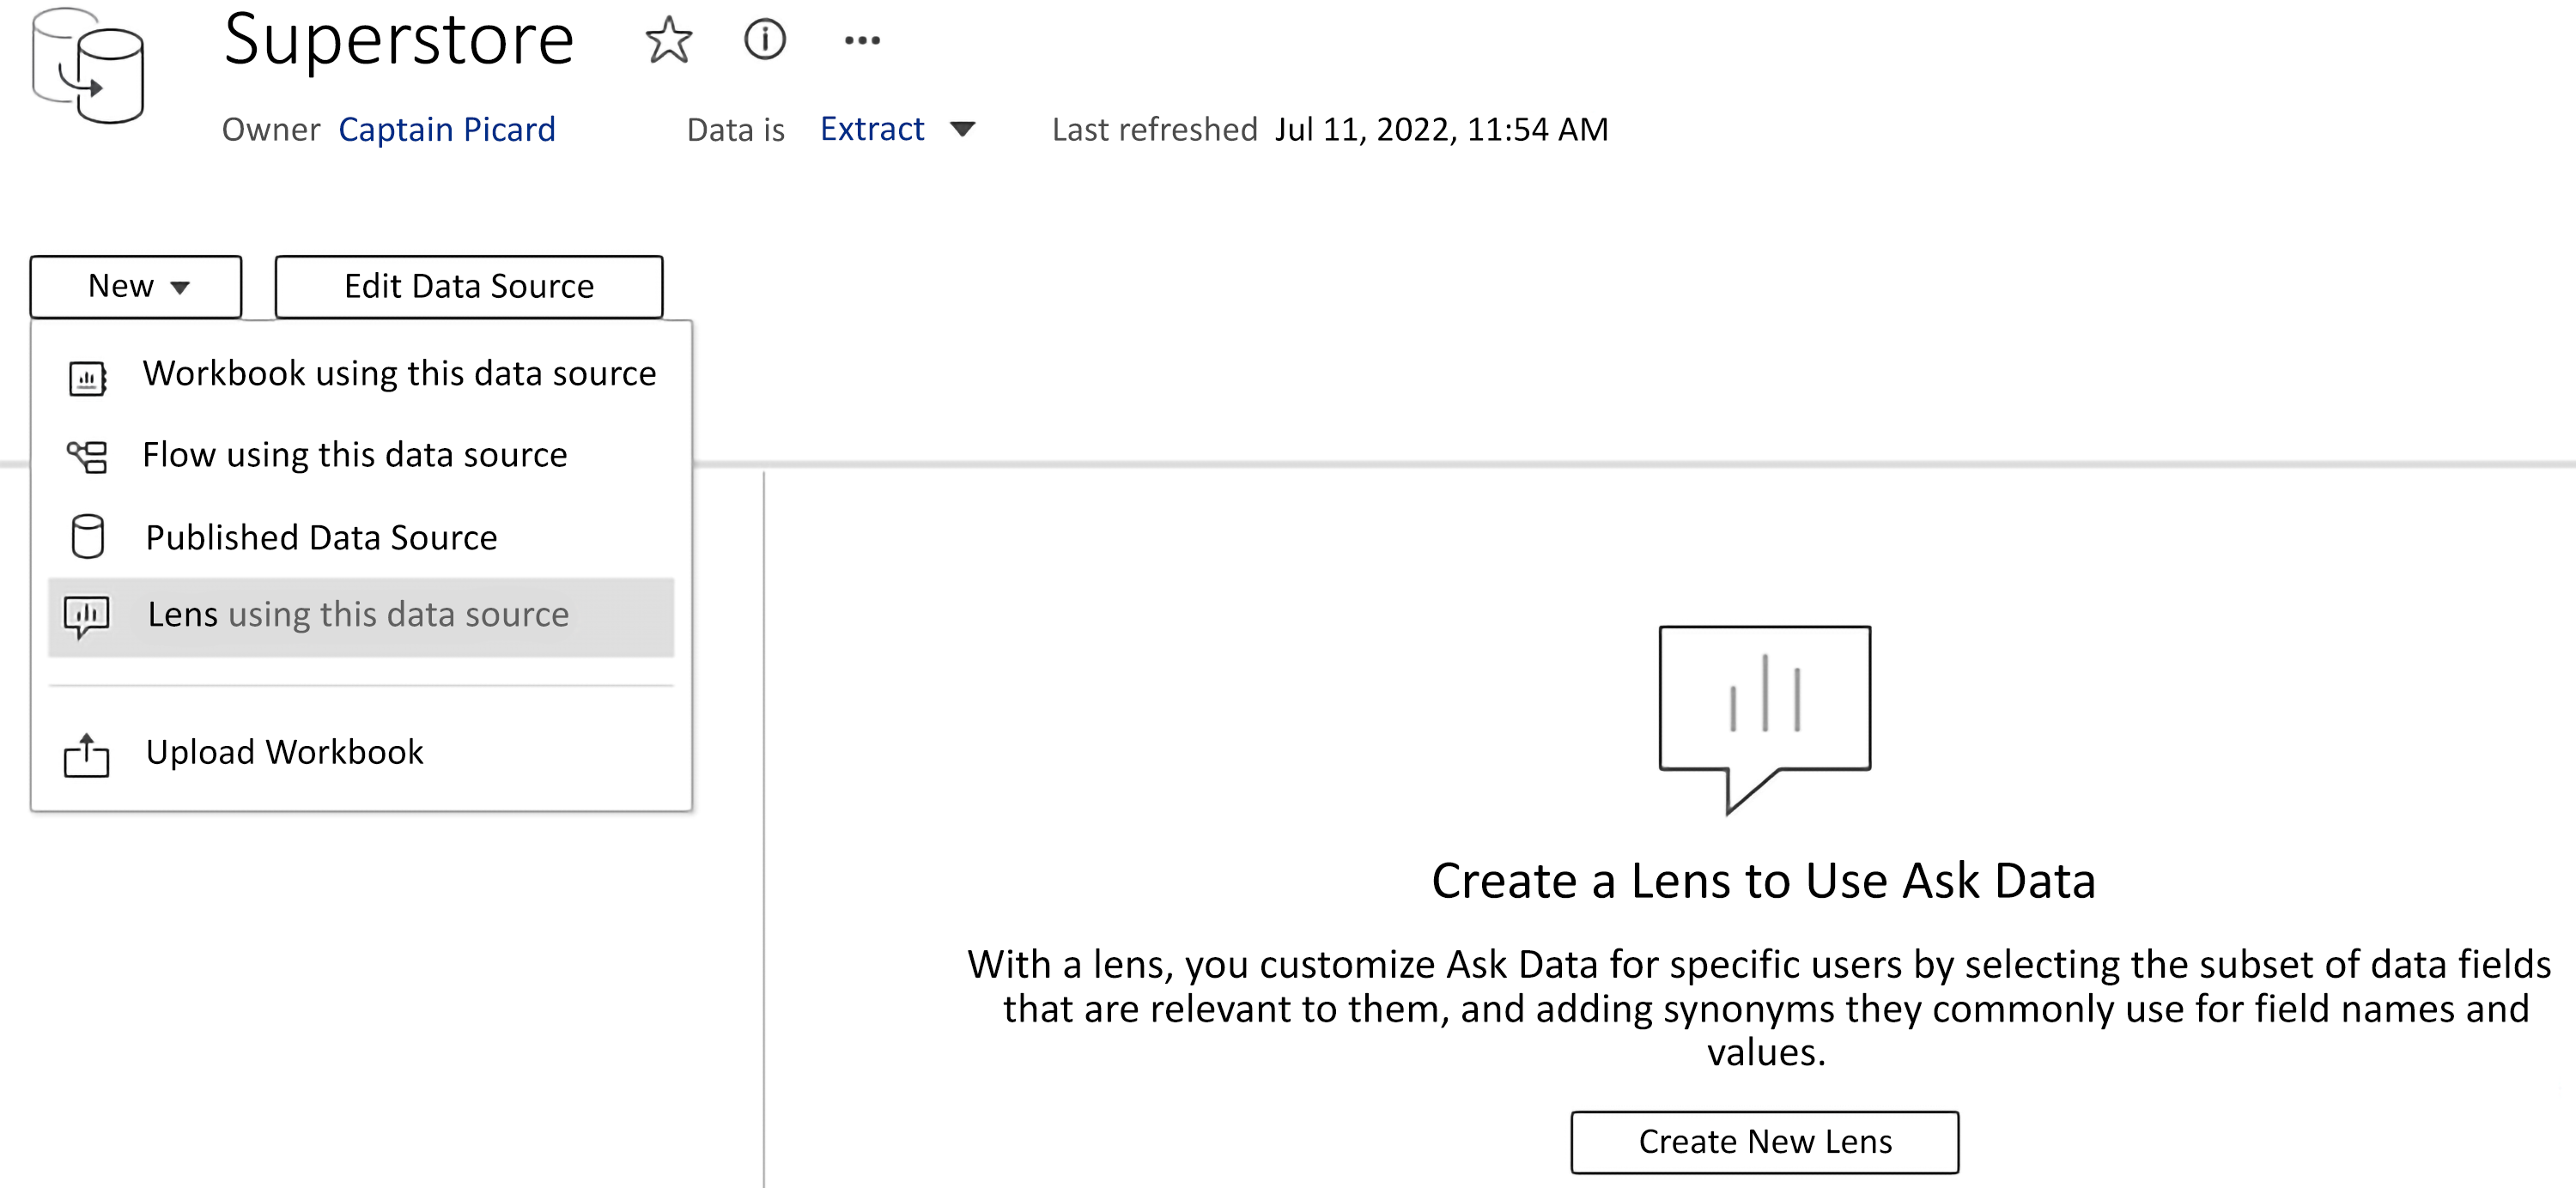
Figure 17.9: Creating an Ask Data Lens
Once you’ve defined the lens, you’ll be able to use it with Ask Data. In the following figure, you’ll observe the phrase “top 5 states by sales” typed into Ask Data’s search text box:

Figure 17.10: Typing a natural language phrase into Ask Data’s search
As you type, Ask Data will suggest possible fields, contexts, and definitions for phrases you’ve entered. If your phrase is not understood, you may select one or more of those suggestions to clarify your search.
Once you’ve completed your phrase, you may click the blue arrow in the search box to advance to a visual answer, like this:
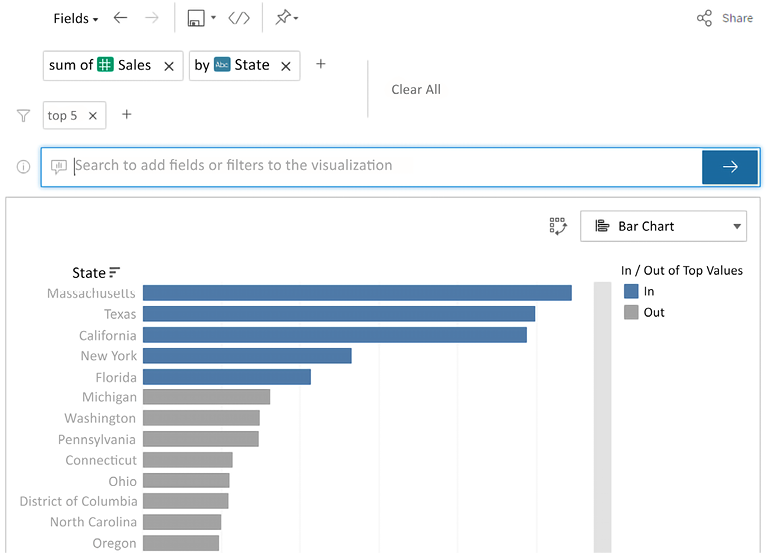
Figure 17.11: The visual response to the phrase “top 5 states by sales”
Ask Data interprets your phrase and gives you a visualization as a response. You also have a new text search box that allows you to narrow the focus or context of your initial query. For example, typing in 2022 into the text box and clicking the blue search arrow will add a date filter that limits to the top 5 states in 2022.
You’ll recall seeing the Ask Data object that can be added to dashboards. This enables you to embed the power of NLP in your dashboards. The only requirement is that you must use a data set that has been published to Tableau Server or Tableau Cloud and also publish the workbook to the same Server or Cloud.
The possibilities of using Ask Data for quick analysis and easy data discovery are amazing!
Having explored Ask Data, we’ll conclude with a final discussion of some additional options for sharing using Tableau Server and Tableau Cloud.
Additional distribution options using Tableau Server or Tableau Cloud
Both Tableau Server and Tableau Cloud provide several other options for sharing your views, dashboards, and data. Along with allowing users to log in to Tableau Server, you might consider the following options:
- Dashboards, views, and story points can be embedded in websites, portals, and SharePoint. Single-sign-on options exist to allow your website authentication to integrate seamlessly with Tableau Server.
- Tableau Server allows users to subscribe to views and dashboards and schedule email delivery. The email will contain an up-to-date image of the view and a link to the dashboard on Tableau Server.
- The tabcmd utility is provided with Tableau Server and may be installed on other machines. The utility provides the ability to automate many functions of Tableau Server, including export features, publishing, and user and security management. This opens up quite a few possibilities for automating delivery.
- The REST API allows programmatic interaction with Tableau Server. This gives you a wide range of options for exporting data, images, and documents and distributing to users as well as access to usage statistics, users, permissions, and more!
All these options greatly extend the flexibility of distributing data and visualizations to those in the organization who need them most!
Summary
Tableau is an amazing platform for exploring, prepping, and cleaning your data as you create useful and meaningful visualizations and dashboards to understand and communicate key insights. Throughout this book, we’ve considered how to connect to data—whether file-based, in an on-premises database, or in the cloud. You’ve worked through examples of exploring and prepping data to clean it and structure it for analysis. We’ve covered numerous types of visualization and how they can uncover deep analytical insights. The four main types of calculations were explored in depth, giving you the tools to extend the data, analysis, and user interactivity. You’ve built dashboards and told stories with the data. In this chapter, we considered how to share the results of all your work with others.
You now have a solid foundation. At its core, the Tableau platform is intuitive and easy to use. As you dive deeper, the simplicity becomes increasingly beautiful. As you discover new ways to understand your data, solve complex problems, ask new questions, and find new answers in your datasets, your new Tableau skills will help you uncover, interpret, and share new insights hidden in your data.
Join our community on Discord
Join our community’s Discord space for discussions with the author and other readers: https://packt.link/ips2H
