6
Defining What the System Shall Do: Functional Architecture
6.1. Why understand what the system does?
Functional architecture, or equivalently functional analysis, intends to precisely describe the different functions of a system and their relative interactions1. The core motivation of functional architecture is to start understanding and specifying in detail the system, but only in terms of behaviors – that is, in other terms, to understand and specify what the system does – and not concrete structure, that is, its functional nature … as we would have easily guessed!
It is indeed important to have first a functional description of a system, and not to immediately dig into the technique, if we want to be able to rationally manage trade-offs between different options2. Functional architecture is indeed usually independent of the technological choices3 at least at some level of abstraction, which means that functionally reasoning – of course at the good level of abstraction4 – on a system allows us to reason at the same time on many different constructional options that we will be able to compare and to evaluate later (for more details, see Chapter 9 which is dedicated to trade-off analyses). We must indeed understand that skipping functional analysis by directly going to technical design is usually a very bad practice, even if widespread in engineering organizations, since it just means that we are making a very strong design choice without even being conscious of that choice. As a consequence, we will just be glued in that choice, without being able to move to radically different options that might be more adapted.
We must also stress that functional architecture is absolutely fundamental to capturing emergence and transversal behaviors that can only be modeled using its tools. By definition, all emergent behaviors can indeed not be captured by constructional architecture since they are functional properties of an integrated system (we refer to section 1.2 for more details). We must hence use functional architecture to describe and model such properties. As an immediate consequence, functional architecture is a key tool to structure transversal collaboration in an engineering organization whose purpose is indeed to efficiently manage the emergent transversal behaviors of a system.
Last, but not least, functional architecture also allows us to organize a system in functionally decoupled – as much as possible – sub-systems. This is very important if we want to avoid too many impacts when there is a change in a system design5. As already pointed out previously, this idea gives rise to layered functional architectures where each functional layer is strictly functionally segregated from the other ones by fixed standard functional interfaces that are managed in configuration. This architectural functional segregation/decoupling principle provides huge flexibility: in an ideal world, we will indeed be able to change a function in one layer without any impact on the other layers, as soon as the functional interfaces between layers are respected. We refer to the concrete examples of systems organized according to such a principle that are provided in the example section of Introduction and in the functional architecture subsection of section 3.2.
6.2. The key deliverables of functional architecture
For any system S, functional architecture has five core types of deliverables:
- 1) The functional requirement architecture diagram that hierarchically organizes all functional requirements – with respect to S – according to a refinement hierarchy.
- 2) The functional mode diagram that describes how S passes – with indication of the associated events – from a functional mode to another one, starting from its birth up to its death.
- 3) The functional breakdown and interaction diagrams that are describing – in a purely static way – the functions of S with their internal and external interactions7.
- 4) The functional scenario diagrams that are describing – in a dynamic way – the interactions between the functions of S and possibly the environment, in a given functional mode.
- 5) The functional flow diagrams that synthetize all flows – with their logical relationships – absorbed or produced by the functions of S during the “functional mode cycle”8 of S.
These different types of deliverables are presented more in detail below.
6.2.1. Functional requirement architecture diagram
Let S be a system. The functional requirement architecture diagram of S is then a hierarchical exhaustive representation of all functional requirements of S, a functional requirement R1 being under another functional requirement R2 in this hierarchy if and only if we can logically deduce R1 from R29. In this last situation, we say then more precisely that R2 refines into R1, which explains why we speak of a functional requirement refinement hierarchy10.
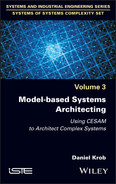
Figure 6.1 illustrates here a (partial) functional requirement architecture diagram for an electronic toothbrush, a functional requirement being – classically and similarly to a need – represented here by a 2-part box, whose first top part is a short name summarizing the functional requirement scope and whose second bottom part is the functional requirement statement, the refinement relations, on which relies the functional requirement hierarchy, being – also classically – represented by arrows.

Figure 6.1. Example of a functional requirement architecture diagram for an electronic toothbrush
Note that the same issue, already pointed out for the need requirement architecture diagram, also takes place with the functional requirement architecture diagram: organizing a functional requirement refinement hierarchy is indeed always difficult since we shall avoid having too many first level functional requirements, but of course also too many levels of refinements, if we want to be able to efficiently use such a view. The 7x7x7 rule (see the first part of section 4.2) is again a precious tool to handle this real difficulty. As a consequence, a typical “good” functional requirement architecture diagram associated with a system shall have no more than seven high-level functional requirements, each of them refined in around seven medium-level functional requirements, finally also refining in the same way into seven low-level functional requirements. Note again that the number 7 shall just be taken as an order of magnitude. Obtaining up to 10–12 high-level functional requirements in a functional requirement architecture diagram could of course work: however, we must not go further without analyzing whether this number is justified. Finally, we shall not hesitate to construct as many additional functional requirement architecture diagrams as necessary, for refining such an analysis as soon as all relevant functional requirements are not derived and/or captured.
6.2.2. Functional mode diagram
Let S be again a system. The functional mode diagram of S is then a representation of:
- – the functional modes of S, with their relative temporal relationships, that is, consecutiveness, inclusion or simultaneity11;
- – the events that cause the different transitions between each functional mode of S and the immediate consecutive ones from a temporal perspective.
The standard representations of the temporal relations between functional modes introduced above are given – mutatis mutandis – by Table 5.1, if we now interpret C and D as functional modes.

Figure 6.2. Example of functional mode diagram for an electronic toothbrush
The above Figure 6.2 provides in particular an illustrative functional mode diagram associated with an electronic toothbrush, taking here the standard representation of functional modes and of their temporal relationships that we introduced, when events – that induce functional mode transitions – are modeled by arrows labeled with the name of the relevant event. Note also that the initial (respectively, termination) events in each functional mode do not respect this rule since they are conventionally modeled by small black circles (respectively, by white circles containing a black circle).
It is finally important to understand that the functional mode diagram is key since it models – from a functional perspective – time. Following the intuition that we developed at the end of the second paragraph of section 5.2, we could say that the next diagrams – that is, the functional breakdown and interaction diagrams – are modeling the “functional space” in which functions are evolving. Since space and time are always required to specify any functional behavior (that takes place “functionally somewhere” at a certain time), these two diagrams are completely complementary.
6.2.3. Functional breakdown and interaction diagrams
Let S be a system. The functional breakdown diagram associated with S is then a hierarchical representation of the functions of S, a set F1, F2, …, FN of functions being under another function G in this hierarchy if G is the result of the integration – in the meaning of Definition 1.512 – of the functions F1, …, FN13 (F1, …., FN are then classically called “sub-functions” of G). The functional interaction diagrams associated with S are then just the different representations – there is one functional interaction diagram per integration relationship involved in the functional breakdown diagram – of each such integration relationship that exists between the different functions appearing in the hierarchy modeled by the functional breakdown diagram.

Figure 6.3. Example of a functional breakdown diagram for an electronic toothbrush
Figure 6.3 above now provides an illustrative partial example of the functional breakdown diagram for an electronic toothbrush, where the integration relationships on which this hierarchy relies are – quite classically – represented by squared arrows.
We also give an example of a functional interaction diagram for an electronic toothbrush that can be found in Figure 6.4. In this example, we modeled the integration relationship existing between the global function of the toothbrush and its first “sub-functions” (using the formalism of a classical “activity diagram” in the UML or SysML meaning; see Booch et al. (2004) or Friedenthal et al. (2012)). Note also that external interfaces are here – quite classically – represented by white squares at the border of the external oval that is representing the integrated function (here the global function of an electronic toothbrush).

Figure 6.4. Example of a functional interaction diagram for an electronic toothbrush
The functional breakdown of a system S modeled by the functional breakdown diagram is also classically called the functional breakdown structure (FBS) of S. Similarly to the mission breakdown structure that we introduced in the last chapter, it gives the exhaustive dictionary of the functions of the system and thus has a key role in guaranteeing a common understanding on the functional scope of a system, which is mandatory for an efficient transversal collaboration between the different actors and stakeholders of a system development project.
We must, however, be aware of the readability of such a view. All the recommendations based on the 7x7x7 rule that we previously gave for the stakeholder and need architecture diagrams of course also apply – mutatis mutandis – to efficiently model the functional breakdown structure of a system.
Last, but not least, we refer to Figure 1.9 in Chapter 1 for a concrete functional interaction diagram associated with an aircraft: it represents how all first-level sub-functions may be integrated to obtain the high-level global function of an aircraft. Other examples of concrete functional interaction diagrams may also be found in the example section of Introduction.
6.2.4. Functional scenario diagrams
Let S again be a system and q(S) a functional mode of S. A functional scenario diagram associated with S and q(S) is then a dynamic representation of the interactions that are taking place between the functions of S, and possibly the environment, during the period of time which is modeled by q(S).
The below Figure 6.5 shows an example of functional scenario diagram, associated with the “active” functional mode of an electrical toothbrush. We refer to the suitable paragraph of section 3.4.2 for the fundamentals of the semantics of this representation. However, we are obliged to introduce richer semantics with respect to the one that was introduced in section 3.4.2. The below diagram indeed expresses that, as far as the electronic toothbrush is in an active mode (which was modeled by the big box with “loop” on its top left and the “[active mode]” indication14 in its top middle), it shall do in parallel (which was modeled by the big box with “par” on its top left), that is, at the same time, three types of operations (that are separated by dashed lines in the “par” big box): the first one being brushing force management, the second one being brushing data management and the third one being energy management. For the sake of completeness, we shall also know that there exists an “alt” (for alternative) box which allows us to express “if then otherwise” situations15.
A functional scenario diagram provides the explicit “algorithm” which is underlying to the functional behavior of the system in a given functional mode. This is key to finally understanding what – at least functionally – happens during a given functional mode. The enriched semantics that we introduced indeed allows us to express any distributed algorithmic property of a system16.

Figure 6.5. Example of a functional scenario diagram for an electronic toothbrush. For a color version of this figure, see www.iste.co.uk/krob/systems.zip
6.2.5. Functional flow diagram
Let S be a system. The functional flow diagram associated with S is a consolidated description of all the functional flows associated with S and of:
- 1) their logical relationships;
- 2) their abstraction relationships (see the last paragraph of Chapter 5).
Hence, it plays the role of the functional “data model”17 of the system. Note that we also may split this diagram into two diagrams, each of them covering the two above points.
Figure 6.6 below shows an example of (partial) functional flow diagram, associated with an electrical toothbrush. Its syntax exactly follows the same principles as the operational flow diagram (see the last section of Chapter 5).

Figure 6.6. Example of the functional flow diagram for an electronic toothbrush
As already stated, the functional flow diagram defines the functional flow or object model of a given system. It is completely “dual” to the functional breakdown, interaction or scenario diagrams since it focuses on flows and not on the functions of the system that are producing these flows.
We must thus again emphasize that such a diagram is of high importance since it rationally describes in a consolidated and organized way all inputs and all outputs of the functions of a given system. Hence, it gives the functional “dictionary” of the system, that is, the list of all objects that are functionally manipulated by the system. This dictionary is of high value for ensuring a common vision between all project actors involved in the architecting process: these actors shall normally – in an ideal world – only use the terms of that dictionary when discussing a functional object. We may easily understand that such a principle allows us to avoid any ambiguity between the different project actors. It is thus again key for ensuring a good collaboration between these actors.
- 1 And also, how these functions are connected to missions. This point – even if important – will, however, not be addressed in this book since it can be easily addressed through a suitable mission to function allocation matrix.
- 2 Functional architecture allows in particular us to make early cost analysis, as soon as we have an idea of the average cost of an elementary function (see also the Constructive Cost Model for Systems – COSYSMO – Valerdi (2008)). Such a feature is especially interesting for trade-offs that may also be done at the functional level (typically in order to choose between two competing functional architectures for a given system).
- 3 The “produce torque” car function is for instance totally independent of the technology: it exists in any car, either with a thermic, or an electrical engine.
- 4 As a consequence of that simple remark, functional architecture is absolutely of NO USE if its analyses go into too much detail. A detailed functional architecture indeed usually either 1) overlaps with constructional architecture, as soon as the detailed functions identify with the high-level functions of the components of the system of interest, or 2) is totally misaligned with the constructional architecture (which means that the identified functions do not naturally map with the components). In the first case, functional architecture overlaps with constructional architecture since the two analyses provide exactly the same semantics. In the second case, functional architecture is dangerous since its results – which have here no concrete value – may mislead the system designers. In the two cases, it is therefore a waste of time and money.
- 5 See the Case study 7.1 in the next chapter to see what can unfortunately happen in the case of a design evolution …
- 6 A radar business model is indeed based on, first, a fixed initial price that just covers development costs and, secondly, a yearly maintenance fees on which the radar constructor is making its benefit. We can therefore easily understand that permanent bugs are just destroying such a radar business model.
- 7 Usually, only at the global level, as well as possibly in only a given functional mode.
- 8 That is, the period of time modeled by the functional mode diagram.
- 9 Remember that functional requirements are logical predicates (see section 3.4.2).
- 10 An additional important property of a functional requirement architecture is coverage: we shall try to construct the functional requirement architecture diagram in order to maintain the coverage logical property FR1 ∧ … ∧ FRn → FR0 for all functional requirements FR1, …, FRn which are under a given functional requirement FR0 in such a diagram.
- 11 We refer to the second paragraph of section 5.2 in this matter.
- 12 Considered here uniquely for its functional scope.
- 13 Due to our definition of the integration operator, this hierarchy is therefore an abstraction hierarchy.
- 14 This indication means “as soon as”. Hence, we meant here “as soon as the system is in active mode”.
- 15 The “if then else” situation is expressed by a big box labeled “alt” on its top right, split into two parts – Part 1 (top) and Part 2 (bottom) – separated by a dashed line, with a “condition” statement at its top middle. Its semantics is that when the “condition” is satisfied (respectively, not satisfied), the system shall do the instructions of Part1 (respectively, Part 2).
- 16 This comes from the fact that the usual algorithms only require the “while” (modeled by the “loop” box) and the “if then else” (modeled by the “alt” box) operators. When we pass to distributed – that is, parallel – algorithms, it is then sufficient to add the “parallel” operator (modeled by the “par” box) to get full expressivity.
- 17 Beware that, even if we use the syntax of a data model for the functional flow diagram, this last diagram is not really a data model in the usual way, since it does not represent (only) data, but also physical objects, business objects or even informal information that may be functionally exchanged with “humanware” stakeholders of a given system.