There are several drop-in replacements for pdb. They usually have a better interface. Some of the console-based debuggers are as follows:
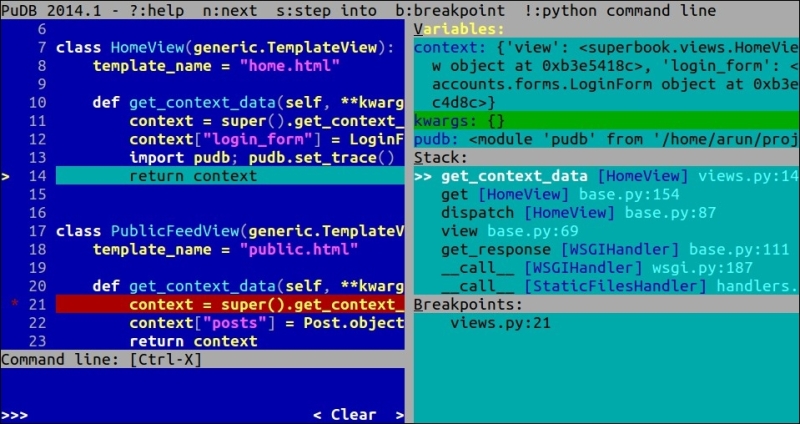
PuDB is my preferred replacement for pdb. It is so intuitive that even beginners can easily use this interface. Like pdb, just insert the following code to break the execution of the program:
import pudb; pudb.set_trace()
When this line is executed, a full-screen debugger is launched, as shown here:

Press the ? key to get help on the complete list of keys that you can use.
Additionally, there are several graphical debuggers, some of which are standalone, such as winpdb and others, which are integrated to the IDE, such as PyCharm, PyDev, and Komodo. I would recommend that you try several of them until you find the one that suits your workflow.
