
In the movie Jerry Maguire, the signature line is "Show me the money!" It's repeated over and over again. Every business owner asks a very similar question, "Where did the money go?", and they ask it over and over again.
This time we are the company in need of a report. We are a business services consulting and software sales organization.
One of the owners wants to know where the cash is being spent. The owner feels this will assist him in keeping close tabs on expenditures as they are occurring rather than at the end of the period.
We will produce a simple list subtotaled by who was paid and how much they were paid. Monitoring this report on a regular basis (for example, weekly) could be confusing if you base it on a transaction date (that is, post something for today with a GL posting date of last week and it would miss the report altogether). So, we will monitor this information by the actual date it was posted. Also, since it is cash that is being monitored, we will display incoming cash as well.
For this report, we will use Microsoft SQL Report Builder as our tool. This will allow us to deploy the report in Microsoft SharePoint, which allows our owner to access it.
There are two parts to these steps. The first part is technical, containing steps that involve work on SQL Server. The second part is the actual building of the report. You may choose to obtain assistance with the technical part, especially if you do not have access to SQL Server.
If you are not experienced in working on Microsoft SQL Server, request your IT Department or Microsoft GP partner to assist you. You may corrupt your data and completely break your system if you are not careful. You should also have the SQL Server system administrator password.
Create the following view in SQL Server, using SQL Server Management Studio.
Tip
For directions on creating a view, follow the technical matter steps of the first report in Chapter 2, Business Intelligence for the General Ledger.
This is the kind of view that you can literally run your business on. It's worth the effort to see how cool this is:
- Paste the following code in the SQL Pane:
CREATE VIEW view_BI_BR_TRX AS SELECT dbo.GL00105.ACTNUMST AS 'Account_Number', dbo.GL00100.ACTDESCR AS 'Account_Name', dbo.CM00100.CHEKBKID AS 'Checkbook_ID', dbo.CM00100.CURRBLNC AS 'Current_Bank_Balance', dbo.GL20000.JRNENTRY AS 'Journal_Number', dbo.GL20000.TRXDATE AS 'Transaction_Date', YEAR(dbo.GL20000.TRXDATE) AS 'Transaction_Year', MONTH(dbo.GL20000.TRXDATE) AS 'Transaction_Month', CASE dbo.GL20000.SERIES WHEN 2 THEN dbo.GL20000.REFRENCE ELSE dbo.GL20000.ORMSTRNM END AS 'Source_Name', dbo.GL20000.DEBITAMT AS 'Debit', dbo.GL20000.CRDTAMNT AS 'Credit', dbo.GL20000.DEBITAMT - dbo.GL20000.CRDTAMNT AS 'Net', CASE WHEN (dbo.GL20000.DEBITAMT - dbo.GL20000.CRDTAMNT) < 0 THEN 'Decrease' ELSE 'Increase' END AS Effect, CASE dbo.GL20000.SERIES WHEN 2 THEN 'Financial' WHEN 3 THEN 'Sales' WHEN 4 THEN 'Purchasing' WHEN 5 THEN 'Inventory' WHEN 6 THEN 'Payroll' WHEN 7 THEN 'Project' ELSE 'Other' END AS Series, dbo.GL20000.ORPSTDDT AS 'Date_Posted', dbo.GL20000.SOURCDOC FROM dbo.GL20000 INNER JOIN dbo.GL00100 ON dbo.GL20000.ACTINDX = dbo.GL00100.ACTINDX INNER JOIN dbo.GL00105 ON dbo.GL00100.ACTINDX = dbo.GL00105.ACTINDX INNER JOIN dbo.CM00100 ON dbo.GL00105.ACTINDX = dbo.CM00100.ACTINDX WHERE (dbo.GL20000.VOIDED = 0) AND (dbo.GL20000.SOURCDOC <> 'BBF') UNION SELECT dbo.GL00105.ACTNUMST AS 'Account_Number', dbo.GL00100.ACTDESCR AS 'Account_Name', dbo.CM00100.CHEKBKID AS 'Checkbook_ID', dbo.CM00100.CURRBLNC AS 'Current_Bank_Balance', dbo.GL30000.JRNENTRY AS 'Journal_Number', dbo.GL30000.TRXDATE AS 'Transaction_Date', YEAR(dbo.GL30000.TRXDATE) AS 'Transaction_Year', MONTH(dbo.GL30000.TRXDATE) AS 'Transaction_Month', CASE dbo.GL30000.SERIES WHEN 2 THEN dbo.GL30000.REFRENCE ELSE dbo.GL30000.ORMSTRNM END AS 'Source_Name', dbo.GL30000.DEBITAMT AS 'Debit', dbo.GL30000.CRDTAMNT AS 'Credit', dbo.GL30000.DEBITAMT - dbo.GL30000.CRDTAMNT AS 'Net', CASE WHEN (dbo.GL30000.DEBITAMT - dbo.GL30000.CRDTAMNT) < 0 THEN 'Decrease' ELSE 'Increase' END AS Effect, CASE dbo.GL30000.SERIES WHEN 2 THEN 'Financial' WHEN 3 THEN 'Sales' WHEN 4 THEN 'Purchasing' WHEN 5 THEN 'Inventory' WHEN 6 THEN 'Payroll' WHEN 7 THEN 'Project' ELSE 'Other' END AS Series, dbo.GL30000.ORPSTDDT AS 'Date_Posted', dbo.GL30000.SOURCDOC FROM dbo.GL30000 INNER JOIN dbo.GL00100 ON dbo.GL30000.ACTINDX = dbo.GL00100.ACTINDX INNER JOIN dbo.GL00105 ON dbo.GL00100.ACTINDX = dbo.GL00105.ACTINDX INNER JOIN dbo.CM00100 ON dbo.GL00105.ACTINDX = dbo.CM00100.ACTINDX WHERE (dbo.GL30000.VOIDED = 0) AND (dbo.GL30000.SOURCDOC <> 'BBF') GO GRANT SELECT ON view_BI_BR_TRX TO DYNGRP - After you have pasted the code in the SQL Pane, click on the ! Execute button from the ribbon.
Tip
See the technical portion of the first report (Balance sheet dashboard) in Chapter 2, Business Intelligence for the General Ledger for more details on creating a view and granting security.
Let's prepare and connect to the data:
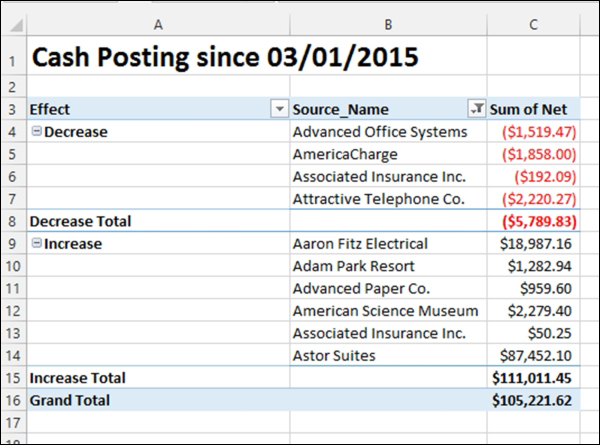
Know what you want. We've already completed this step, as shown in the following screenshot:
Tip
As always, we must know what we want our end result to look like before we start. Draw it on a paper or perform a mock-up in Excel. Starting with the end result in mind will save you many, many hours of time. We'll say this over and over again because it's that important! The preceding screenshot shows, how we want our report to look like.
Let's make a connection to the GP data. Flip back a few pages to the previous report to see the next few steps with screenshots.
- Open the New Report or Dataset window in SQL Server Report Builder.
- In the New Report or Dataset window, select New Report, and then select Table or Matrix Wizard.
- The next screen is to choose a dataset. The Create a dataset option is marked by default. Click on Next.
- The next screen is to choose a connection to a data source. Click on the New button and the Data Source Properties window will open.
- Give this data source the name WhereTheMoneyGoes, keep the connection type Microsoft SQL Server, and click on the Build button.
- The Connections Properties window will open.
- Enter the name of your Microsoft SQL Server, your network or AD login as the User name along with the GP password, and the database that this report is for. Then, click on OK to close the Connections Properties window.
- Click on OK to close the Data Source Properties window.
- Click on Next in the New Table or Matrix window.
- On the Enter Data Source Credentials window, enter your GP user ID and password and click on OK.
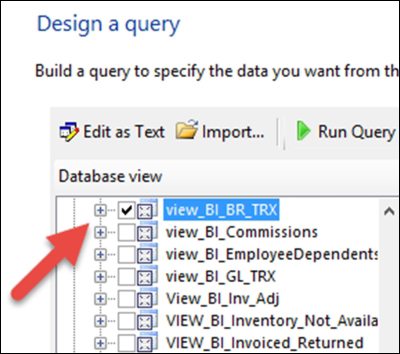
- We are now prompted to Design a query. Now, we will select the view that was just created (technical matter). Click on the plus sign next to Views in Database view, and find view_BI_BR_TRX and select it by checking the box. Then, click on Next to close the New Table or Matrix window:
Let's build the report:
- In the Arrange fields window, drag Effect and Source_Name to Row groups, Series to Column groups, and Net to Values. Make sure that Effect is above Source_Name. Click on Next:
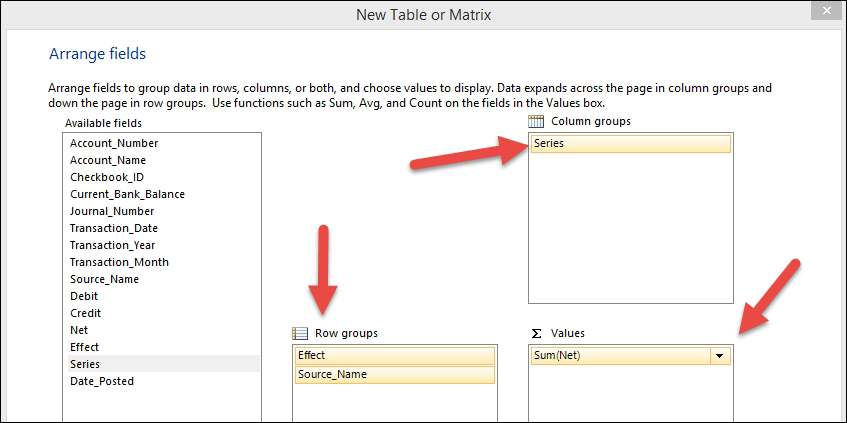
This view will display Source_Name as the reference if the transaction originated in the financial series. If the transaction originated in any other series, it will display the originating master name (that is Vendor, Customer, or Employee).
- On the Choose the layout window, change nothing, leaving Show subtotals and grand totals and Expand/collapse groups checked. Leave the Blocked, subtotal below option marked. Then, click on Next.
- The Choose a style option is about fonts and color schemes. Feel free to change it for your report. We're leaving the default of Ocean selected. Click on Finish.
- Time to save your work. Click on the Save icon in the top-left corner. For now, save it as you would do with an Excel file.
Let's edit and format the report:
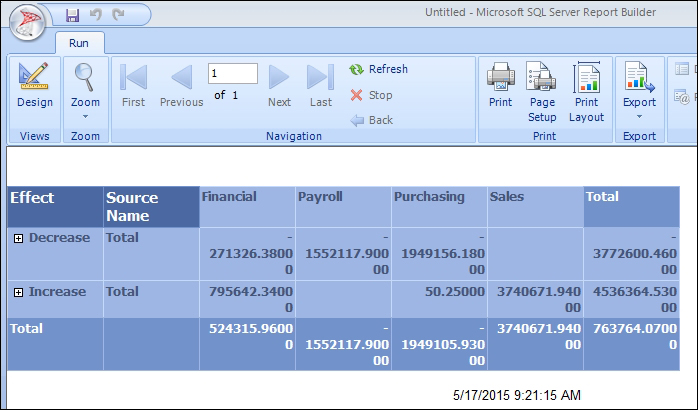
- Now that we've connected the data, let's take a look at what the report looks like as our starting point. In the top-left corner, click on the Run button.
- Your results should look like the following screenshot. You'll notice that if you click on the + sign next to Decrease or Increase, you'll see the details. We've narrowed it down by "series" to simply make it easier to understand where in GP the data exists:
- Click on Design at the top-left and we'll be back to the pasteboard or report design area to begin formatting.
- To format the amount fields as currency, use the Text Box Properties window and the Placeholder Properties (this is the Text Box Properties for the Total rows) for both the Total rows and columns. Make sure to format all the six areas:

- Save the file as a precaution by navigating to File | Save.
- We resized our fields by clicking on the table and then clicking on the line between the columns (resizing as we would in Excel).
Let's add a parameter:
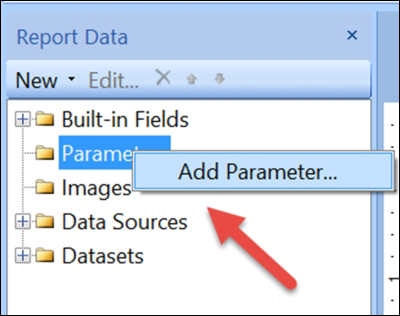
- Now it's time to add a place where we can enter a posting date. This will allow you to view only those transactions posted on or after a certain date, regardless of what period they are posted to in GP. In the Report Data pane, right-click on Parameters and choose Add Parameter:
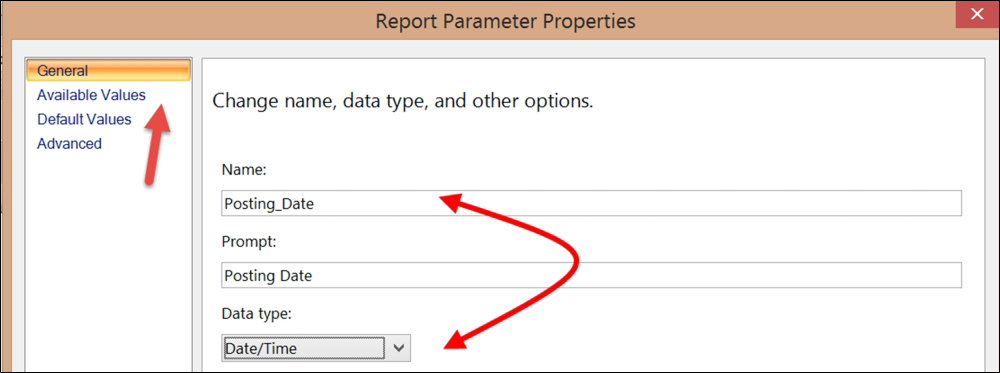
- On the Report Parameter Properties window on the General view, enter Posting_Date in the Name: field and Posting Date in the Prompt: field. Change the Data type field to Date/Time and click on OK:
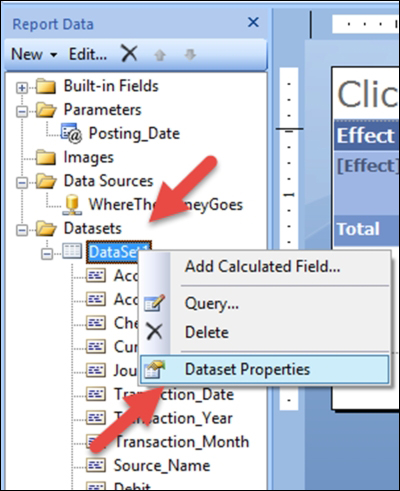
- Now, we have to link this new parameter (which is a field we will input at the time of running the report) to the actual date the transaction was posted (again, this is not the transaction or period date). In the Report Data pane, click on the + sign next to Datasets to expand and see DataSet1. Right-click on DataSet1 and select Dataset Properties:
- In the Dataset Properties window, click on the Filters view and then the Add button to create a filter.
- Click on the drop-down list for Expression and select [Date_Posted], which is a field in our SQL View.
- Choose the >= operator, which will yield only those transactions that were posted on or after a certain day:

- Click on the fx function button.
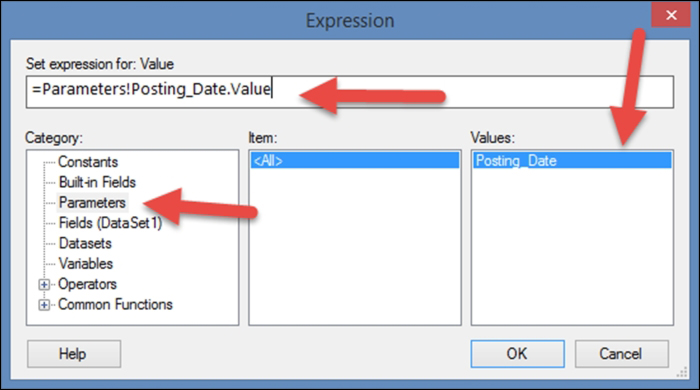
- In the Expression window, select Parameters from the Category pane and then double-click on Posting_Date in the Values pane. This will create the expression in the Set expression for: Value pane, as shown in the following screenshot:
- Click on OK to close the Expression window. Click on OK to close the Dataset Properties window.
- Save the file as a precaution by navigating to File | Save.
Let's add some finishing touches:
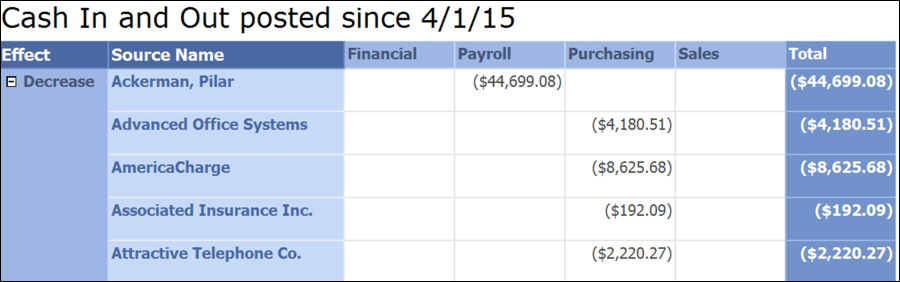
- Finally, let's change the title of the report. Click on the Click to add title field (like we did before) and enter
Cash In and Out posted since. Make sure to leave space aftersince, and then click on the outside of the title. We just hit the spacebar a couple of times. We also used the handles around the title, dragging it to the width of the report. - In the Report Data pane on the left-hand side, click on the + sign to open the Parameters object, and then click on the Posting_Date parameter to select it.
- Drag the Posting_Date parameter to the end of the title so it looks like the following:

- Since the date fields are stored with both date and time, let's format the date part of the title to see only the date. Click on the [@Posting_Date] portion of the title and only that field will be highlighted:
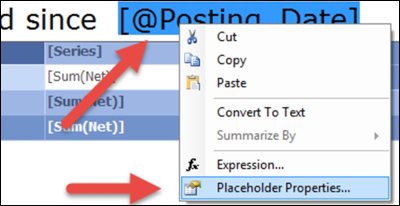
- Right-click on this field and change the date in Placeholder Properties as we did before.
- Save the file as a precaution by navigating to File | Save.
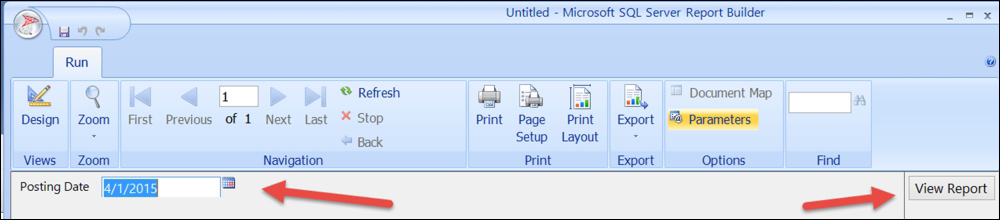
- Run your report (as before). You'll first need to enter Posting Date on the top-left. Remember: this date represents the oldest date for posted transactions you want to see. After entering the date, click on the View Report button in the top-right corner and the report will display:
Tip
Building this report with the Fabrikam database will yield all kinds of strange dates. Change the year in the dates to a year two or three in the future (for example, in 2014, change it to 2016) and run, then change the year to one more in the future (in our example, 2016 becomes 2017) and run. You'll see the data change in the report.
- Your final report should look similar to the following:
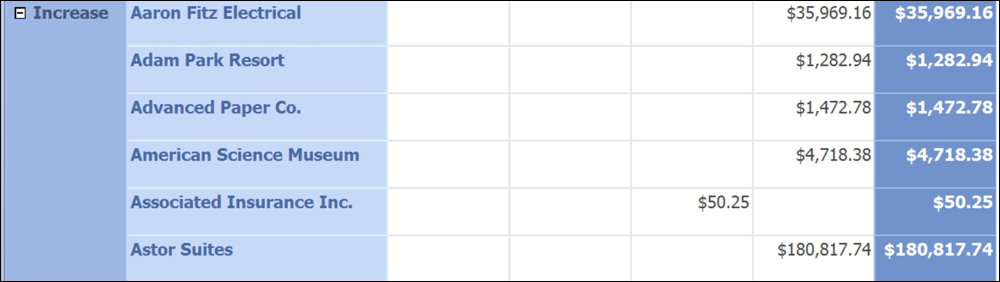
With the lower portion looking like the following:
- Now, you can save and deploy this to SharePoint, Dynamics Business Analyzer, and GP, or just run it from your browser.
Tip
Here are some additional areas you may want to change:
- Have the report default to a date, such as the first day of the month or today.
- Filter out the payroll series to prevent employee names from displaying (if you do not use the payroll module, it will not display, so do not bother with the extra work to remove it.)