
How many items are in your inventory that are either trapped in a status that makes them unavailable, or haven't been sold during the last 12 months? If an item is returned from a customer using SOP, the user is asked whether to make it reavailable for sale or unavailable by marking it as returned, in service, in use, or damaged. Any of these last four options will still make the item show in your inventory valuation and count, but the items are not reflected in the quantity available to either resell or allocate/fulfil. This report will show all of these problems in a super easy-to-read dashboard.
A distribution company has over 500,000 items active at any given time. With this volume of items and a relatively small staff, it can be difficult to make sure that all items are ready to sell, and to know what items are no longer selling. This report is for them.
This company works with items that have a low profit margin and high dollar cost. Having extra items in inventory directly takes cash out of their pockets, so we worked together to find how to make sure we can clean up inventory quantities while discovering what might need to be put on sale.
We will be using Power View within Excel 2013 for this report, since we want to access two separate SQL views. However, you can use a simple Excel PivotTable and turn this into two separate reports.
There are two parts to these steps. The first part is technical, containing steps that involve work in SQL Server. The second part is the actual building of the report. You may choose to obtain assistance with the technical part, especially if you do not have access to SQL Server.
Create the following two views in SQL Server:
- The first view is the one that displays items that are not available to sell:
CREATE VIEW VIEW_BI_Inventory_Not_Available AS
SELECT RTRIM(dbo.IV00101.ITEMNMBR) AS Item_ID,
 RTRIM(dbo.IV00101.ITEMDESC) AS Item_Desc,
 dbo.IV00101.ITMCLSCD AS Item_Class,
 dbo.IV00102.LOCNCODE AS Site_ID,
 dbo.IV00102.QTYONHND AS Qty_On_Hand,
 dbo.IV00102.QTYINUSE AS Qty_In_Use,
 dbo.IV00102.QTYINSVC AS Qty_In_Service,
 dbo.IV00102.QTYRTRND AS Qty_In_Returned_Status,
 dbo.IV00102.QTYDMGED AS Qty_Damaged,
 dbo.IV00102.QTYONHND + dbo.IV00102.QTYINUSE + dbo.IV00102.QTYINSVC + dbo.IV00102.QTYRTRND + dbo.IV00102.QTYDMGED AS Total_Inventory,
 dbo.IV00102.ATYALLOC AS Qty_Allocated,
 dbo.IV00102.QTYONHND - dbo.IV00102.ATYALLOC AS Qty_Available,
 dbo.IV00102.QTYINUSE + dbo.IV00102.QTYINSVC + dbo.IV00102.QTYRTRND + dbo.IV00102.QTYDMGED AS Total_Not_Available
FROM dbo.IV00101
INNER JOIN dbo.IV00102 ON dbo.IV00101.ITEMNMBR = dbo.IV00102.ITEMNMBR
WHERE (dbo.IV00102.RCRDTYPE > 1)
GO
GRANT SELECT ON VIEW_BI_Inventory_Not_Available TO DYNGRP
- The second view is the one that displays items that have quantities, but have not been sold in the last rolling year:
CREATE VIEW VIEW_BI_IV_LastSoldDate AS
SELECT RTRIM(dbo.IV00101.ITEMNMBR) AS Item_ID,
 RTRIM(dbo.IV00101.ITEMDESC) AS Item_Desc,
 dbo.IV00101.ITMCLSCD AS Item_Class,
 dbo.IV30300.TRXLOCTN AS Site_ID,
 MAX(dbo.IV30300.DOCDATE) AS Last_Date_Sold,
 DATEDIFF(DAY, MAX(dbo.IV30300.DOCDATE), GETDATE()) AS Days_Since_Sold
FROM dbo.IV00101
INNER JOIN dbo.IV30300 ON dbo.IV00101.ITEMNMBR = dbo.IV30300.ITEMNMBR
INNER JOIN dbo.IV00102 ON dbo.IV30300.ITEMNMBR = dbo.IV00102.ITEMNMBR
AND dbo.IV30300.TRXLOCTN = dbo.IV00102.LOCNCODE
GROUP BY RTRIM(dbo.IV00101.ITEMNMBR),
 RTRIM(dbo.IV00101.ITEMDESC),
 dbo.IV00101.ITMCLSCD,
 dbo.IV30300.TRXLOCTN,
 dbo.IV30300.DOCTYPE,
 dbo.IV00102.QTYONHND
HAVING (dbo.IV30300.DOCTYPE = 6)
AND (dbo.IV00102.QTYONHND <> 0)
GO
GRANT SELECT ON VIEW_BI_IV_LastSoldDate TO DYNGRP
Let's build a Power View dashboard:
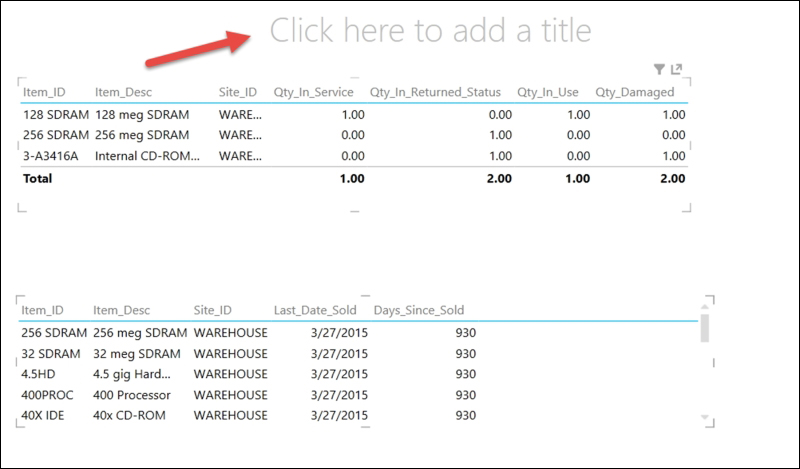
Know what you want. We've already completed this step and have included a screenshot here:

Let's make a connection to the GP data:
- Open a blank workbook in Excel; from the menu bar, choose DATA. In the Get External Data portion of the ribbon, choose From Other Sources. Then, choose From SQL Server as the source.
- Enter your Server name and network or AD login credentials. Then click on Next.
- Select your database from the drop-down list.
- Before selecting your database, mark the Enable selection of multiple tables option:

- You'll then notice that a check box will appear next to each view and table, enabling you to select the ones you want. Mark the two views we just created, VIEW_BI_Inventory_Not_Available and VIEW_BI_IV_LastSoldDate.
- BEFORE you click on Finish, unmark the option at the bottom Import relationships between selected tables:

- Click on Finish.
- When the Import Data window appears, mark Only Create Connection and make sure the Add this data to the Data Model check box is marked (do not worry, it will be dimmed out, but it should be marked). Then, click on OK:

- On the INSERT tab, click on Power View in the Reports section of the ribbon:

- The Power View canvas will appear. The Power View Fields list will appear on the right-hand side and display both views.
- Click on the expansion icon to open the VIEW_BI_Inventory_Not_Available view. This will make all the fields for this view available. Drag the Item_ID field to the canvas. As a result, a visualization will be created on the canvas and the item numbers will appear:

- With the handles still around the visualization with the item numbers, click on the Item_Desc, Site_ID, Qty_In_Service, Qty_In_Returned_Status, Qty_in_Use, and Qty_Damaged fields, respectively. These fields will be added to the visualization, which is in a table format, automatically:

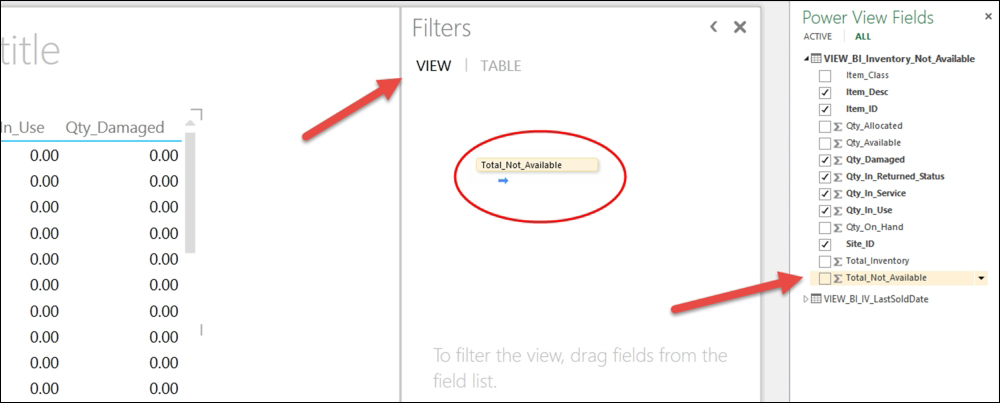
- In the Filters area to the right-hand side of the canvas, make sure the option for VIEW is selected. Then, drag the Total_Not_Available field to the Filters area. This will allow us to eliminate any item that does not have a quantity for any status that is not available for sale:
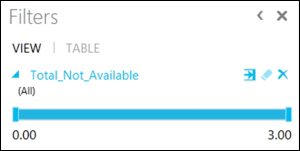
- The Filters area will appear as follows:
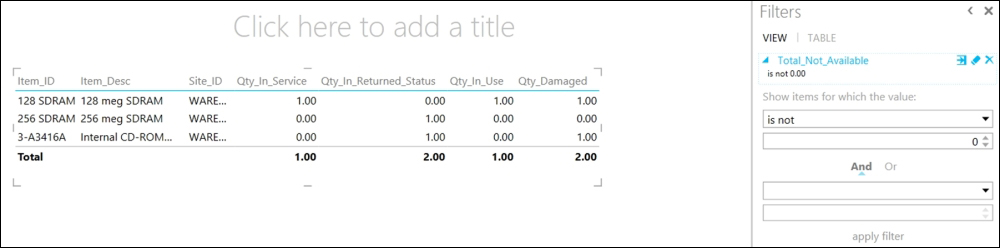
- Click on the Range Filter Mode icon to the right-hand side of the field until you get the Show items for which the value: label. Click on the first drop-down list and select is not, and set the next field to 0:

- This will perform the filter that any item where the total of all statuses with values other than 0 will appear. Finally, click on apply filter to close the window. This visualization should reduce dramatically:
- Click on the expansion icon to open the VIEW_BI_IV_LastSoldDate view. This will make all the fields for this view available. Drag the Item_ID field to the canvas, in an area that is not being populated with data from the previous visualization. As a result, a new visualization will be created on the canvas and the item numbers will appear:

- The new visualization may not appear in the location in which you want it to appear:

If this happens, you can click on the handles and resize it; essentially moving it to the location of your choice.
- Then, add the Item_Desc, Site_ID, Last_Date_Sold, and Days_Since_Sold fields respectively, to this new visualization:

- With the handles around the second visualization, in the Filters area, select TABLE and expand the Days_Since_Sold field:

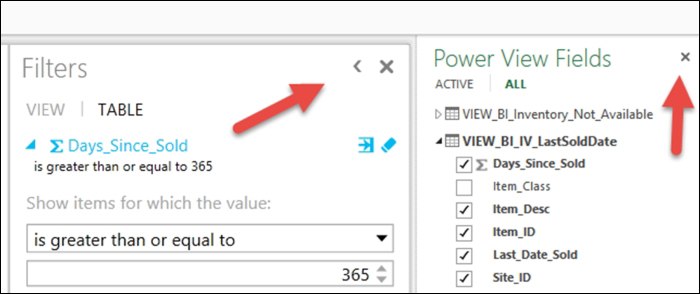
- Click on the Range Filter Mode icon to the right-hand side of the field until you get the Show items for which the value: label (as shown in the following screenshot). Click on the first drop-down list and select is greater than or equal to, and set the next field to 365. Then, click on apply filter:

Now, this second visualization displays only items with inventory on hand that have not been sold via SOP within the last 365 days.
Improve the report visually:
- Click on the Minimize the Filters Area icon to close the filters from the viewing area. The filters can be reopened when you need them. Also, close the Power View Fields list by clicking on the x symbol:
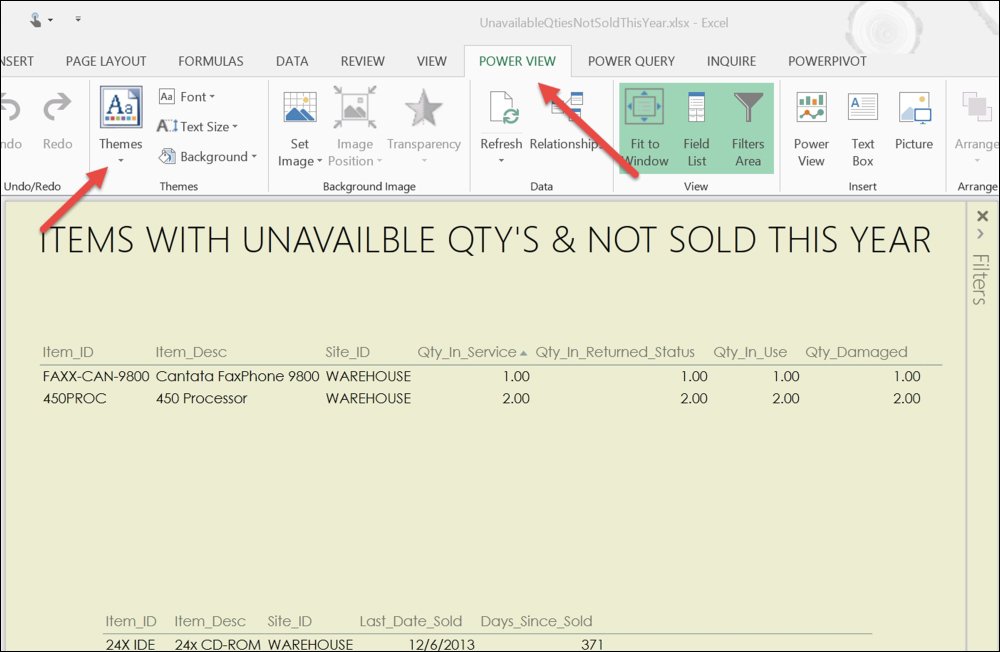
- Click on the Click here to add a title text and enter the title for your report:
- You can use themes to add color. By opening the POWER VIEW tab on the menu, select Themes in the Themes area. You can also change the background by selecting Background in the same area:
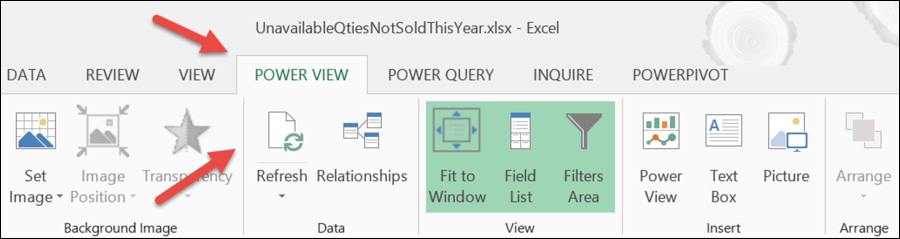
- This report can be refreshed with the latest data from GP by simply clicking on the Refresh button in the DATA area of the POWER VIEW ribbon:
This company was able to discover items that have been sitting on the shelf for a while and was able to put them on sale, relieving them from inventory before a newer version of the same product became available, making their inventory obsolete. They were also able to make sure that all inventories that could be sold had a status of available, which could prevent ordering items that were already in stock.