Your first robot will be created in simulation so that even if you do not have a robot to learn ROS on, you will be able to follow along and do the exercises in this book. We will build a simple two-wheeled robot named dd_robot (dd is short for a differential drive). We will build a
Unified Robot Description Format (URDF) file for the robot that will describe the main components of our robot and enable it to be visualized and controlled by ROS tools, such as rviz and Gazebo. Rviz is a visualization tool in which we will view our dd_robot URDF file as we build it in increments. When the visual model is complete, we will modify the URDF file for use in the Gazebo simulator. In Gazebo, we can view the effects of physics on our model as we move our model around the 3D environment.
In this chapter, we will cover the following topics:
- An introduction to rviz, installation instructions, and instructions for use
- How to create and build a ROS package
- An incremental approach to develop a URDF file and visualize it in rviz
- URDF tools to verify the URDF file
- An introduction to Gazebo, installation instructions, and instructions for use
- Modifications necessary to visualize the URDF file in Gazebo
- Tools to verify your Gazebo URDF/Simulation Description Format (SDF) file
- A simple way to control a robot in Gazebo
We begin by learning about rviz.
Rviz, abbreviation for ROS visualization, is a powerful 3D visualization tool for ROS. It allows the user to view the simulated robot model, log sensor information from the robot's sensors, and replay the logged sensor information. By visualizing what the robot is seeing, thinking, and doing, the user can debug a robot application from sensor inputs to planned (or unplanned) actions.
Rviz displays 3D sensor data from stereo cameras, lasers, Kinects, and other 3D devices in the form of point clouds or depth images. 2D sensor data from webcams, RGB cameras, and 2D laser rangefinders can be viewed in rviz as image data.
If an actual robot is communicating with a workstation that is running rviz, rviz will display the robot's current configuration on the virtual robot model. ROS topics will be displayed as live representations based on the sensor data published by any cameras, infrared sensors, and laser scanners that are part of the robot's system. This can be useful to develop and debug robot systems and controllers. Rviz provides a configurable Graphical User Interface (GUI) to allow the user to display only information that is pertinent to the present task.
In this chapter, we will use rviz to visualize our progress in creating a two-wheeled robot model. Rviz will use the URDF file that we create for our robot and display the visual representation.
We will begin by checking whether rviz has been downloaded and installed on your system.
To run rviz, you require a powerful graphics card and the appropriate drivers need to be installed on your computer.
Note
If you have trouble with running rviz, refer to http://wiki.ros.org/rviz/Troubleshooting or search the ROS forum at http://answers.ros.org/questions/.
Rviz should have been installed on your computer as part of the ros-indigo-desktop-full installation, as described in the Installing and launching ROS section in Chapter 1, Getting Started with ROS.
To test whether rviz has been installed correctly, open a terminal window and start the ROS Master by typing the following command:
$ roscore
Next, open a second terminal window and type the following command:
$ rosrun rviz rviz
This will display an environment similar to the following screenshot:
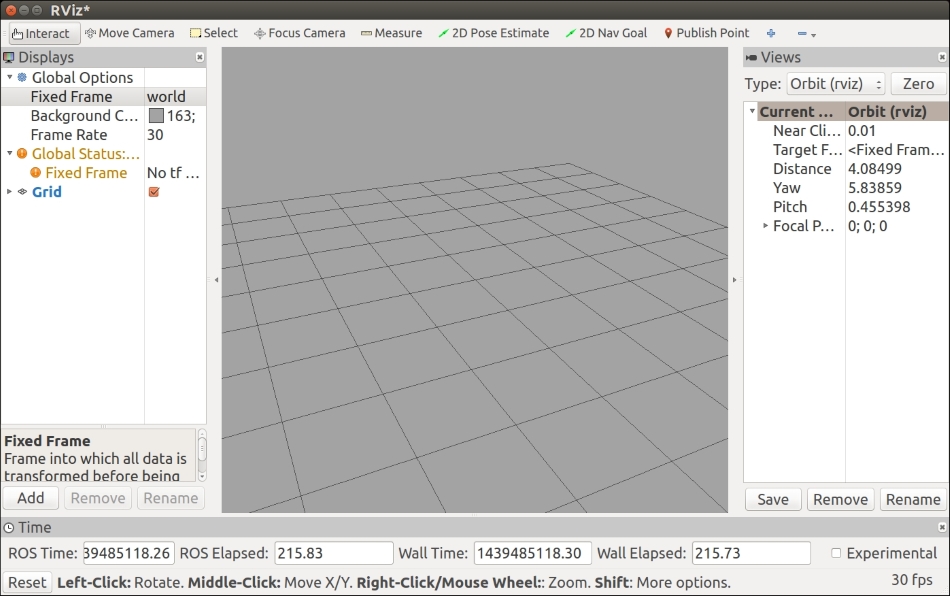
rviz main screen
If the $ rosrun rviz rviz command generates a warning message, make sure that you have source ~/catkin_ws/devel/setup.bash in your .bashrc file, or this command is entered at the terminal window prompt. The .bashrc file resides in your home directory but cannot be seen unless you use the $ ls –la command option to list the directory and files. This option shows the hidden files that are preceded by a dot (.).
If rviz has not been installed, then install it from the Debian repository using the following command:
$ sudo apt-get install ros-indigo-rviz
Note
If you wish to install rviz from a source, refer to the rviz user guide at http://wiki.ros.org/rviz/UserGuide. This guide is also a good reference to learn additional features of rviz that are not covered in this book.
The central window on the rviz main screen provides the world view of a 3D environment. Typically, only the grid is displayed in the center window or the window is blank.
The main screen is divided into four main display areas: the central window, the Displays panel to the left, the Views panel to the right, and the Time panel at the bottom. Across the top of these display areas are the toolbar and the main screen menu bar. Each of these areas of the rviz main screen is described in the following sections. This overview is provided so that you can gain familiarity with the rviz GUI.
On the left panel of the rviz main screen is the Displays panel, where the user can add, remove, or rename the visualization elements in the 3D environment.
By clicking on the Add button on the Displays panel, the Add menu appears, as shown in the following screenshot. This menu displays the visualization elements that can be added to the environment, such as a camera image, point cloud, robot state, and so on. A brief description of each item is provided at the bottom of the window when that item is highlighted. A unique display name can be entered for the item to be added to the environment. For further details on the display types, go to http://wiki.ros.org/rviz/DisplayTypes. This site also identifies the ROS messages that provides the data for the display:

Rviz 'Add' Display menu
Clicking on the triangle symbol on the left side of a panel item will expand or hide the details of the item.
The Displays panel also shows access to Global Options, such as Background Color and Frame Rate. The options under the Grid element allow the user to tailor the grid lines by changing the number of grid cells, line width, line color, and so on.
The Views panel on the right side of the rviz main screen and the Time panel at the bottom are not important at this point, and so we have removed them from the rest of the screenshots in this chapter. We will work in the orbit view, which is the default camera view for rviz. In this view, the orbital camera will rotate around a focal point visualized as a small yellow disc in the 3D world view.
To move around the 3D world in the orbit view, use the mouse and keyboard as follows:
- Left mouse button: Click and drag to rotate around the focal point.
- Middle mouse button (if available): Click and drag to move the focal point in the plane formed by the camera's up and right vectors. (The Shift key and left mouse button combination also invokes this mode.)
- Right mouse button: Click and drag to zoom in/out of the focal point. Dragging up zooms in and down zooms out. (The scroll wheel also invokes this mode.)
The toolbar at the top of the rviz main screen provides the following functionalities:
- Interact: This shows interactive markers when present.
- Move camera (default mode): This is a 3D view that responds to the mouse/keyboard, as described for the Views panel.
- Select: This allows items to be selected by a mouse click or drag box selection. The selected item will have a wireframe box placed around it.
- Focus camera: A mouse click on a specific spot in the 3D view becomes the focal point of the camera.
- 2D Nav Goal and 2D Pose Estimate: These selections will be discussed in Chapter 4, Navigating the World with TurtleBot.
The top-most main window menu bar provides options under the basic File, Panels, and Help headings, as shown here:
- File: Open Config, Save Config, Save Config As, Recent Configs, Save Image, and Quit
- Panels: Add Panel and Delete Panel
Other options for panels are: Tools, Displays, Selection, Tool Properties, Views, and Time
- Help: Show Help panel, Open rviz wiki in browser, and About
These selections allow the user to customize the panels to be displayed for rviz. This custom configuration of rviz can be saved and reused.
In this chapter, we use rviz to visualize the construction of our two-wheeled robot model in 3D. We will show you how to use rviz to visualize odometry data for navigation purposes in Chapter 3, Driving Around with TurtleBot.
For more in-depth tutorials on rviz, go to http://wiki.ros.org/rviz/Tutorials.
At this point, rviz can be exited by navigating to File | Quit. In the next section, we create and build a ROS package to hold our URDF code and launch files.