
In the previous recipes in this chapter we created our first Hello World extension, added properties and added custom components to the properties. Now, it's time to get your hands on the data inside your application.
We will go a step further in this recipe and define "Dimensions" and "Measures" in our JavaScript code block. This way we can extract the data from the tables and display it in a chart on our Qlik Sense sheet.
- Open Qlik Sense hub and create a new Qlik Sense application.
- Load the following script in order to auto-generate some example data:
Transactions:
Load *,
 mod(TransID,26)+1 AS Period,
 Pick(Ceil(3*Rand1),'Standard','Premium','Discount') AS ProductType,
 Pick(Ceil(6*Rand1),'Apple','Orange','Cherry','Plum', 'Fig','Pear') AS Category,
 Round(1000*Rand()*Rand()*Rand1) AS Sales,
 Round(Rand()*Rand1,0.00001) AS Margin;
Load
 date(41275+IterNo()-1) AS Date,
 Rand() AS Rand1,
 RecNo() AS TransID
Autogenerate 1000 While Rand()<=0.5 or IterNo()=1;
- Save the application.
- Create a new folder in the extension directory and call it
Qlik Sense Cookbook-C7-R3 - Hello Data. - Create a new
.qextfile, as we did in the first recipe of this chapter and name itQlik Sense Cookbook-C7-R3 - Hello Data.qext. In the.qextfile use the following code:{ "name" : "Hello Data", "description" : "Examples how to use data in visualization extensions.", "icon" : "extension", "type" : "visualization", "version": "0.1.0", "author": "Your Name" } - Next, create the JavaScript (
.js) file, as we did previously in the same folder location and name itQlik Sense Cookbook-C7-R3 - Hello Data.js. Enter the following code:define( [], function ( ) { 'use strict'; return { definition: { type: "items", component: "accordion", items: { dimensions: {uses: "dimensions"}, measures: {uses: "measures"}, sorting: {uses: "sorting"}, appearance: {uses: "settings"} } }, initialProperties: { qHyperCubeDef: { qDimensions: [], qMeasures: [], qInitialDataFetch: [ { qWidth: 10, qHeight: 100 } ] } }, paint: function ( $element, layout ) { var hc = layout.qHyperCube; //console.log( 'Data returned: ', hc ); // Default rendering with HTML injection $element.empty(); var table = '<table border="1">'; table += '<thead>'; table += '<tr>'; for (var i = 0; i < hc.qDimensionInfo.length; i++) { table += '<th>' + hc.qDimensionInfo[i].qFallbackTitle + '</th>';} for (var i = 0; i < hc.qMeasureInfo.length; i++) { table += '<th>' + hc.qMeasureInfo[i].qFallbackTitle + '</th>';} table += '</tr>'; table += '</thead>'; table += '<tbody>'; for (var r = 0; r < hc.qDataPages[0].qMatrix.length; r++) { table += '<tr>'; for (var c = 0; c < hc.qDataPages[0].qMatrix[r].length; c++) { table += '<td>'; table += hc.qDataPages[0].qMatrix[r][c].qText; table += '</td>'; } table += '</tr>'; } table += '</tbody>'; table += '</table>'; $element.append( table ); } }; } ); - Go to the App overview and create a new sheet in Qlik Sense.
- Go to the
 mode.
mode. - From the left-hand side Assets panel, drag across the "Hello Data" extension, which we created just now.
- Title the Object as
Margin Analysis. - Add Category as a dimension.
- Add the following measure and label it as
Margin:Sum(Margin)
- The final result will be similar to the following image:

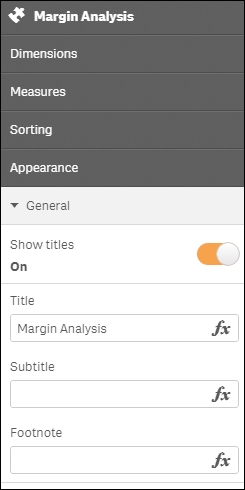
- The resultant table will look like the following image. Also observe that while in the Edit mode for the object, the property panel to the right shows properties, such as Dimensions, Measures, Sorting, and Appearance; similar to a normal Qlik Sense object.
In the previous recipes, we have already looked at the code to define the properties pane. This section of the code allows us to reuse the built in capability to define dimensions and measures just like the other objects in Qlik Sense:

By setting the default items in the properties window to include standard dimensions and measures options, we can now add data to the visualization. The data fields can be added directly in the object as shown in the following image:

As soon as you add dimensions and measures to a visualization extension, the Qlik Engine will return what is known as a HyperCube. Although it is a huge simplification, you can simply think of it as a table returned from the engine.
For a full breakdown of the HyperCube structure, see the QlikSense development toolkit on qlik.com. For now, we are interested in three objects of the HyperCube and they are:
layout.qHyperCube.qDimensionInfo: used dimensionslayout.qHyperCube.qMeasureInfo: used measureslayout.qHyperCube.qDataPages: the result
In the print statement, we create a basic HTML table with a header for labels and body for the data. The skeleton of a basic HTML table is shown in the following code:
var table = '<table border="1">';
  table += '<thead>';
  table += '</thead>';

  table += '<tbody>';
  table += '</tbody>';
table += '</table>';
The first two bullet points in the preceding section are used for qDimensionInfo and qMeasureInfo. The third bullet point is for qDataPages:
qDataPagesis an array- The data is held with
qDataPages[0].qDataPages.qMatrix - It is also an array of objects (the rows)
- Each holds an array of other objects (the cells)
The preceding skeleton has been completed in our example and is shown in the following image:
The following image is the result of the header:

The following image is the result of the body:
