
1.6 The Excel Add-In (Optional)
JMP was developed to help people with questions about their data get the answers that they need through the use of graphs and numerical results. For most people, memories of statistics can be a very unpleasant, if not forgotten, part of their education. If you see yourself as a new, occasional, or even reluctant user of data analysis, we want you to know that we have written this book for you.
It is important to note that throughout the historical development of statistics as a scientific discipline, people had real problems that they needed to solve and developed statistical techniques to help solve them. Statistics can be thought of as sophisticated common sense, and JMP takes a practical, commonsense approach to solving data-driven problems.
JMP was designed around the workflow of analyzing data rather than as a collection of tools only a statistician can understand. When you think about your data analysis problem, try to formulate the questions that might help you address it. For example, do you need to describe the variation in selling prices of homes in a city or understand the relationship of customer satisfaction with service waiting times? With this mindset, you will find the menus and navigation in JMP to be very compatible with the questions that you are trying to answer.
Displaying graphs (or pictures) of data is one of JMP’s strengths. For most people, an effective graph can convey more information more quickly than a table of numbers or statistics. In any JMP analysis, graphs are presented first, and then the appropriate numerical results follow. This is by design. JMP also provides a Graph menu that contains additional visualization tools that are independent of numerical results, at least initially. The goal of this chapter is to introduce you to JMP and its basic navigation. We cover the menus and windows and introduce you to the conventions used throughout the book.
All but one chapter in this book (Chapter 3, “Index of Graphs”) is laid out in a consistent manner to help you generate results quickly. The format of the book has been designed to be used alongside your computer where JMP is installed. After an introduction to the concept, we have designed each section to be self-contained. That is, with few exceptions, the steps required to produce a result begin and end without having to flip through several pages.
We provide numbered steps that generate the result illustrated in the figure that follows. (See Figure 1.1.)
Figure 1.1 Book Layout

|
Note |
|
This edition of JMP Essentials was written with JMP 15. However, the methods covered in this book are mostly basic and have not substantially changed since the earliest releases of the software. Thus, you will find most instructions contained in this book compatible with earlier and future JMP releases. |
Conventions
We are confident that, having made it this far, you know the basic terminology associated with operating a computer, including click, right-click, double-click, drag, select, copy, and paste. We use these terms and they appear in numbered steps. (See Figure 1.2.) When there is a single or self-evident step, these instructions are included in the body of the text. Each step or action appears in bold type.
Figure 1.2 Selection Path Example

In writing this book, we have adopted the same conventions contained in JMP documentation to ease your transition to using the documentation.
Menu items such as Graph are associated with a JMP command such as Graph Builder. We use a right pointed arrow symbol () to indicate the next step in an operation. Thus, Graph Graph Builder indicates that you should select the Graph Builder command (or platform) from the Graph menu. (See Figure 1.3.)
Figure 1.3 Menu Conventions

Book Features
Most chapters feature one or more examples to illustrate the procedures within that chapter. (See Figure 1.4.) All of the examples have corresponding data tables that are included in JMP’s built-in Sample Data directory (Help Sample Data Library).
Figure 1.4 Data Table Description

Important definitions are in bold for easy reference. (See Figure 1.5.)
Figure 1.5 Definitions

We include notes, tips, and cautions where appropriate to point out relevant or important information. (See Figure 1.6.)
Figure 1.6 Note and Tip Box

The appendices offer reference material including Appendix A, an introduction to using JMP and SAS together; Appendix B, a glossary of terms used in this book; and Appendix C (see Figure 1.7), a JMP 15 Quick Guide that provides essential menu steps to perform a specific analysis (if you know what you want).
Figure 1.7 JMP Quick Guide

Let’s begin by launching JMP. To launch JMP from the Microsoft Windows Start menu:
1. Select the Start menu.
2. Scroll to JMP 15.
3. Select JMP 15 JMP 15 (see Figure 1.8).
Note: Windows 10 users will begin with the Start Screen.
Figure 1.8 Opening JMP in Windows

|
Note |
|
JMP is offered in two versions: JMP and JMP Pro. JMP Pro contains more advanced predictive modeling tools that are beyond the scope of this book. Thus, you will find the steps that we cover in this book are identical in both versions. |
Macintosh users can click the JMP icon (see Figure 1.9) to launch JMP from the application dock. If the icon does not appear on the dock, select Finder Applications JMP 15.
Figure 1.9 Accessing JMP on a Mac

After JMP has launched, you might notice that two windows have also opened: Tip of the Day and JMP Home Window.
Tip of the Day
The Tip of the Day window is the first thing you see because it addresses the most common questions that new users ask such as, “How do I do X?” Well, the X in these common questions is represented and answered in more than 60 different Tip of the Day windows. You can scroll through them by clicking Next Tip at the bottom of the window (Figure 1.10). Some of the Tip boxes contain important and basic navigational hints, while others only apply to more advanced features in JMP.
Figure 1.10 Tip of the Day

Note the Enter Beginner’s Tutorial button. This tutorial walks you through a basic analysis of data, from opening data tables to creating graphs and results. JMP contains several other tutorials that are directed toward more specific types of problems and are found in the Help menu.
|
Note |
|
If you do not want to see the Tip of the Day window every time you launch JMP, you can simply uncheck the Show tips at startup box in the lower left corner of the window. |
The JMP Home Window
When you launch JMP, the Home Window appears (Figure 1.11). The Home Window organizes and helps you navigate data tables, documentation, and open files and any results that you have generated. If you tend to have several data tables and analyses running at the same time, the Home Window provides a convenient way to quickly navigate to what you want.
Figure 1.11 The JMP Home Window

By default, the Home Window is divided into two panels, which are:
a. The left panel contains recent files that you have accessed, listed from the most recently opened. If you are opening JMP for the first time, this panel should be blank.
b. The right panel titled “Window List” contains a list of open data tables files and their associated results. In JMP, you can have any number of data tables and results open, but only one active data file can be analyzed at any one time. You can double click on any item in this panel to activate it and bring it to the forefront.
While the Home Window enables you to navigate directly to a file or result, each data table and results window also provides shortcuts back to the Home Window. At the lower right of each window, select the icon that looks like a house to return to the Home Window (Figure 1.12).
Figure 1.12 Shortcut Back to the Home Window

A results window has a second icon, which is also the same icon used to denote “.jmp” formatted files called JMP Data Tables. Click on a Data Table icon and you will be taken to the corresponding data table for that results window (Figure 1.13). Note that if you are looking at a data table, you will not see this second icon because you are already in the data table window.
Figure 1.13 Shortcut Back to the Data Table

The check box with the down arrow button next to it enables you to combine multiple results windows or graphs into a single window or “dashboard.” We will discuss creating dashboards in Chapter 7.
At the top of the Home Window, you will see a series of menus (File, Edit, Tables, and so on). These are the menus that we use to illustrate the concepts in this book. They are also the same menus that we refer to as JMP’s native menus because they have been present in JMP since its first release.
These menus serve to open or import data, to edit or structure it, and to create graphs and analyses of your data. They are also a valuable source for assistance through the Help menu, which is discussed later. The menus are logically sequenced from left to right (Figure 1.14).
Figure 1.14 JMP Native Menus

● File is where you go to open or import data and to save, print, or exit JMP. It is also where you can customize the appearance or settings within JMP through Preferences (explained in Section 1.5).
● Edit will appear when needed and provides the usual cut, clear, copy, paste, and select functions, as well as undo, redo, and special JMP functions.
● Tables provides the tools to manage, summarize, and structure your data. (See Section 2.6.)
● DOE contains the Design of Experiments tools. These tools are used to design experiments that are then used to collect data to eventually analyze. In this book, we assume you already have data in some form and thus will not cover DOE. For more information, see Help JMP Documentation Library DOE Guide.
● Analyze contains the analysis tools that generate both graphs and statistics and serves as the home for all of JMP’s statistical tools from simple to advanced (Chapters 5 and 6).
● Graph contains graph tools that are independent of statistics (at least initially). Graphs in this menu include basic charts to advanced multivariable and animated visualization tools and maps (Chapters 3 and 4).
● Tools enables you to transform your cursor into a help tool, a brushing tool, a selection or scrolling tool, and much more (Section 7.2).
● View provides options to control which windows, menus and toolbars are visible including the JMP Starter (Section 8.3).
● Window helps you manage windows within JMP.
● Help provides resources for learning and using JMP. Let’s start with an introduction to the Help menu.
|
Note |
|
Additional menu items including “Add-ins” and “SAS” may appear if and when you have tools of these types installed. |
The Help Menu
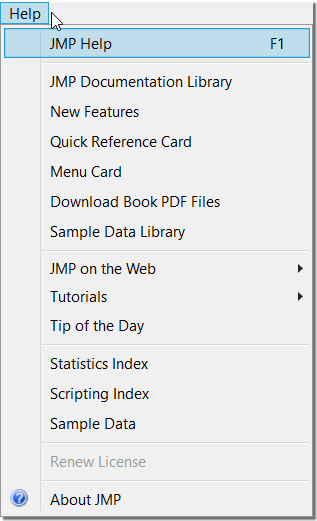
The Help menu (see Figure 1.15) provides access to learning resources that you can use as you expand your knowledge of JMP features, learn about statistics, and learn how to interpret results. These resources include searchable indexes, guided tutorials, tips of the day, and links to printable books including Using JMP. Data tables used in this book and in all JMP documentation are included in the Sample Data directory. Chapter 8 covers the features of the Help menu in greater detail.
Figure 1.15 The Help Menu
JMP also features context-specific help, meaning that when you use the JMP Help Tool in any graph or statistical result, you are directed to the right spot in the online documentation to assist you in understanding the result. For more information about the JMP Help Tool, see section 8.1. In statistical results, JMP provides Hover Help that reveals context-specific interpretation of statistical results. See Chapter 5 for more information.
Interpretation can be straightforward for descriptive graphs or basic summary statistics, but as you dig deeper into an analysis or use more advanced methods, it is vitally important that you understand the meaning of the results, particularly when they are shared or presented. The documentation under Help JMP Documentation Library includes over 6,000 pages of reference material in fourteen books that address the needs of professional statisticians and analysts. If you encounter results that you do not understand, however, we strongly recommend that you seek assistance from experienced data analysts.
The Analyze and Graph Menus
Because most graphs or statistical results begin with the Analyze and Graph menus, let’s explore the structure within these two menus a little bit more.
Click the Analyze menu at the top of the window. Glance at the choices on the menu. Top-down, the platforms are organized from the basic to more advanced tools. Next, click the Graph menu at the top of the window. Glance at the graph choices. The menus in JMP – specifically the Analyze and Graph menus (see Figures 1.16a and 1.16b) – are designed to provide both a description and visual cues for analyzing, graphing, and exploring data.
|
Figure 1.16a The Analyze Menu
|
Figure 1.16b The Graph Menu
|


Note that each entry under these menus has both a name and an icon (on the Mac, the icons will not appear). The icons next to the Graph menu options give you a preview of each graph. From the Analyze menu, the icons depict the description or relationships that you will see in graphs and statistical results (Figure 1.17).
Figure 1.17 Visual Cues Provided for Basic Analysis

|
Note |
|
The Analyze menu items produce both graphs and statistical results, while the Graph menu items produce only graphs, at least initially. |
Framework of the Analyze Menu
There is a problem-solving framework to the Analyze menu that we will discuss in detail in Chapter 5. As mentioned in the introduction, your exploratory objective will translate to these menu items. This structure streamlines the analysis process; in order to select the correct menu item, you only need to count how many columns you are interested in and know whether you are trying to describe, compare, or understand their relationship. (See Figure 1.18.)
Figure 1.18 Framework of the Analyze Menu

This framework cues you to the correct analysis choice on the menu without exposing you to many statistical terms until you need them. Make no mistake; you still get the statistics when you want them, but you do not have to know all the statistical terms or assumptions in order to access them.
|
Note |
|
JMP’s Analyze menu contains terms such as Distribution and Fit Y by X that might be unfamiliar, but the ideas behind them are very straightforward. We describe them in simple terms as needed throughout the book. Many items under the Analyze and Graph menus are referred to as platforms or commands through this book. For example, Distribution and Fit Y by X are referred to as platforms. |
Before we launch JMP for the first time, let’s look at the four common elements of a JMP analysis. All JMP analyses contain these elements, and they follow a consistent process.
1. The first is the JMP Home Window, where you begin a JMP session (Figure 1.19). This is your mission control center. As described earlier in this chapter, from here you can open or create a data table or easily navigate between data tables, results, and help.
Figure 1.19 The JMP Home Window

2. The second element is a Data Table where your data reside, which you might have imported or opened through the Home Window (Figure 1.20). The data table is also where you will usually initiate an analysis or graph described next. We will cover the Data Table in Chapter 2.
Figure 1.20 A JMP Data Table

3. Once you have a data table open in JMP, you will want to select a task through the JMP menus. These tasks (or commands as we call them in JMP) generate a Launch Window to execute your desired command (Figure 1.21). You will notice that the columns or variables from your data table are pre-populated in the launch window. Chapters 3 through 6 will explore these tasks and their results.
Figure 1.21 A JMP Launch Window

4. The result of any executed command is called the Report Window, which contains the graphs and statistics that you have asked JMP to glean from your data (Figure 1.22). We will be seeing Report Windows throughout this book as we illustrate JMP’s features, but Chapter 7 will focus on how to share these graphs and reports with others.
Figure 1.22 A Report Window

Throughout this book, each set of instructions used to create a graph or an analysis is prompted by a launch window that follows a consistent format and execution. To launch a window, however, you must first open a data table.
For purposes of illustration, we will open the Equity.jmp data table:
1. Select Help Sample Data Library Equity.jmp.
2. Select Analyze Distribution (see Figure 1.23).
Figure 1.23 Selecting the Distribution Platform

3. This generates the Distribution window with the columns (variables) from the Equity.jmp data table populated in the Select Columns list (see Figure 1.24).
Figure 1.24 The Distribution Launch Window

Most JMP launch windows consist of three main elements, organized from left to right (see Figure 1.25):
Figure 1.25 Launch Window Basics

• Available columns (or variables) of data to analyze from your data table. These appear on the left under Select Columns.
• Roles that you want to place (or cast) on the column(s). In this area, you see buttons and empty areas under Cast Selected Columns into Roles. Within these empty areas, you are given a hint in italics about which columns are required and which are optional to run the analysis.
• Action buttons to execute commands.
To use this Distribution window or almost any other in JMP, click on a column and select the role (or click and drag the column into that role’s empty space). Once you are satisfied with your selections, select OK.
Almost every analysis and graph window in JMP appears in this way. Now that you have learned this format, you are ready to handle just about any command window in JMP.
|
Note |
|
The Y, Columns role refers to what column you want to place on the vertical, or y, axis. In other windows, such as Fit Y by X, you also have an X role to select that corresponds to the horizontal, or x, axis. The Weight, Freq, and By roles are more specialized, but can streamline your analyses often without the requirement of reshaping your data (For more information, see Help JMP Documentation Library Using JMP Get Started Launch Windows). |
1.6 The Excel Add-In (Optional)
We find that many new users of JMP are often Microsoft Excel users too. JMP can easily import Excel data, which we will describe in greater detail in Chapter 2, but one feature that Excel power users might appreciate is the JMP add-in for Excel. The Excel add-in is a convenient Windows-only way to launch JMP platforms from within the Excel environment. If Excel is installed on your Windows computer and you then install JMP, the add-in should appear as a new tab along the top of your Excel window. (See Figure 1.26.) If it does not, go to “Add-ins” within Excel and select the check box next to the JMP add-in item.
Figure 1.26 The JMP Add-In Tab in Excel

Selecting the JMP tab will reveal a JMP ribbon providing a good selection (but not all) of the commonly used JMP platforms (see Figure 1.27).
Figure 1.27 The JMP Ribbon in Excel

Because the JMP environment offers dynamic and visual exploration of your data, each JMP platform option will launch JMP, convert your Excel worksheet into a JMP data table, and set up the corresponding launch window within the JMP environment. Let’s briefly summarize their functions.
1. Preferences helps bring your data to JMP in the right format. Here, you can specify the number of header rows in your Excel worksheet and whether to bring over hidden rows or columns.
2. Data Table automatically converts your Excel worksheet into a JMP Data Table. Note that it will use the preferences that you have set. If your data does not transfer correctly, change your preferences accordingly or use the Excel Import Wizard discussed in Chapter 2.
3. Graph Builder is an easy-to-use data visualization platform. Selecting this option will convert your worksheet into a JMP data table, launch the Graph Builder platform, and populate the dialog box with your variables or columns so that you are ready to visualize your data.
4. Distribution, Fit Y by X, Fit Model, Time Series, and Control Chart will convert your worksheet into a JMP data table and launch the corresponding platform with your variables ready to be assigned into roles.
5. Create/Edit Model and Run Model enable you to visualize your spreadsheet models using JMP’s profiler. If you are interested in performing “what-if” analysis on your spreadsheet models, the profiler enables you to do so visually. This is a great tool for presenting models because you can interact with the model and immediately visualize the effect of change. It also contains Monte Carlo simulation to explore how uncertainty will affect your model and fine-tune it to achieve desired results. (See Figure 1.28.)
Figure 1.28 The Excel Profiler

JMP’s Preferences determine the way JMP appears or behaves on your machine. JMP has been carefully crafted to support the workflow of the data analyst. Its defaults have been selected to reflect common use, which we use in this book. However, JMP also provides options to customize the software to corporate standards or individual tastes. In this section, we will explore how one can customize the look, feel, and options that appear in JMP. Preferences (File Preferences on Windows; JMP Preferences on Mac) are the primary means of setting or changing the defaults in JMP that you will see each time you operate the software – think global settings here. Virtually any function in JMP can be set as a default, including specific tests within any platform, the look of graphs, color schemes, font sizes and styles, and how JMP works with other products such as SAS.
To view the preferences, choose File Preferences or JMP Preferences on a Mac. (See Figure 1.29.)
Figure 1.29 Accessing Preferences from the File Menu

This opens the Preferences window (see Figure 1.30), containing 22 main categories on the left and options within those categories on the right. You can change preferences by checking or unchecking the boxes within the categories on the right or by selecting items from drop-down menus. Changing preferences can affect such things as the graph or result format, the font, the location of a file, and much more, each and every time you use those features in JMP. If you are unsure about making a change to the preferences, we recommend that you wait until you have a need to do so.
Figure 1.30 The Preferences Dialog Window

|
Note |
|
If you need to make a change within a single graph or result, note that JMP also provides many of these formatting options within the graphs themselves. |
Let’s see how this works. New users on Windows often prefer to turn off the menu auto-hide option (which by design, provides a little more window real estate for graphics and statistics power users), making it a little easier to find the menu options described in this book.
Below we have an illustration of the menu hidden and unhidden (Figure 1.31). Notice the File, Edit, and other menus appear when they are not hidden. When the menus are hidden, you see an ellipsis where the menus would be. Holding your cursor over the ellipsis displays the menus.
Figure 1.31 Illustration of Menu Hidden and Unhidden


To change this auto-hide default to always show the menus, select File Preferences Windows Specific Autohide menus and toolbar Never (Figure 1.32).
Figure 1.32 Removing Menu Auto-Hide

If you want to change the default marker size, style, or color themes used in graphs, select File Preferences Graphs. Included is a handy preview to see how your selections will appear (Figure 1.33).
Figure 1.33 Graph Preferences

JMP was developed to help business professionals, scientists, or engineers get answers to the questions and problems that they encounter. The navigation and menus within JMP provide a natural extension of your problem-solving and a direct means to explore your data and generate the results that you need. This book uncovers the structure of JMP’s menus and provides easy steps for producing results. The standardized format of the windows in JMP prompts you through most analysis and graphing. Results can be customized using global detailed preferences.