Chapter 8. Model Inference
Note
We would like to acknowledge Clive Cox and Alejandro Saucedo from Seldon for their great contributions to this chapter.
Most of the attention paid to machine learning (ML) has been devoted to algorithm development. However, models are not created for the sake of their creation, they are created to be put in production. Usually when people talk about taking a model “to production,” they mean performing inference. As introduced in Chapter 1 and illustrated in Figure 1-1, a complete inference solution seeks to provide serving, monitoring, and updating functionality.
- Model serving
-
Puts a trained model behind a service that can handle prediction requests
- Model monitoring
-
Monitors the model server for performance—as well as the underlying model’s accuracy—for any irregularities.
- Model updating
-
Fully manages the versioning of your models and simplifies the promotion and rollback between versions.
This chapter will explore each of these core components and define expectations for their functionality. Given concrete expectations, we will establish a list of requirements that your ideal inference solution will satisfy. Lastly, we will discuss Kubeflow-supported inference offerings and how you can use them to satisfy your inference requirements.
Model Serving
The first step of model inference is model serving, which is hosting your model behind a service that you can interface with. Two fundamental approaches to model serving are embedded, where the models are deployed directly into the application, and model-serving-as-a-service, where a separate service dedicated to model serving can be used from any application in the enterprise. Table 8-1 below provides a comparison of these approaches:
| Serving types | Advantages | Disadvantages |
|---|---|---|
Embedded |
|
|
Model serving as a service |
|
|
Kubeflow only supports a model-serving-as-a-service approach. As a result, we will not be discussing model embedding in this book.1
There are two main approaches for implementing model-serving-as-a-service: model as code, and model as data. Model as code uses model code directly in a service’s implementation. Model as data uses a generic implementation driven by a model in an intermediate model format like PMML, PFA, ONNX, or TensorFlow’s native format. Both approaches are used in different model servers implementations in Kubeflow. When determining which implementation to use, we recommended using model as data, as it allows for the exchange of models between serving instances to be standardized, thus providing portability across systems and the enablement of generic model serving solutions.
Most common serving implementations like TFServing, ONNX Runtime, Triton, and TorchServe use a model as data approach and leverage some intermediate model format. Some of these implementations support only one framework, while others support multiple. Unfortunately each of these solutions uses different model formats and exposes unique proprietary serving APIs. None of these interfaces meet everyone’s needs. The complexity and divergence of these API interfaces result in a differing user experience (UX) and an inability to share features effectively. Furthermore, there is increased friction in swapping between model frameworks, as the interfaces behind these implementations are different.
There are a few strong industry players attempting to unify the open source community of model servers and to decrease the friction between toggling model frameworks. Seldon is pioneering Graph Inferencing with Seldon Core; Bloomberg and IBM are investigating Serverless Model Serving using solutions like Knative; and Google is further hardening its serving implementation for TensorFlow models.
In “Model Inference in Kubeflow”, we will discuss the serving solutions that Kubeflow offers and the work that has been done to unify these solutions into a single interface.
Model Serving Requirements
Model serving requires you to understand and manage the developmental operations (DevOps) and handle the analysis, experimentation, and governance of your models. This scope is wide, complicated, and universal among data scientists. We will now start scoping out the expectations you might want from a serving solution.
First, you want framework flexibility. Solutions like Kubeflow allow for your training to be implementation agnostic (i.e., TensorFlow versus Pytorch). If you write an image classification inference service, it should not matter if the underlying model was trained using PyTorch, scikit-learn, or TensorFlow—the service interface should be shared so that the user’s API remains consistent.
Second, you want the ability to leverage hardware optimizers that match the needs of the algorithm. Sometimes fully fitted and tuned neural nets are quite deep, which means that even in the evaluation phase, you would benefit from hardware optimizers like GPUs or TPUs to infer the models.
Third, your model server should seamlessly interact with other components in an inference graph. An inference graph could comprise feature transformers, predictors, explainers, and drift-detectors—all which we will cover later.
Fourth, you should also have options to scale your serving instance, both explicitly and using autoscalers, regardless of the underlying hardware, i.e. cost per inference, latency. This is particularly important and difficult because GPU autoscaling relies on a combination of factors including: GPU/CPU utilization metrics, duty cycles, etc., and knowing which metric to use for auto-scaling is not obvious. And the scaling of each of the components in your inference graph should be done separately due to differing algorithmic needs.
Fifth, you want a serving instance that exposes REpresentational State Transfer (REST) requests or general-purpose Remote Procedure Calls (gRPC). If you have streaming inputs, you may want to support a streaming interface like Kafka.
Model Monitoring
Once you have a model served, you must monitor the model server in production. When we are talking about monitoring of the model server, we are talking not only about model serving insights but also about general monitoring used for any Kubernetes-based applications, including memory, CPU, networking, etc. We will explore model monitoring and model insight in more detail.
In generating model serving insights, the most common ML attributes to monitor are model accuracy, model drift, and explainability. Model accuracy refers to the validation accuracy of your training data. But as live data distributions begin to deviate from those of the original training data, this tends to result in something called model drift. In other words, model drift occurs when the feature distribution of the data sent to the model begins to significantly differ from the data used to train the model, causing the model to perform suboptimally. ML insight systems implement effective techniques for analyzing and detecting changes—concept drift—that might happen to your input data, and the detection of these drifts is critical for models running in production systems.
Another form of model insight that is increasingly gaining attention today is model explainability, or the ability to explain why a certain result was produced. More precisely, it answers:
-
What features in the data did the model think are most important?
-
For any single prediction from a model, how did each feature in the data affect that particular prediction?
-
What interactions between features have the biggest effects on a model’s predictions?
Beyond model insight, application monitoring traditionally relates to network observability, or telemetry, the enablement of log aggregation and service-mesh-related metrics collection. These tools are useful in capturing data from a live serving instance. This infrastructure exposes enough queryable information for troubleshooting and alerting, should things go awry regarding reachability, utilization, or latency.
Model Monitoring Requirements
Monitoring model accuracy and model drift is hard. Luckily this is a very active research space with a variety of open source solutions,2. Your inference solution should enable you to plug-in solutions that provide your desired functionality out of the box. Now, we will see what you may wish to have from your model monitoring component.
First, you want your inference service to provide ML insight out of the box and run in a microservice-based architecture in order to simplify the experimentation of drift detection and model explanation solutions.
Second, you want to enable the monitoring, logging, and tracing of your service. It should also support solutions like Prometheus, Kibana, and Zipkin, respectively, but should also be able to support their alternatives seamlessly.
Model Updating
If you wish to update your model and roll out a newer version or roll-back to a previous version, you will want to deploy and run this updated version. However, the relationship between your current deployment and the new deployment can be defined in a variety of ways. When your inference system introduces multiple versions of your model serving instance, you can use either shadow or competing models.
- Shadow models
-
These are useful when considering the replacement of a model in production. You can deploy the new model side-by-side with the current one and send the same production traffic to gather data on how the shadow model performs before promoting it.
- Competing models
-
These are a slightly more complex scenario where you are trying multiple versions of a model in production to find out which one is better through tools like A/B testing.
Let’s discuss the three main deployment strategies:
- Blue/green deployments
-
These reduce downtime and risk relating to version rollouts by having only one live environment, which serves all production traffic.
- Canary deployments
-
These enable rollout releases by allowing you to do percentage-based traffic between versions.
- Pinned deployments*
-
These allow you to only expose experimental traffic to a newer version, while keeping production traffic against the current version.
The added complexity of canary and pinned over blue/green comes from the infrastructure and routing rules required to ensure that traffic is being redirected to the right models. With this enablement, you can then gather data to make statistically significant decisions about when to start moving traffic. One statistical approach for traffic-movement is A/B testing. Another popular approach for evaluating multiple competing models is using “Multi-Armed Bandits” which requires you to define a score or reward for each model and to promote models relative to their respective score.
Model Updating Requirements
Upgrading your model must be simple, so the deployment strategy that you use for upgrading should be easy to configure and simple to change (i.e., from pinned to canary). Your inference solution should also offer more complex graph inferencing in its design. We will elaborate on what you need from your inference solution:
-
The toggle of deployment strategies—i.e., from pinned to canary—should be trivial. You can enable traffic-level routing in an abstracted way by abstracting the Service Plane, which will be defined in “Serverless and the Service Plane”.
-
Version changes should be tested and validated before promotion, and the corresponding upgrade should be logged.
-
The underlying stack should enable you to configure more complex deployment strategies common to graph inferencing literature.
Summary of Inference Requirements
With the requirements of model serving, monitoring, and updating all satisfied, you now have an inference solution that completes your Model Development Life Cycle (MDLC) story. This enables you to bring a model all the way from lab to production, and even handle the updating of this model should you want to tune or modify its construction. Now we will discuss the inference solutions that Kubeflow offers.
Tip
Some ML practitioners believe that continuous learning (CL) is fundamental in their production ML systems. Continuous learning is the ability of a model to learn continually from streaming data. In essence, the model will autonomously learn and adapt in production as new data comes in. Some even call this AutoML. With a complete MDLC solution that enables pipelines and canary deployments, you can design such a system using the tools available in Kubeflow.
Model Inference in Kubeflow
Model serving, monitoring, and updating within inference can be quite tricky because you need a solution that manages all of these expectations in a way that provides abstraction for first-time users and customizability for “power-users.”
Kubeflow provides a lot of options for model inference solutions. In this section, we will describe some of them, including TensorFlow Serving, Seldon Core, and end with KFServing. Table 8-2 presents a quick comparison of these solutions.
| Solution | Approach |
|---|---|
TensorFlow Serving |
|
Seldon Core |
|
KFServing |
|
TensorFlow Serving
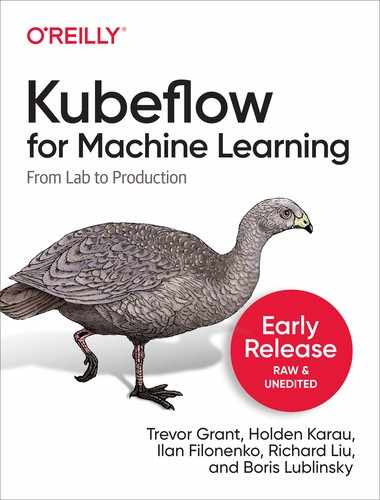
One of the most popular serving implementations is TensorFlow Serving, a model serving implementation based on the TensorFlow export format. TensorFlow Serving (TFServing) implements a flexible, high-performance serving system for ML models, designed for production environments. The TFServing architecture is shown in Figure 8-1.
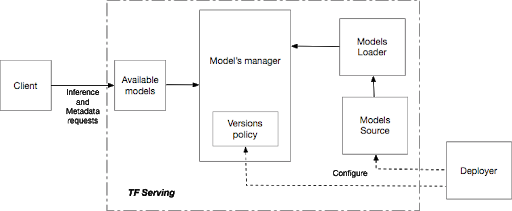
Figure 8-1. TFServing architecture
TFServing uses exported TensorFlow models as inputs and supports running predictions on them using HTTP or gRPC. TFServing can be configured to use either:
-
A single (latest) version of the model
-
Multiple, specific versions of the model
TensorFlow can be used both locally 3 and in Kubernetes4. A typical TFServing implementation within Kubeflow includes the following components:
-
A Kubernetes deployment running the required amount of replicas
-
A Kubernetes service providing access to the deployment
-
An Istio Virtual Service that exposes the service through the Istio Ingress Gateway
-
An Istio DestinationRule that defines policies for traffic routed to the service. These rules can specify configurations for load balancing, connection pool size, and outlier detection settings so that you can detect and evict unhealthy hosts from the load balancing pool
We will walk through an example of how these components are implemented by extending your Recommender example. To simplify your initial inference service, your example TFServing instance will be scoped to a deployment and a service that enables HTTP access. The helm chart for this example can be found in the Github repo for this book.
The chart defines both a Kubernetes deployment and service.
The deployment uses the “standard” TFServing Docker image and, in its configuration spec, points to a serialized model at an S3 source location.
This particular S3 bucket is managed by a local Minio instance.
The service exposes this deployment inside the Kubernetes cluster.
The chart can be deployed using the following command (assuming you are running Helm 3):
helm install <chart_location>
Now that you have the chart deployed, you need a way to interface with your inference solution. One method is to port forward your service, so that the traffic can be redirected to your localhost for testing. An example is doing the following:
kubectl port-forward service/recommendermodelserver 8501:8501
The resulting traffic will be re-routed to localhost:8051.
You are now ready to interact with your TFServing inference solution. To start, you should validate the deployment by requesting model deployment information from your service:
curl http://localhost:8501/v1/models/recommender/versions/1
This should return:
{"model_version_status":[{"version":"1","state":"AVAILABLE","status":{"error_code":"OK","error_message":""}}]}
You can also get the model’s metadata, including model’s signature definition, by issuing the following curl command:
curl http://localhost:8501/v1/models/recommender/versions/1/metadata
Now that your model is available and has the correct signature definition, you can predict against the service with the following command:
curl -X POST http://localhost:8501/v1/models/recommender/versions/1:predict-d'{"signature_name":"serving_default","inputs":{"products": [[1],[2]],"users" : [[25], [3]]}}'
That should return:
{"outputs":{"model-version":["1"],"recommendations":[[0.140973762],[0.0441606939]]}}
Your TensorFlow model is now behind a live inference solution. TFServing makes it easy to deploy new TensorFlow algorithms and experiments, while keeping the same server architecture and APIs. But the journey does not end there. For one, these deployment instructions create a service but do not enable access from outside of the cluster.5 But we will now take a further look into all the capabilities of this particular solution against your inference requirements.
Review
If you are looking to deploy your TensorFlow model with the lowest infrastructure requirement, TFServing is your solution. However, this has limitations when you consider your inference requirements.
Model Serving
Because TFServing only has production-level support for TensorFlow, it does not have the desired flexibility which you would expect from a framework-agnostic inference service. It does, however, support REST; gRPC; GPU acceleration; mini-batching; and “lite” versions for serving on edge devices. Regardless of the underlying hardware, this support does not extend to streaming inputs nor built-in auto scaling 6. Furthermore, the ability to extend the inference graph—beyond a Fairness Indicator—to include more advanced ML insights isn’t supported in a first-class way. Despite providing basic serving and model analysis features for TensorFlow models, this inference solution does not satisfy your more advanced serving requirements.
Model Monitoring
TFServing supports traditional monitoring via its integration with Prometheus. This exposes both system information—such as CPU, memory, and networking—and TFServing specific metrics; unfortunately, there is very little documentation (see the best source found here). Also, there is no first-class integration with data visualization tools like Kibana or distributed tracing libraries like Jaeger. As such, TFServing does not provide the managed network observability capabilities you desire.
When it comes to advanced model serving insights, including model drift and explainability, some of them are available in TensorFlow 2.0. Furthermore, the vendor lock-in to a proprietary serving solution complicates the plugability of model insight components. Since the deployment strategy of TFServing uses Kubeflow’s infrastructure stack, it leverages a microservice approach. This allows TFServing deployments to be easily coupled with auxiliary ML components.
Model Updating
TFServing is quite advanced in that it enables canary, pinned, and even rollback deployment strategies 7. However, the strategies are limited to the manual labeling of existing model versions and do not include support for the introduction of in-flight model versions. So version promotion does not have a safe-rollout guarantee. Lastly, the strategies are embedded in the server and aren’t extensible for other deployment strategies that might exist outside of TFServing.
Summary
TFServing provides extremely performant and sophisticated out-of-the-box integration for TensorFlow models, but it falls short on enabling more advanced features like framework extensibility, advanced telemetry, and plugable deployment strategies. Seeing these requirements unsatisfied, we will now look at how Seldon Core attempts to fill these gaps.
Seldon Core
Instead of just serving up single models behind an endpoint, Seldon Core enables data scientists to compose complex runtime inference graphs—by converting their machine learning code or artifacts into microservices. An inference graph, as visualized in Figure 8-2, can comprise:
- Models
-
Runtime inference executable for one or more ML models
- Routers
-
Route requests to sub-graphs, i.e., enabling A/B tests or Multi-Armed Bandit
- Combiners
-
Combine the responses from sub-graphs, i.e., Model ensemble
- Transformers
-
Transform requests or responses, i.e., transform feature requests

Figure 8-2. Seldon Inference Graph example
To understand how Seldon achieves this, we will explore its core components and feature set:
- Prepackaged Model Servers
-
Optimized Docker containers for popular libraries such as TensorFlow, XGBoost, H2O, etc., which can load and serve model artifacts/binaries
- Language Wrappers
-
Tools to enable more custom machine learning models to be wrapped using a set of CLIs which allow data scientists to convert a Python File or a Java Jar into a fully fledged microservice.
- Standardised API
-
Out-of-the-box APIs that can be REST or gRPC.
- Out of the box observability
-
Monitoring metrics and auditable request logs.
- Advanced Machine Learning Insights
-
Complex ML concepts such as Explainers, Outlier Detectors and Adversarial Attack Detectors abstracted into infrastructural components that can be extended when desired
Using all of these components, we walk through how to design an inference graph using Seldon.
Designing a Seldon Inference Graph
First, you will need to decide what components you want your inference graph to consist of. Will it be just a model server, or will you add a set of transformers, explainers, or outlier detectors to the model server? Luckily, it’s really easy to add or remove components as you see fit, so we will start with just a simple model server.
Second, you need to containerize your processing steps. You can build each step of your inference graph with model-as-data or model-as-code. For model-as-data, you could use a prepackaged model server to load your model artifacts/binaries and avoid building a docker container every time your model changes. For model-as-code, you would build your own pre-packaged model server based on a custom implementation. Your implementation is enabled via a language wrapper that would containerize your code by exposing a high level interface to your model’s logic. This can be used for more complex cases, even use cases that may require custom operating-system-specific, or even external-system dependencies.
Next, you need to test your implementation. You can run your implementation locally, leveraging Seldon tools to verify that your implementation works correctly. Local development is enabled by the underlying portability of Kubernetes and Seldon’s compatibility with Kubeflow’s infrastructure stack.
Then, you can enable Seldon Core extensions. Some extensions include: Jaeger tracing integration, ELK Request Logging integration, Seldon Core Analytics integration, or Istio/Ambassador Ingress integration to name a few.8.
After which, you can promote your local graph deployment to be hosted against a live Kubernetes cluster.
Lastly, you can hook up your inference graph into a Continuous Integration/Delivery (CI/CD) pipeline. Seldon components allow you to integrate seamlessly into CI/CD workflows, which enables you to use your preferred CI to connect your model sources into Seldon Core.
Now that you have scoped out a rather robust inference graph, we will walk through some examples after getting setup with Seldon on your Kubeflow cluster.
Setting Up Seldon Core
Seldon Core 1.0 comes prepackaged with Kubeflow so it should already be available to you. The Seldon Core installation will create a Kubernetes Operator which will watch for SeldonDeployment resources that describe your inference graph. However, you can install a custom version of Seldon Core as per the installation instructions with:
helm install seldon-core-operator--repo https://storage.googleapis.com/seldon-charts--namespace default--set istio.gateway=istio-system/seldon-gateway--set istio.enabled=true
You must ensure that the namespace where your models will be served has an Istio gateway and an InferenceServing namespace label. An example label application would be:
kubectl label namespace kubeflow serving.kubeflow.org/inferenceservice=enabled
An example Istio gateway would be:
kind:Gatewaymetadata:name:seldon-gatewaynamespace:istio-systemspec:selector:istio:ingressgatewayservers:-hosts:-'*'port:name:httpnumber:80protocol:HTTP
Save the above in a file and apply it using kubectl.
Creating a SeldonDeployment
After packaging your model you need to define an inference graph that connects a set of model components into a single inference system. Each of the model components can be one of the two options outlined in “Packaging your model”.
Some example graphs are shown in Figure 8-3.
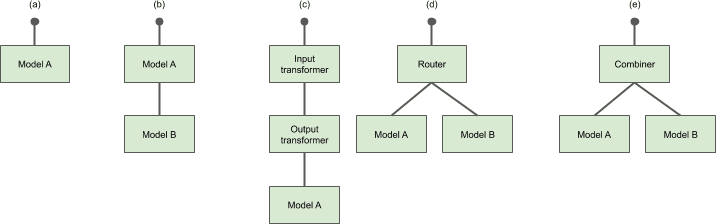
Figure 8-3. Seldon graph examples
The example inference graphs (a) to (e) shown in Figure 8-3 are expanded on below:
-
(a) A single model
-
(b) Two models in sequence. The output of the first will be fed into the input of the second.
-
(c) A model with input and output transformers. The input transformer will be called, then the model and the response will be transformed by the output transformer.
-
(d) A router that will choose whether to send to model A or B.
-
(e) A combiner that takes the response from model A and B and combines into a single response.11
In addition, SeldonDeployment can specify methods for each component. When your SeldonDeployment is deployed, Seldon Core adds a service orchestrator to manage the request and response flow through your graph.
An example SeldonDeployment (for inference graph (a) in Figure 8-3 above) is shown here as an example of what a pre-packaged model server looks like.
apiVersion:machinelearning.seldon.io/v1kind:SeldonDeploymentmetadata:name:seldon-modelspec:name:test-deploymentpredictors:-componentSpecs:graph:name:classifiertype:SKLEARN_SERVERmodelUri:gs://seldon-models/sklearn/income/modelchildren:[]name:examplereplicas:1
In the example you see that the SeldonDeployment has a list of predictors, each of which describes an inference graph.
Each predictor has some core fields:
- componentSpecs
-
A list of Kubernetes PodSpecs each of which will be created into a Kubernetes Deployment
- graph
-
A representation of the inference graph containing the name of each component, its type, and the protocol it respects The name must match one container name from the componentSpecs section, unless it is a prepackaged model server (see subsequent examples)
- Name
-
The name of the predictor
- Replicas
-
The number of replicas to create for each Deployment in the predictor
- Type
-
The detail on whether it is a prepackaged model server or a custom language wrapper model
- modelUri
-
A url where the model binary or weight are stored, which would be relevant for the respective pre-packaged model server
The example for SeldonDeployment for (a) is shown again in the following, however using a custom language wrapper model this time:
apiVersion:machinelearning.seldon.io/v1kind:SeldonDeploymentmetadata:name:seldon-modelspec:name:test-deploymentpredictors:-componentSpecs:-spec:containers:-image:seldonio/mock_classifier_rest:1.3name:classifiergraph:children:[]endpoint:type:RESTname:classifiertype:MODELname:examplereplicas:1
In this example you have a small set of new sections:
- Containers
-
This is your Kubernetes container definition where you are able to provide overrides to the details of your container, together with your docker image and tag
- Endpoint
-
In this case you can specify if the endpoint of your model will be REST or GRPC
The definition of your inference graph is now complete. We will now discuss how to test your components individually or in unison on the cluster.
Testing Your Model
In order to test your components, you must interface with each using some request input.
You can send requests directly using curl, grpcurl, or a similar utility, as well as by using the Python SeldonClient SDK.
There are several options for testing your model before deploying it.
- Running your model directly with the Python Client
-
This allows for easy local testing outside of a cluster.
- Running your model as a Docker container
-
This can be used for all Language Wrappers—but not prepackaged inference servers—to test that your image has the required dependencies and behaves as you would expect.
- Running your
SeldonDeploymentin a Kubernetes Dev client such as KIND -
This can be used for any models and is a final test that your model will run as expected.
Python Client for Python Language Wrapped Models
When you create your Python model, such as a file called MyModel.py with the contents:
classMyModel:def__init__(self):passdefpredict(*args,**kwargs):return["hello, "world"]
You are able to test your model by running the microservice CLI that is provided by the Python module.
Once you install the Python seldon-core module you will be able to run the model above with the following command:
> seldon-core-microservice MyModel REST --service-type MODEL ... 2020-03-23 16:59:17,366 - werkzeug:_log:122 - INFO: * Running on http://0.0.0.0:5000/(Press CTRL+C to quit)
Now that your model microservice is running, you can send a request using curl:
> curl -X POST> -H'Content-Type: application/json'> -d'{"data": { "ndarray": [[1,2,3,4]]}}'> http://localhost:5000/api/v1.0/predictions{"data":{"names":[],"ndarray":["hello","world"]},"meta":{}}
We can see that the output of the model is returned through the API.12
Local testing with Docker
If you are building language models with other wrappers, you can run the containers you build through your local Docker client. A good tool for building Docker containers from source code is S2I. For this, you just have to run the Docker client with the following command:
docker run --rm --name mymodel -p 5000:5000 mymodel:0.1
This will run the model and export it on port 5000, so we can now send a request using CURL:
> curl -X POST> -H'Content-Type: application/json'> -d'{"data": { "ndarray": [[1,2,3,4]]}}'> http://localhost:5000/api/v1.0/predictions{"data":{"names":[],"ndarray":["hello","world"]},"meta":{}}
With this environment, you can rapidly prototype and effectively test, before serving your model in a live cluster.
Serving Requests
Seldon Core supports two ingress gateways, Istio and Ambassador. Because Kubeflow’s installation uses Istio, we will focus on how Seldon Core works with the Istio Ingress Gateway. We will assume that the Istio gateway is at <istioGateway> and with a SeldonDeployment name <deploymentName> in namespace <namespace>. This means a REST endpoint will be exposed at:
http://<istioGateway>/seldon/<namespace>/<deploymentName>/api/v1.0/predictions.
A gRPC endpoint will be exposed at <istioGateway> and you should send header metadata in your request with:
-
key seldon and value
<deploymentName>. -
key namespace and value
<namespace>.
The payload for these requests will be a SeldonMessage.13 An example SeldonMessage follows, for a simply ndarray representation:
{"data":{"ndarray":[[1.0,2.0,5.0]]}}
Payloads can also include simple tensors, TFTensors, as well as binary, string or json data. An example request containing json data is shown here:
{"jsonData":{"field1":"some text","field2":3}}
Now that your inference graph is defined, tested, and running, you will want to get predictions back from it, and you also might want to monitor it in production to ensure it is running as expected.
Monitoring Your Models
In Seldon Core’s design, deploying ML models is not treated differently from how one would deploy traditional applications. The same applies to monitoring and governance once the deployments are live. Traditional application monitoring metrics like request latency, load, and status code distribution are provided by exposing Prometheus metrics in Grafana.14
However, as data scientists we are mostly interested in how well the models are performing—the relationship between the live data coming in and the data the model was trained on and the reasons why specific predictions were made.
To address these concerns, Seldon Core provides two additional open source projects—https://github.com/SeldonIO/alibi[Alibi:Explain] and Alibi:Detect—that focus specifically around advanced ML insights. These two projects implement the core algorithms for model explainability and outlier, data drift, and adversarial attack detection, respectively. We will now go through examples of how Seldon Core enables model explainability and drift detection, via its integration of Alibi:Explain and Alibi:Detect.
Model Explainability
Model explainability algorithms seek to answer the question: “Why did my model make this prediction on this instance?” The answer can come in many shapes, i.e., the most important features contributing to the model’s prediction or the minimum change necessary to features to induce a different prediction.
Explainability algorithms are also distinguished by how much access to the underlying model they have. On one end of the spectrum there are “black box” algorithms that only have access to the model prediction endpoint and nothing else. In contrast, you have “white box” algorithms that have full access to the internal model architecture and allow for much greater insight (such as taking gradients). In the production scenario, however, the black-box case is much more prominent, so we will focus on that here.
Before discussing an example, we will describe the integration patterns that would arise from the use of black-box explanation algorithms. These algorithms typically work by generating a lot of similar looking instances to the one being explained and then send both batch and sequential requests to the model to “map out” a picture of the model’s decision-making process in the vicinity of the original instance. Thus, an explainer component will communicate with the underlying model, as the explanation is being computed. Figure 8-4 shows how this pattern is implemented. A model configured as a SeldonDeployment sits alongside an explainer component, which comes with its own endpoint. When the explainer endpoint is called internally the explainer communicates with the model to produce an explanation.
Figure 8-4. Seldon explainer component
Warning
In Figure 8-4, the explainer communicated directly with the production model, but in a more realistic scenario the underlying model would be a separate but identical deployment (i.e., in staging) to ensure that calls to the explainer don’t degrade the performance of the production inference system.
To illustrate these techniques we will show a couple of worked examples.
Sentiment Prediction Model
One example is a sentiment prediction model that is trained on movie reviews. You can launch this with an associated Anchors explainer using the following SeldonDeployment:
apiVersion:machinelearning.seldon.io/v1kind:SeldonDeploymentmetadata:name:moviespec:name:movieannotations:seldon.io/rest-timeout:"10000"predictors:-graph:children:[]implementation:SKLEARN_SERVERmodelUri:gs://seldon-models/sklearn/moviesentimentname:classifierexplainer:type:AnchorTextname:defaultreplicas:1
Once deployed, this model can be queried via the Istio ingress as usual.
You will send the simple review “This film has great actors” to the model.
curl -d'{"data": {"ndarray":["This film has great actors"]}}'-X POST http://<istio-ingress>/seldon/seldon/movie/api/v1.0/predictions-H"Content-Type: application/json"
You will see a response like:
{"data":{"names":["t:0","t:1"],"ndarray":[[0.21266916924914636,0.7873308307508536]]},"meta":{}}
The model is a classifier and it is predicting with 78% accuracy that this is a positive review, which is correct. We can now try to explain this request:
curl -d'{"data": {"ndarray":["This movie has great actors"]}}'-X POST http://<istio-ingress>/seldon/seldon/movie/explainer/api/v1.0/explain-H"Content-Type: application/json"
You should see a response like the following (curtailed without the examples section):
{"names":["great"],"precision":1,"coverage":0.5007,..."instance":"This movie has great actors","prediction":1},"meta":{"name":"AnchorText"}}
The key element in this example is that the explainer has identified the word “great” as being the reason the model predicted positive sentiment and suggests that this would occur 100% of the time for this model if a sentence contains the word “great” (reflected by the precision value).
US Census Income Predictor Model Example
Here is a second example, trained on the 1996 US Census data, which predicts whether a person will have high or low income.15 For this example, you also need to have an Alibi explainer sample the input dataset and identify categorical features. to allow the explainer to give more intuitive results. The details for configuring an Alibi explainer can be found in the Alibi documentation along with an in-depth review of the following data science example.
The SeldonDeployment resource is as follows:
apiVersion:machinelearning.seldon.io/v1kind:SeldonDeploymentmetadata:name:incomespec:name:incomeannotations:seldon.io/rest-timeout:"100000"predictors:-graph:children:[]implementation:SKLEARN_SERVERmodelUri:gs://seldon-models/sklearn/income/modelname:classifierexplainer:type:AnchorTabularmodelUri:gs://seldon-models/sklearn/income/explainername:defaultreplicas:1
Once deployed, you can ask for a prediction:
curl -d'{"data": {"ndarray":[[39, 7, 1, 1, 1, 1, 4, 1, 2174, 0, 40, 9]]}}'-X POST http://<istio-ingress>/seldon/seldon/income/api/v1.0/predictions-H"Content-Type: application/json"
You should see a response like:
{"data":{"names":["t:0","t:1"],"ndarray":[[1.0,0.0]]},"meta":{}}
The model is predicting low income for this person. You can now get an explanation for this prediction:
curl -d'{"data": {"ndarray":[[39, 7, 1, 1, 1, 1, 4, 1, 2174, 0, 40, 9]]}}'-X POST http://<istio-ingress>/seldon/seldon/income/explainer/api/v1.0/explain-H"Content-Type: application/json"
You should see the following response, which we have shortened to not show all the examples returned:
{"names":["Marital Status = Never-Married","Occupation = Admin","Relationship = Not-in-family"],"precision":0.9766081871345029,"coverage":0.022,...}
The key takeaway is that this model will predict a low income classification 97% of the time if the input features
just were "Marital Status = Never-Married", "Occupation = Admin", and "Relationship = Not-in-family".
So these are the key features from the input that influenced the model.
Outlier and Drift Detection
ML models traditionally do not extrapolate well outside of the training data distribution and that impacts model drift. In order to trust and reliably act on model predictions, you must monitor the distribution of incoming requests via different types of detectors. Outlier detectors aim to flag individual instances that do not follow the original training distribution. An adversarial detector tries to spot and correct a carefully crafted attack with the intent to fool the model. Drift detectors check when the distribution of the incoming requests is diverging from a reference distribution, such as that of the training data. If data drift occurs, the model performance can deteriorate, and it should be retrained. The ML model predictions on instances flagged by any of the above detectors should be verified before being used in real-life applications. Detectors typically return an outlier score at the instance or even feature level. If the score is above a predefined threshold, the instance is flagged.
Outlier and Drift detection are usually done asynchronously to the actual prediction request. In SeldonCore you can activate payload logging and send the requests to an external service that will do the outlier and drift detection outside the main request/response flow. An example architecture is shown in Figure 8-5 where Seldon Core’s payload logger passes requests to components that process them asynchronously. The components that do the processing and alerting are managed via Knative Eventing, which is described in “Knative Eventing”. The use of Knative Eventing here is to provide late-binding event sources and event consumers, enabling asynchronous processing. The results can be passed onwards to alerting systems.

Figure 8-5. Data science monitoring of models with Seldon Core + Knative
Note
Here are some examples that leverage outlier and drift detection using the architecture in Figure 8-5.
-
An outlier detection example for CIFAR10.
-
A drift detection example for CIFAR 10.
Review
Seldon Core is a solid choice as an Inference Solution when building an inference graph and hoping to simultaneously achieve model serving, monitoring, and updating guarantees.
It sufficiently fills most of the gaps of TFServing while enabling data scientists to organically grow their inference graph as
their use case become more complex.
It also allows many more features outside the scope of this overview, such as Canaries, Shadows, and powerful multi-stage inference pipelines.16
However, we will take a look at how it satisfies your inference requirements.
Model Serving
Seldon Core clearly provides the functionality to extend an inference graph and support advanced ML insights in a first-class way.
The architecture is also flexible enough to leverage other advanced ML insights outside of its managed offering.
And Seldon Core is quite versatile, providing the expected serving flexibility because it is framework agnostic.
It provides support for both REST and gRPC, and GPU acceleration.
It also can interface with streaming inputs using Knative Eventing.
However, because the SeldonDeployment is running as a bare Kubernetes Deployment, it does not provide GPU autoscaling, which we
expect from hardware agnostic auto-scaling.
Model Monitoring
Seldon Core seems to satisfy all of your model monitoring needs. Seldon Core’s deployment strategy also uses Kubeflow’s infrastructure stack, so it also leverages a microservice approach. This is especially noticeable with Seldon Core’s Explainers and Detectors being represented as separate microservices, within a flexible inference graph. Secondly, Seldon Core makes monitoring first-class by enabling monitoring, logging, and tracing with its support of Prometheus and Zipkin.
Model Updating
Seldon Core is advanced, in that it supports a variety of deployment strategies, including canary, pinned, and even multi-armed-bandit. However, similar to TFServing, revision or version management isn’t managed in a first-class way. This, again, means that version promotion does not have a safe-rollout guarantee. Lastly, as you can see by the options available for graph inferencing, in Figure 8-3, Seldon Core provides complete flexibility in growing your inference graph to support more complex deployment strategies.
Summary
Seldon Core works to fill in the gaps by providing extensibility and sophisticated out-of-the-box support for complex inference graphs and model insight.
But it falls short with regards to the auto-scaling of GPUs, its scale-to-zero capabilities, and revision management for safe model updating—features that are common to serverless applications.
We will now explore how KFServing works to fill this gap, by adding some recent Kubernetes additions, provided by Knative, to enable serverless workflows for TFServing, Seldon Core, and many more serving solutions.
KFServing
As seen with TFServing and Seldon Core, the production-grade serving of ML models is not a unique problem to any one research team or company. Unfortunately this means that every in-house solution will use different model formats and expose unique proprietary serving APIs. Another problem facing both TFServing and Seldon Core is the lack of serverless primitives, like revision management and more sophisticated forms of auto-scaling. These shortcomings are also found in most inference services. In order to unify the open source community of model servers, while filling the gaps that each model server had, Seldon, Google, Bloomberg, and IBM, engaged with the open source community to collaboratively develop KFServing.
KFServing is a serverless inferencing solution that provides performant, high-abstraction interfaces for common ML frameworks like TensorFlow, XGBoost, scikit-learn, PyTorch, and ONNX. By placing Knative on top of Kubeflow’s cloud native stack, KFServing encapsulates the complexity of autoscaling, networking, health checking, and server configuration and brings cutting-edge serving features like GPU autoscaling, scale to zero, and canary rollouts to ML prediction services. This allows ML engineers to focus on critical data-science-related tooling like prediction services, transformers, explainability, and drift-detectors.
Serverless and the Service Plane
KFServing’s design primarily borrows from serverless web development. Serverless allows you to build and run applications and services without provisioning, scaling, or managing any servers. These server configurations are commonly referred to as the Service Plane, or control plane.
Naturally, serverless abstractions come with deployment simplicity and fluidity as there is limited infrastructure administration. However, serverless architecture depends heavily on event-based triggers for scaling its replicas, which we will talk about in “Escape Hatches”. It allows you to only need to focus on your application code.
One of the primary tenancies of KFServing is extending serverless application development to model serving. This is particularly advantageous for data scientists, as you want to only focus on the ML model that you are developing and the resulting input and output layers.
Data Plane
KFServing defines the Data Plane, which links up all of the standard Model Serving components together and uses Knative to provide serverless abstractions for the Service Plane. A Data Plane is the protocol for how packets and requests are forwarded from one interface to another while also providing agency over service discovery, health checking, routing, load balancing, authentication/authorization, and
KFServing’s Data Plane architecture consists of a static graph of components—similar to Seldon Core’s InferenceGraph—to coordinate requests for a single model. Advanced features like Ensembling, A/B testing, and Multi-Arm Bandits connect these services together, again taking inspiration from Seldon Core’s deployment extensibility.
In order to understand the Data Plane’s static graph, let’s review some terminology used in Figure 8-6.

Figure 8-6. KFServing Data Plane
- Endpoint
-
KFServing instances are divided into two endpoints: “default” and “canary”. The endpoints allow users to safely make changes using the
pinnedandcanaryrollout strategies. Canarying is completely optional, enabling users to simply deploy with a blue-green deployment strategy against the “default” endpoint. - Component
-
Each endpoint has multiple components:
"predictor","explainer", and"transformer". The only required component is the predictor, which is the core of the system. As KFServing evolves, it can seamlessly increase the number of supported components to enable use cases like Seldon Core’s Outlier Detection. If want, you can even introduce your own components and wire them together using the power of Knative’s abstractions. - Predictor
-
The predictor is the workhorse of the KFServing instance. It is simply a model and a model server that is made available at a network endpoint.
- Explainer
-
The explainer enables an optional alternate data plane that provides model explanations in addition to predictions. Users may define their own explanation container, which KFServing configures with relevant environment variables like a prediction endpoint. For common use cases, KFServing provides out-of-the-box explainers like Seldon Core’s
Alibi:Explain, which we learned about earlier. - Transformer
-
The transformer enables users to define a pre- and post-processing step before the prediction and explanation workflows. Like the explainer, it is configured with relevant environment variables too.
The last portion of the Data Plane is the prediction protocol
17 that KFServing uses.
KFServing worked to define a set of HTTP/REST and gRPC APIs that must be implemented by compliant inference/prediction services.
It is worth noting that KFServing standardized this prediction workflow, described in Table 8-3 across all model frameworks.
| API | Verb | Path | Payload |
|---|---|---|---|
Readiness |
GET |
|
{
  Response:{"name":<model_name>,"ready": true/false}
} |
Predict |
POST |
|
{
  Request:{"instances": []},
  Response:{"predictions": []}
} |
Explain |
POST |
|
{
  Request:{"instances": []},
  Response:{"predictions": [],"explanations": []}
} |
Example Walkthrough
With the Data Plane defined, we will now walk through an example on how you can interface with a model served by KFServing.
Setting Up KFServing
KFServing provides InferenceService, a serverless inference resource that describes your static graph, by providing a Kubernetes Custom Resource Definition (CRD) for serving ML models on arbitrary frameworks.
KFServing comes prepackaged with Kubeflow, so it should already be available.
The KFServing installation18 will create a Kubernetes Operator in the kubeflow namespace, which will watch for InferenceService resources.
Warning
Since Kubeflow’s Kubernetes minimal requirement is 1.14 which does not support object selector,
ENABLE_WEBHOOK_NAMESPACE_SELECTOR is enabled in the Kubeflow installation by default.
If you are using Kubeflow’s dashboard or profile controller to create user namespaces, labels are automatically added to enable KFServing to deploy models.
If you are creating namespaces manually, you will need to run:
kubectl label namespacemy-namespace serving.kubeflow.org/inferenceservice=enabled
to allow KFServing to deploy InferenceService in the namespace my-namespace, for example.
To check if the KFServing Controller is installed correctly, please run the following command:
kubectl get pods -n kubeflow | grep kfserving
Confirm that the controller running. There is also a detailed troubleshooting guide you can follow on this GitHub site.
Simplicity and Extensibility
KFServing was fashioned to be simple to use for day-one users and customizable for seasoned data scientists. This is enabled via the interface that KFServing designed.
Now we will take a look at three examples of InferenceService:
One for sklearn:
apiVersion:"serving.kubeflow.org/v1alpha2"kind:"InferenceService"metadata:name:"sklearn-iris"spec:default:predictor:sklearn:storageUri:"gs://kfserving-samples/models/sklearn/iris"
One for tensorflow:
apiVersion:"serving.kubeflow.org/v1alpha2"kind:"InferenceService"metadata:name:"flowers-sample"spec:default:predictor:tensorflow:storageUri:"gs://kfserving-samples/models/tensorflow/flowers"
And one for pytorch:
apiVersion:"serving.kubeflow.org/v1alpha2"kind:"InferenceService"metadata:name:"pytorch-cifar10"spec:default:predictor:pytorch:storageUri:"gs://kfserving-samples/models/pytorch/cifar10/"modelClassName:"Net"
Each of these will give you a serving instance—with a HTTP endpoint—that serves a model using a requested framework server type.
In each of these examples, a storageUri points to a serialized asset.
The interface is mostly consistent across different models.
The differences are in the framework specifications, i.e., tensorflow and pytorch.
These framework specifications are common enough in that they share information like storageUri and Kubernetes resources
requests but are also extensible in that they can enable framework specific information like PyTorch’s ModelClassName.
Clearly this interface is simple enough to get started quite easily, but how extensible is it towards more complex deployment configurations and strategies? Now we will look at an example where we can exhibit some of the features that KFServing has to offer.
apiVersion:"serving.kubeflow.org/v1alpha2"kind:"InferenceService"metadata:name:"my-model"spec:default:predictor:# 90% of traffic is sent to this modeltensorflow:storageUri:"gs://kfserving-samples/models/tensorflow/flowers"serviceAccount:defaultminReplicas:2maxReplicas:10resources:requests:cpu:1gpu:1memory:8GicanaryTrafficPercent:10canary:predictor:# 10% of traffic is sent to this modeltensorflow:storageUri:"gs://kfserving-samples/models/tensorflow/flowers-2"serviceAccount:defaultminReplicas:1maxReplicas:5resources:requests:cpu:1gpu:1memory:8Gi
The first extension is the ServiceAccount, which is used for authentication in the form of managed identities.
If you wish to authenticate to S3 because your S3 should not be public, you need an identity attached
to your InferenceService that validates you as a user.
KFServing allows you to pass an identity mounted on the container and wires up the credentials through the ServiceAccount
in a managed way. For example, say you are trying to access a model that may be stored on Minio.
You would use your Minio identity information to create a secret, beforehand, and then attach it to the service account.
If you recall, we created a secret in “Minio”, we just need to include KFServing related annotations:
apiVersion:v1data:awsAccessKeyID:xxxxawsSecretAccessKey:xxxxxxxxxkind:Secretmetadata:annotations:serving.kubeflow.org/s3-endpoint:minio-service.kubeflow.svc.cluster.local:9000serving.kubeflow.org/s3-verifyssl:"0"serving.kubeflow.org/s3-usehttps:"0"serving.kubeflow.org/s3-region:us-east-1name:minioaccessnamespace:my-namespace
And attach it to the service account:
apiVersion:v1kind:ServiceAccountmetadata:name:defaultnamespace:my-namespacesecrets:-name:default-token-rand6-name:minioaccess
The second extension to notice is the min and max replicas. You would use these to control provisioning to allow you to meet demand, by not dropping requests, while not over-allocating.
The third extension is resource requests, which have preset defaults that you will almost always need to customize for your model. As you can see, this interface enables the use of hardware accelerators, like GPUs.
The last extension showcases the mechanism that KFServing uses to enable canary deployments. This deployment strategy assumes that you only want to focus on a two-way traffic split, as opposed to an n-way traffic split. In order to customize your deployment strategy, do the following:
-
If you use just the default, like in your initial template, you get a standard
blue-greendeployment that comes with a Kubernetes Deployment resource. -
If you include a canary, with
canaryTrafficPercent == 0, you get a pinned deployment where you have an addressabledefaultandcanaryendpoint. This is useful if you wish to send experimental traffic to your new endpoint, while keeping your production traffic pointed to your old endpoint. -
If you include canary, with
canaryTrafficPercent > 0, you get acanarydeployment that enables you to slowly increment traffic to your canary deployment, in a transparent way. In the above example, you are experimenting withflowers-2, and as you slowly increment thiscanaryTrafficPercentageyou can gain confidence that your new model will not break your current users.19 Eventually, you would go to100, thereby flipping the canary and default, and you should then delete your old version afterward.
Now that we understand some of the powerful abstractions that KFServing offers, let’s use KFServing to host your Product Recommender example.
Recommender Example
We will now put your Product Recommender example, from “Building a Recommender with TensorFlow”, behind an InferenceService.
Warning
Because the kubeflow namespace is a system-namespace, you are unable to create an InferenceService in the kubeflow namespace.
As such, you must deploy your InferenceService in another namespace.
First you will define your InferenceService with the following 11 lines of yaml:
apiVersion:"serving.kubeflow.org/v1alpha2"kind:"InferenceService"metadata:name:"recommender"namespace:my-namespacespec:default:predictor:tensorflow:serviceAccount:defaultstorageUri:"s3://models/recommender"
After running kubectl apply and waiting until your InferenceService is Ready, you should see:
$kubectl get inferenceservices -n my-namespace NAME URL READY DEFAULT TRAFFIC CANARY TRAFFIC AGE recommender http://recommender.my-namespace.example.com/v1/models/recommender True10059s
You can then curl your InferenceService with the following:
kubectl port-forward --namespace istio-system$(kubectl get pod --namespace istio-system --selector="app=istio-ingressgateway"--outputjsonpath='{.items[0].metadata.name}')8080:80 curl -v -H"Host: recommender.my-namespace.example.com"http://localhost:8080/v1/models/recommender:predict -d'{"signature_name":"serving_default","inputs": {"products": [[1],[2]],"users" : [[25], [3]]}}'
Warning
If your curl returns a 404 Not Found error, this is a known Istio Gateway issue that is
present in Kubeflow 1.0.x. We recommend that you use Kubeflow 1.1 or above. A possible workaround is described in this GitHub issue.
As an alternative to curl, you may also use the KFServing PythonSDK to send requests in Python.20.
In addition to an HTTP endpoint, this simple interface also provides all the serverless features that come with Kubeflow’s Stack + Knative, including, but not limited to:
-
Scale-to-zero
-
GPU Autoscaling
-
Revision Management (Safe Rollouts)
-
Optimized Containers
-
Network Policy and Authentication
-
Tracing
-
Metrics
As such, with only a few lines of yaml, KFServing provides production ML features, while also allowing Data Scientists to scale their deployments into the future. But how does KFServing enable these features in such an abstracted way?
We will now look at KFServing’s underlying infrastructure stack and see how it promotes serverless, how its layers can be further customized, and what additional features exist.
Peeling Back the Underlying Infrastructure
By peeling back its infrastructure stack, you can see how KFServing enables serverless ML while also educating you on how to debug your inference solutions.
KFServing is built in a cloud-native way, as is Kubeflow.
It benefits from the features of every layer below it.
As seen in Figure 8-7, KFServing is built on the same stack as Kubeflow but is one of the few Kubeflow solutions
that leverages Istio and Knative functionality quite heavily.
We will now walk through the role of each of these components, in greater detail then we did in previous chapters, to see what parts of these layers KFServing utilizes.
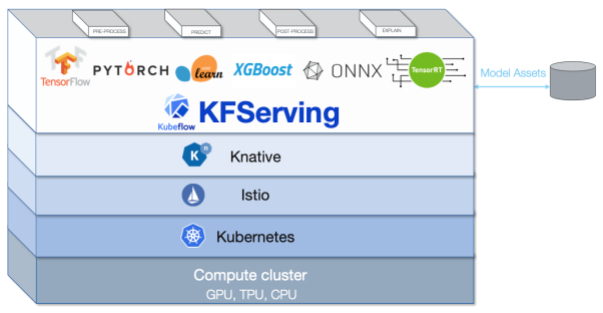
Figure 8-7. KFServing Infrastructure Stack
Going layer by layer
Hardware that runs your compute cluster is the base-building block for all the layers above. Your cluster could run a variety of hardware devices including: CPUs, GPUs, or even TPUs. It is the responsibility of the layers above to simplify the toggling of hardware types and to abstract as much complexity as possible.
Kubernetes is the critical layer, right above the compute cluster, that manages, orchestrates, and deploys a variety of resources—successfully abstracting the underlying hardware.
The main resources we will focus on are Deployments, Horizontal Pod Autoscalers (HPA), and Ingresses.
And since Kubernetes abstracts the underlying hardware, upon which deployments are run, this enables you to use hardware optimizers like GPUs within the upper levels of the stack.
Istio has been alluded to through this book, but we will talk about a few of its features that are particularly relevant to KFServing.
Istio is an open source service mesh that layers transparently onto the Kubernetes cluster.
It integrates into any logging platform, or telemetry or policy system and promotes a uniform way to secure, connect, and monitor microservices.
But what is a service mesh? Traditionally, each service instance is co-located with a sidecar network proxy.
All network traffic (HTTP, REST, gRPC, etc.) from an individual service instance flows via its local sidecar proxy to the appropriate destination.
Thus, the service instance is not aware of the network at large and only knows about its local proxy.
In effect, the distributed system network has been abstracted away from the service programmer.
Primarily, Istio expands upon Kubernetes Resources, like Ingresses, to provides service mesh fundamentals like:
-
Authentication/Access control
-
Ingress and Egress policy management
-
Distributed Tracing
-
Federation via multi-cluster ingress and routing
-
Intelligent traffic management
These tools are all critical for production inference applications that require administration, security, and monitoring.
The last component of the KFServing infrastructure stack is Knative, which takes advantage of the abstractions that Istio provides.
The KFServing project primarily borrows from Knative Serving and Eventing, the latter which will be expanded upon in “Knative Eventing”.
As we described in “Knative”, Knative Serving builds on Kubernetes and Istio to support deploying and serving serverless applications.
By building atop Kubernetes resources, like Deployments and HPA`s, and Istio resources, like `virtual services, Knative Serving provides:
-
An abstracted service mesh
-
CPU/GPU autoscaling: either QPS (Queries per second) or metric based
-
Revision management for safe rollouts and canary/pinned deployment strategies
These offerings are desirable for data scientists who want to limit their focus and energy to model development, and have scaling and versioning be handled for them in a managed way.
Escape Hatches
KFServing’s extensibility features escape hatches to the underlying layers of its stack.
By building escape hatches into the InferenceService CRD, data scientists can further tune their production inference
offering for security at the Istio level, and performance at the Knative level.
We will now walk through one example of how you can leverage these escape hatches, by tuning the autoscaling of your InferenceService.
To understand how to use this escape hatch, you need to understand how Knative enables autoscaling.
There is a proxy in the Knative Serving Pods called the (queue-proxy) that is responsible for enforcing request queue parameters (concurrency limits),
and reporting concurrent client metrics to the autoscaler.
The autoscaler, in turn, reacts to these metrics by bringing pods up and down.
Every second, the queue proxy publishes the observed number of concurrent requests in that time period.
KFServing by default sets the target concurrency (average number of in-flight requests per pod) to be one.
If we are to load the service with five concurrent requests, the autoscaler would try to scale up to five pods.
You can customize the target concurrency by adding the example annotation autoscaling.knative.dev/target.
Here is the example Recommender InferenceService from earlier:
apiVersion:"serving.kubeflow.org/v1alpha2"kind:"InferenceService"metadata:name:"recommender"namespace:my-namespacespec:default:predictor:tensorflow:serviceAccount:defaultstorageUri:"s3://models/recommender"
If you test this service by sending traffic in 30-second spurts while maintaining five in-flight requests, you will see that the autoscaler scales up your inference services to five pods.21.
Note
There will be a cold-start time cost as a result of initially spawning pods and downloading the model, before being ready to serve. The cold start may take longer (to pull the serving image) if the image is not cached on the node that the pod is scheduled on.
By applying the annotation autoscaling.knative.dev/target:
apiVersion:"serving.kubeflow.org/v1alpha2"kind:"InferenceService"metadata:name:"recommender"namespace:my-namespaceannotations:autoscaling.knative.dev/target:"5"spec:default:predictor:tensorflow:serviceAccount:defaultstorageUri:"s3://models/recommender"
This will set the target concurrency to five. Which means, that if you load the service with five concurrent requests, you will see that you only need one pod for your inference service.
Debugging an InferenceService
With a fully abstracted interface, InferenceService enables many features while giving minimal exposure to the complexity under the hood. To properly debug your InferenceService, let’s look at the request flow upon hitting your InferenceService.
The request flow when hitting your inference service, illustrated in Figure 8-8, is as follows:
-
Traffic arrives through the Istio Ingress Gateway when traffic is external and through the Istio Cluster Local Gateway when traffic is internal.
-
KFServing creates an Istio VirtualService to specify its top-level routing rules for all of its components. As such traffic routes to that top-level VirtualService from the Gateway.
-
Knative creates an Istio Virtual service to configure the gateway to route the user traffic to the desired revision. Upon opening up the destination rules, you will see that the destination is a Kubernetes Service for the latest ready Knative Revision.
-
Once the revision pods are ready, the Kubernetes Service will send the request to the queue-proxy.
-
If the queue-proxy has more requests than it can handle, based on the concurrency of the kfserving container, then the autoscaler will create more pods to handle the additional requests.
-
-
Lastly, the queue-proxy will send traffic to the kfserving controller.

Figure 8-8. KFSeving request flow
Where does this come in handy? Well say you create your InferenceService but the Ready status is false:
kubectl get inferenceservice -n my-namespace recommender
NAME          URL   READY   DEFAULT TRAFFIC   CANARY TRAFFIC   AGE
recommender         False                                      3s
You can step through the resources that are created in the request flow and view each of their status objects to understand what is the blocker.22.
Debugging Performance
What if you deployed your InferenceService but its performance does not meet your expectations? KFServing provides various dashboards and tools to help investigate such issues. Using Knative, KFServing has many resources in its “debugging performance issues” guide. You can also follow this Knative guide to access Prometheus and Grafana. Lastly, you can also use request tracing, also known as distributed tracing, to see how much time is spent in each step of KFServing’s request flow in Figure 8-8. You can use this Knative guide to access request traces.
Knative Eventing
By bringing in Knative into its stack, KFServing enabled serverless via Knative Serving and the use of event-sources and event-consumers via Knative Eventing.23
We will take a look at how Knative Eventing works, and how you can extend you inference service with an event source.
Knative Eventing enforces a lambda-style architecture of event-sources and event-consumers with the following design principles:
-
Knative Eventing services are loosely coupled.
-
Event producers and event consumers are independent. Any producer or Source, can generate events before there are active event consumers listening. Any event consumer can express interest in an event before there are producers that are creating those events.
-
Other services can be connected to any Eventing system that:
-
Creates new applications without modifying the event producer or event-consumer.
-
Selects and targets specific subsets of events from their producers.
-
Knative Eventing delivers events in two flavors: direct delivery from a Source to a single service and fan-out delivery from a Source to multiple endpoints using Channels and Subscriptions.
There are a variety of Sources24 that come out of the box when installing Knative Eventing, one of which includes the KafkaSource.25 We will take a look at an example specification for how you would use a KafkaSource to send events, received by Kafka, to your Recommender example:
apiVersion:sources.knative.dev/v1alpha1kind:KafkaSourcemetadata:name:kafka-sourcespec:consumerGroup:knative-group# Broker URL. Replace this with the URLs for your kafka cluster,# which is in the format of my-cluster-kafka-bootstrap.my-kafka-namespace:9092.bootstrapServers:my-cluster-kafka-bootstrap.my-kafka-namespace:9092.topics:recommendersink:ref:apiVersion:serving.kubeflow.org/v1alpha2kind:InferenceServicename:recommender
As you can see by the simplicity of this specification, after setting up your Kafka resources, hooking up Kafka into your InferenceService is as simple as 13 lines of yaml. You can also find a more advanced end-to-end example with Minio and Kafka this GitHub site.
Additional Features
KFServing contains a host of features that are continuously being improved. A comprehensive list of its capabilities can be found here.
Review
Building serverless on top of Seldon Core’s graph inferencing, KFServing has produced a complete Inference solution that sufficiently fills all the gaps missing from TFServing and Seldon Core. KFServing works to unify the entire community of model servers by running model servers as Knative components. With all of its functionality and promise, we will take take a look at how KFServing manages to satisfy all your inference requirements.
Model Serving
KFServing makes graph inference and advanced ML insights first-class while also defining a Data Plane that is extremely extensible for pluggable components. This flexibility allows data scientists to focus on ML insights without having to strain over how to include it in the graph.
KFServing is not only versatile in that it provides serving flexibility for a variety of frameworks,
but it also standardizes the Data Plane across differing frameworks to reduce complexity in switching between model servers.
It codifies the Kubernetes design pattern by moving common functionalities like request-batching, logging, and pipe-lining into a sidecar.
This, in turn, slims down the model server and creates a “separation of concerns,” as model services without these features can immediately benefit from deploying onto KFServing.
It also provides support for both REST, gRPC, and GPU acceleration and can interface with streaming inputs using Knative Eventing.
And lastly, thanks to Knative Serving, KFServing provides GPU autoscaling, which you expect from a hardware agnostic auto-scaling.
Model Monitoring
By taking from Seldon Core and its infrastructure stack, KFServing meets all of your model monitoring needs. KFServing leverages the sophisticated model explainers and drift detectors of Seldon Core in a first-class way, while also paving a way for developers to define their own monitoring components in a highly flexible yet powerful Data Plane.
Furthermore, with all the networking capabilities enabled by having Istio and Knative in its infrastructure stack, KFServing provides extensible network monitoring and telemetry with support for Prometheus, Grafana, Kibana, Zipkin, and Jaeger, to name a few. These all satisfy your needs to monitor for Kubernetes metrics, i.e., memory/CPU container limits, and server metrics, i.e., qps and distributed tracing.
Model Updating
KFServing’s use of Knative was strategic in providing sophisticated model updating features. As such, KFServing satisfies all of your requirements regarding deployment strategies and version rollouts.
By leveraging Istio’s virtual services and the simplicity of an abstracted CRD, KFServing makes the toggling of deployment strategies simple. It makes the flow from blue-green → pinned → canary as simple as changing a few lines of yaml. Furthermore, with the diverse and ever-expanding feature of its underlying stack, KFServing is easily extensible to support more complicated deployment strategies like Multi-Armed Bandit.26
By using Knative Serving, KFServing adopts revision management that makes Kubernetes deployment immutable. This ensures safe rollout by health checking the new revisions pods before moving over the traffic. A revision enables:
-
Automated and safe-roll rollouts
-
Bookkeeping for all revisions previously created
-
Rollbacks to known, good configurations
This sufficiently satisfies your versioning requirements for models in development, in flight, and in production.
Summary
KFServing has developed a sophisticated inference solution that abstract its complexity from day-one users while also enabling power users to take advantage of its diverse feature set. Building cloud-native, KFServing seamlessly sits atop Kubeflow and finalizes the MDLC life cycle with its inference solution.
Conclusion
In this chapter we investigated various inference solutions that can be used within Kubeflow.
Based on what inference requirements you wish to prioritize and how deep you want your infrastructure stack to be, each of the solutions described have distinctive advantages. Having reviewed each of the offerings in detail, it might be worthwhile to reconsider Table 8-2 and see which inference solution is appropriate for your use case.
-
TFServing provides extremely performant and sophisticated out-of-the-box integration for TensorFlow models.
-
Seldon Core provides extensibility and sophisticated out-of-the-box support for complex inference graphs and model insight.
-
KFServing provides a more simple opinionated deployment definition with serverless capabilities.
However, technology and development is shared between all these projects and looking to the future, Seldon Core will even support the new KFServing Data Plane with the goal to provide easy interoperability and conversion. Other exciting features to expect from KFServing include Multi-Model Serving, progressive rollouts, and more advanced graph inferencing techniques like pipelines and Multi-Armed Bandit.
Now that you have completed the final step in your MDLC story, we will take a look to see how you can further customize Kubeflow to enable more advanced features in the next chapter.
1 If you are interested in learning more about model embedding, we suggest reading Serving Machine Learning Models by Boris Lublinsky (O’Reilly).
2 Some references include: Failing Loudly: An Empirical Study of Methods for Detecting Dataset Shift, “Detecting and Correcting for Label Shift with Black Box Predictors”, “A Kernel Two-Sample Test”, and “Monitoring and explainability of models in production”.
3 Refer to the documentation for details on using TFServing locally.
4 Refer to the documentation for details on using TFServing on Kubernetes.
5 If you are using Istio as a Service Mesh follow these instructions to add a Virtual Service.
6 You can, of course, scale it manually by changing the amount of deployed instances.
7 See TFServing’s deployment strategy configuration for more information.
8 Refer to Seldon documentation for integration with Prometheus, ELK, and Jaeger.
9 Currently supported prepackaged servers include MLflow server, SKLearn server, Tensorflow serving and XGBoost server.
10 Currently supported is a language server for Python. Incubating are Java, R, NodeJS, and Go.
11 Because Seldon implements the computational structure as a tree, the combiner executes in reverse order to combine output from all children.
12 You can also send requests using the Python client
13 The definition of SeldonMessage can be found both as an OpenAPI specification and a protobuffer definition.
14 Documentation on enabling this can be found here.
15 See “Training a Model Using Scikit-Learn” for more information on this model and how it is build.
16 See the Seldon Core documentation for further details.
17 KFServing is continuously evolving, as is its protocol. You can preview the V2 protocol on this GitHub site. The second version of the data-plane protocol addresses several issues found with the V1 data-plane protocol, including performance and generality across a large number of model frameworks and servers.
18 KFServing also supports standalone installation without Kubeflow. In fact, most production users of KFServing run in standalone.
19 You can still predict against a certain version by passing in a Host-Header in your request. For more information on rollouts, look here.
20 You can install the SDK by running pip install kfserving. You can get the KFServing SDK documentation on this GitHub site and examples on this GitHub site: for creating, rolling-out, promoting, and deleting an InferenceService.
21 You can further explore load-testing this GitHub site. Two great load-testing frameworks are hey and vegeta.
22 A detailed debugging guide can be found on this GitHub site.
23 To learn more about Knative Eventing, you can navigate this documentation.
24 Knative has a non-exhaustive list of EventSources.
25 To learn more about the KafkaSource, check out the documentation.
26 Check out examples of how ML Graph can be used to build complex graphs of ML components here.