
C H A P T E R 6
Exadata Parallel Operations
Exadata doesn't have a special way of executing parallel operations that is not available on other platforms running 11gR2. However, parallel processing is a key component of Exadata because efficient handling of Data Warehouse workloads was a primary design goal for Exadata. In addition, because Offloading/Smart Scan depends on direct path reads, which are used by parallel query slaves, parallel operations take on a whole new importance. Traditionally, the use of parallel query has required careful control of concurrency in order to maximize the use of available resources without overwhelming the system. Oracle's previous attempts at throttling parallel operations to allow them to be used in multiuser environments have not been entirely successful. 11gR2 provides some new capabilities for controlling parallel operations. In particular, a queuing mechanism has been introduced that allows the number of concurrent parallel processes to be managed more effectively. This approach appears to be much better suited to allowing a high degree of parallelism without overwhelming the available resources than previous attempts. 11gR2 also introduced the ability for Oracle to automatically calculate a degree of parallelism on a statement-by-statement basis.
This chapter is about parallel query. Other forms of parallelism provided by the database, such as recovery parallelism, will not be covered here. We will briefly cover parallel query mechanics and demonstrate specifically how the queuing mechanism and automatic degree of parallelism work with Exadata. This chapter will also briefly cover the new 11gR2 In-Memory Parallel Execution feature and discuss how Exadata storage parallelizes I/O operations. It will not cover all the details of parallel query or parallel DML and assumes that the reader is familiar with basic Oracle parallel concepts. Note also that the discussion and examples will refer to behavior in Oracle Database 11g Release 2 (11.2.0.2). In most cases, the comments apply equally to version 11.2.0.1 as well. Exceptions are explicitly called out.
Parameters
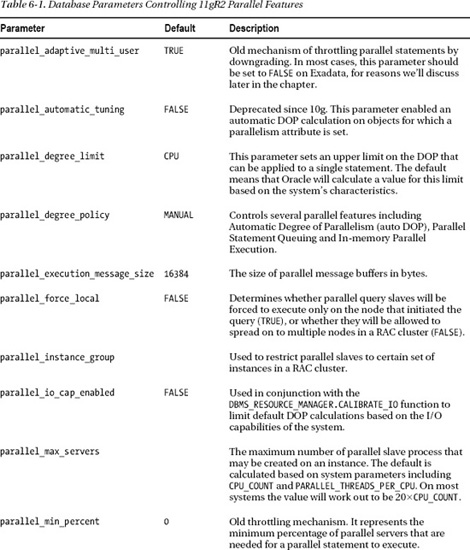
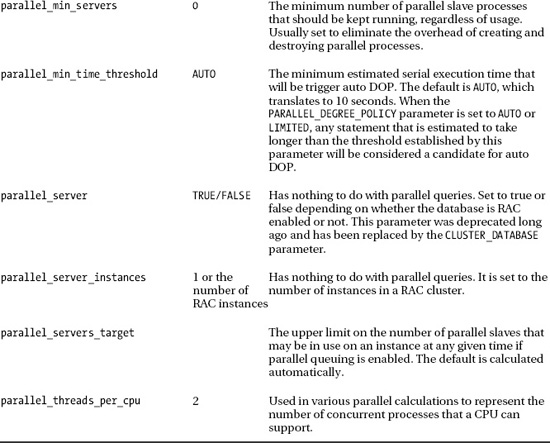
Before describing the various new features and how they apply to Exadata, you should review the parameters that affect how parallel queries are handled by the database. Table 6-1 shows the parameters along with a brief description of each one's purpose.
Parallelization at the Storage Tier
Exadata has a lot of processing power at the storage layer. Regardless of whether you are using a V2 quarter rack or an X2-8 full rack, you still have more CPU resources available at the storage layer than you have at the database layer. Since Smart Scans offload a lot of processing to the storage cells, every query executed via Smart Scan is effectively parallelized across the CPUs on the storage cells. This type of parallelization is completely independent of the database parallel processing capabilities, by the way. So this kind of parallelization occurs even when the activity is driven by a single process on a single database server. This introduces some interesting issues that should be considered with regard to normal parallelization at the database tier. Since one of the primary jobs of a parallelized query is to allow multiple processes to participate in the I/O operations, and since the I/O operations are already spread across multiple processes, the degree of parallelism required by statements running on the Exadata platform should be smaller than on other platforms.
Auto DOP
One of the major changes to parallel operations in Oracle Database 11g Release 2 was the addition of a feature affectionately known as Auto DOP. It was designed to overcome the problems associated with the fact that there is rarely a single DOP value that is appropriate for all queries touching a particular object. Prior to 11gR2, DOP could be specified at the statement level via hints or at the object level via the DEGREE and INSTANCE settings. Realistically, using hints at the statement level makes more sense in most situations for the reason just mentioned. But it requires that the developers understand the platform that the statements will be running on and the workload that the hardware will be supporting at the time of execution. Getting the settings correct can be a tedious trial-and-error process and unfortunately, DOP cannot be changed while a statement is running. Once it starts, your only options are to let it complete or kill it and try again. This makes fine tuning in a “live” environment a painful process.
Operation and Configuration
When Auto DOP is enabled, Oracle evaluates each statement to determine whether it should be run in parallel and if so, what DOP should be used. Basically any statement that the optimizer concludes will take longer than 10 seconds to run serially will be a candidate to run in parallel. The 10-second threshold can be controlled by setting the PARALLEL_MIN_TIME_THRESHOLD parameter by the way. This decision is made regardless of whether any of the objects involved in the statement have been decorated with a parallel degree setting or not.
Auto DOP is enabled by setting the PARALLEL_DEGREE_POLICY parameter to a value of AUTO or LIMITED. The default setting for this parameter is MANUAL, which disables all three of the new 11gR2 parallel features (Auto DOP, Parallel Statement Queuing, In-memory Parallel Execution). Unfortunately, PARALLEL_DEGREE_POLICY is one of those parameters that control more than one thing. The following list shows the effects of the various settings for this parameter.
MANUAL: IfPARALLEL_DEGREE_POLICYis set toMANUAL, none of the new 11gR2 parallel features will be enabled. Parallel processing will work as it did in previous versions. That is to say, statements will only be parallelized if a hint is used or an object is decorated with a parallel setting.
LIMITED: IfPARALLEL_DEGREE_POLICYis set toLIMITED, only Auto DOP is enabled while Parallel Statement Queuing and In-memory Parallel Execution remain disabled. In addition, only statements accessing objects that have been decorated with the default parallel setting will be considered for Auto DOP calculation.
AUTO: IfPARALLEL_DEGREE_POLICYis set toAUTO, all three of the new features are enabled. Statements will be evaluated for parallel execution regardless of any parallel decoration at the object level.
Although the only documented way to enable Parallel Statement Queuing and In-memory Parallel Execution are via the all-or-nothing setting of AUTO, the developers have thoughtfully provided hidden parameters that provide independent control of these features. Table 6-2 shows the parameters and how the settings of PARALLEL_DEGREE_POLICY alter the hidden parameters.
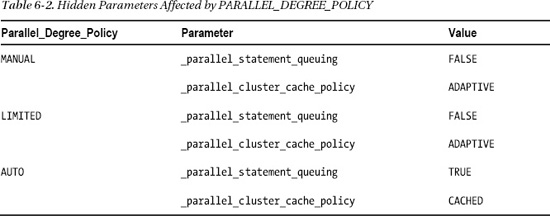
It's pretty obvious what the _PARALLEL_STATEMENT_QUEUING parameter controls. When it is set to TRUE, queuing is enabled. The purpose of the _PARALLEL_CLUSTER_CACHE_POLICY parameter is a little less obvious. It turns out that it controls In-memory Parallel Execution. Setting the value of the _PARALLEL_CLUSTER_CACHE_POLICY parameter to CACHED enables In-memory Parallel Execution. You should note that In-memory Parallel Execution is arguably of less value on the Exadata platform, because the Smart Scan optimizations will not be available when using this feature to scan the buffer cache. We'll discuss that in more detail a little later. In the meantime, here's an example showing Auto DOP in action.
SYS@EXDB1> @dba_tables

Enter value for owner: KSO

Enter value for table_name: SKEW


OWNER      TABLE_NAME STATUS   LAST_ANAL   NUM_ROWS     BLOCKS DEGREE

---------- ---------- -------- --------- ---------- ---------- ----------

KSO        SKEW       VALID    25-NOV-10   32000004     162294          1


SYS@EXDB1> alter system set parallel_degree_policy=auto;


System altered.


SYS@EXDB1> select avg(pk_col) from kso.skew a where col1 > 0;


AVG(PK_COL)

-----------

 16093749.3


1 row selected.


SYS@EXDB1> @fs

Enter value for sql_text: %skew%

Enter value for sql_id:
SQL_ID            AVG_ETIME      AVG_LIO SQL_TEXT

------------- ------------- ------------ ----------------------------------

05cq2hb1r37tr         28.77      162,427 select avg(pk_col) from kso.skew a

                                         where col1 > 0


1 rows selected.


SYS@EXDB1> !cat dplan.sql

set lines 150

select * from table(dbms_xplan.display_cursor('&sql_id','&child_no','typical'))

/


SYS@EXDB1> @dplan

Enter value for sql_id: 05cq2hb1r37tr

Enter value for child_no: 2


PLAN_TABLE_OUTPUT


------------------------------------------------------------------------------------------

SQL_ID  05cq2hb1r37tr, child number 2

-------------------------------------

select avg(pk_col) from kso.skew a where col1 > 0


Plan hash value: 578366071)


------------------------------------------------------------------------------------------

| Id  | Operation              | Name     | Rows | Bytes | Cost (%CPU)| Time     |   TQ  |

------------------------------------------------------------------------------------------

|   0 | SELECT STATEMENT       |          |      |       |  6308 (100)|          |       |

|   1 |  SORT AGGREGATE        |          |    1 |    24 |            |          |       |

|   2 |   PX COORDINATOR       |          |      |       |            |          |       |

|   3 |    PX SEND QC (RANDOM) | :TQ10000 |    1 |    24 |            |          | Q1,00 |

|   4 |     SORT AGGREGATE     |          |    1 |    24 |            |          | Q1,00 |

|   5 |      PX BLOCK ITERATOR |          |   32M|   732M|  6308   (1)| 00:01:16 | Q1,00 |

|*  6 |       TABLE ACCESS FULL| SKEW     |   32M|   732M|  6308   (1)| 00:01:16 | Q1,00 |

------------------------------------------------------------------------------------------


Predicate Information (identified by operation id):

---------------------------------------------------


   6 - access(:Z>=:Z AND :Z<=:Z)

       filter("COL1">0)


Note

-----

   - automatic DOP: Computed Degree of Parallelism is 5


28 rows selected. )
So as you can see, enabling Auto DOP allowed the statement to be parallelized, even though the table was not decorated with a parallel setting. Also, notice that the plan output produced by DBMS_XPLAN shows that Auto DOP was enabled and the calculated DOP was 5.
Oracle has provided some control over the Automatic DOP calculations as well with the PARALLEL_DEGREE_LIMIT parameter. The default value for this parameter is CPU, which tells Oracle to calculate an “Ideal DOP” based on the amount of data, but then caps it with a formula based on CPU_COUNT, THREADS_PER_CPU, and ACTIVE_INSTANCE_COUNT.
I/O Calibration
Oracle Database version 11.2.0.2 introduced a restriction to Auto DOP requiring that the I/O system be calibrated before statements will be automatically parallelized. The calibration is done by the DBMS_RESOURCE_MANAGER.CALIBRATE_IO procedure, which generates a random read-only workload and spreads it across all instances in a RAC cluster. It runs for several minutes (longer on RAC databases because it must run on each instance). The procedure can put a significant load on the system, and the documentation recommends running it when the system is idle or very lightly loaded. Here's an example of what happens if the calibration procedure has not been run on 11.2.0.2:
SYS@LAB11202> @dplan

Enter value for sql_id: 05cq2hb1r37tr

Enter value for child_no:


PLAN_TABLE_OUTPUT

---------------------------------------------------------------------------------------

SQL_ID  05cq2hb1r37tr, child number 0

-------------------------------------

select avg(pk_col) from kso.skew a where col1 > 0


Plan hash value: 568322376


---------------------------------------------------------------------------

| Id  | Operation          | Name | Rows  | Bytes | Cost (%CPU)| Time     |

---------------------------------------------------------------------------

|   0 | SELECT STATEMENT   |      |       |       | 44298 (100)|          |

|   1 |  SORT AGGREGATE    |      |     1 |    11 |            |          |

|*  2 |   TABLE ACCESS FULL| SKEW |    32M|   335M| 44298   (1)| 00:01:29 |

---------------------------------------------------------------------------


Predicate Information (identified by operation id):

---------------------------------------------------


   2 - filter("COL1">0)


Note

-----

   - automatic DOP: skipped because of IO calibrate statistics are missing


23 rows selected.
As you can see, when the I/O calibration has not been done, Auto DOP is disabled and the optimizer generates a serial execution plan. There are two views that provide additional information about the calibration process. The V$IO_CALIBRATION_STATUS view shows whether the calibration has been done, while the DBA_RSRC_IO_CALIBRATE view shows the results of the procedure. Here's an example showing how to use the procedure:
SYS@EXDB1> select * from V$IO_CALIBRATION_STATUS;


STATUS        CALIBRATION_TIME

------------- -------------------------------------------------------------

NOT AVAILABLE


1 row selected.


SYS@EXDB1> !cat calibrate_io.sql

SET SERVEROUTPUT ON

DECLARE

  lat  INTEGER;

  iops INTEGER;

  mbps INTEGER;

BEGIN

-- DBMS_RESOURCE_MANAGER.CALIBRATE_IO (<DISKS>, <MAX_LATENCY>, iops, mbps, lat);

   DBMS_RESOURCE_MANAGER.CALIBRATE_IO (&no_of_disks, 10, iops, mbps, lat);


  DBMS_OUTPUT.PUT_LINE ('max_iops = ' || iops);

  DBMS_OUTPUT.PUT_LINE ('latency  = ' || lat);

  dbms_output.put_line('max_mbps = ' || mbps);

end;

/


SYS@EXDB1> set timing on

SYS@EXDB1> @calibrate_io

Enter value for no_of_disks: 36
-- switch to other session on DB server


> top

top - 21:12:32 up 10 days,  9:27,  3 users,  load average: 0.49, 0.44, 0.47

Tasks: 814 total,   1 running, 813 sleeping,   0 stopped,   0 zombie

Cpu(s):  0.4%us,  0.1%sy,  0.0%ni, 99.4%id,  0.1%wa,  0.0%hi,  0.0%si,  0.0%st

Mem:  74027752k total, 52225108k used, 21802644k free,   829336k buffers

Swap: 16771852k total,        0k used, 16771852k free, 43078508k cached


  PID USER      PR  NI  VIRT  RES  SHR S %CPU %MEM    TIME+  COMMAND

14825 oracle    15   0 5225m  22m  19m S  1.7  0.0   0:00.15 ora_cs02_EXDB1

14827 oracle    15   0 5225m  22m  19m S  1.1  0.0   0:00.14 ora_cs03_EXDB1

14831 oracle    15   0 5225m  22m  19m S  1.1  0.0   0:00.14 ora_cs05_EXDB1

11810 oracle    15   0 12.2g  54m  39m S  0.6  0.1  12:44.67 ora_dia0_POC1

14821 oracle    15   0 5225m  22m  19m S  0.6  0.0   0:00.13 ora_cs00_EXDB1

14823 oracle    15   0 5225m  22m  19m S  0.6  0.0   0:00.15 ora_cs01_EXDB1

14829 oracle    15   0 5225m  22m  19m S  0.6  0.0   0:00.12 ora_cs04_EXDB1

15239 osborne   16   0 13268 1648  816 R  0.6  0.0   0:00.03 top

28118 oracle    RT   0  335m 133m  52m S  0.6  0.2  88:21.34


-- switch to one of the cells


[enkcel01:root] /root > vmstat 2


procs -----------memory---------- ---swap-- -----io---- --system-- -----cpu------

 r  b   swpd   free   buff  cache   si   so    bi    bo   in   cs us sy id wa st

 0  1      0 9147200 311736 1353092    0    0   390   298    1    1  1  1 98  0  0

 0  1      0 9147504 311736 1353092    0    0  2010   233 1732 21385  0  0 94  6  0

 1  1      0 9147504 311736 1353092    0    0  1810   241 1675 21294  0  1 94  5  0

 0  1      0 9148000 311736 1353136    0    0  1917   157 1715 21715  0  0 94  5  0

 0  1      0 9147876 311736 1353140    0    0  2018   357 1770 20928  0  0 94  5  0

 0  1      0 9145776 311736 1353140    0    0  1906   298 1713 20086  0  0 94  5  0


-- switch back to original session)


max_iops = 1004

latency  = 10

max_mbps = 2201


PL/SQL procedure successfully completed.


Elapsed: 00:13:41.27

SYS@EXDB1> set timing off

SYS@EXDB1> @mystats)

Enter value for name: cell flash cache


NAME                                                                   VALUE

------------------------------------------------------------ ---------------

cell flash cache read hits                                                 0


SYS@EXDB1> select * from V$IO_CALIBRATION_STATUS;


STATUS        CALIBRATION_TIME

------------- --------------------------------------------------------------

READY         10-DEC-10 09.20.11.254 PM


SYS@EXDB1> select to_char(start_time,'dd-mon-yy') start_time ,

  2               MAX_IOPS, MAX_MBPS, MAX_PMBPS, LATENCY, NUM_PHYSICAL_DISKS

  3          from DBA_RSRC_IO_CALIBRATE;


START_TIM   MAX_IOPS   MAX_MBPS  MAX_PMBPS    LATENCY NUM_PHYSICAL_DISKS

--------- ---------- ---------- ---------- ---------- ------------------

11-dec-10       1004       2201        101         10                 36
This listing is a little long, so let‘s walk through what we did:
- We checked the current status in
V$IO_CALIBRATION_STATUS. - We ran the
DBMS_RESOURCE_MANAGER.CALIBRATE_IOprocedure using a script calledcalibrate_io.sql. - We then jumped to another session to see what kind of activity was generated on the database server (using
top). - Next we created a session on one of the storage servers to see the activity there (using
vmstat). - We then switched back to the original session and after almost 14 minutes the procedure completed.
- Finally we checked the status and results in
V$IO_CALIBRATION_STATUSandDBA_RSRC_IO_CALIBRATE.
Auto DOP Wrap Up
The end result of setting PARALLEL_DEGREE_POLICY to AUTO is that all kinds of statements will be run in parallel, even if no objects have been specifically decorated with a parallel degree setting. This is truly automatic parallel processing because the database decides what to run in parallel and with how many slaves. On top of that, by default, the slaves may be spread across multiple nodes in a RAC database. Unfortunately this combination of features is a little like the Wild West, with things running in parallel all over the place. But the ability to queue parallel statements does provide some semblance of order, which leads us to the next topic.
Parallel Statement Queuing
I recently attended a Tech Day where one of the speakers recalled the presentation Larry Ellison did when Oracle first announced the Parallel Query feature (Oracle version 7). In the demo, Larry had a multiprocessor computer all to himself. I don't remember how many processors it had, but I remember he had some kind of graphic showing individual CPU utilization on one screen while he fired up a parallel query on another screen. The monitoring screen lit up like a Christmas tree. Every one of the CPUs was pegged during his demo. When the speaker was telling the story he said that he had wondered at the time what would have happened if there had been other users on the system during the demo. Their experience would probably not have been a good one. That's exactly the issue that Parallel Statement Queuing attempts to resolve.
Oracle's parallel capabilities have been a great gift but they have also been a curse because controlling the beast in an environment where there are multiple users trying to share the resources is difficult at best. There have been attempts to come up with a reasonable way of throttling big parallel statements. But to date, I don't think those attempts have been overly successful.
One of the most promising aspects of Exadata is its potential to run mixed workloads (OLTP and DW), without crippling one or the other. In order to do that, Oracle needs some mechanism to separate the workloads and, just as importantly, to throttle the resource intensive parallel queries. Parallel Statement Queuing appears to be just such a tool. And when combined with Resource Manager, it provides a pretty robust mechanism for throttling the workload to a level that the hardware can support.
The Old Way
Before we get to the new Parallel Queuing functionality we should probably review how it was done in previous versions. The best tool we had at our disposal was Parallel Adaptive Multiuser, which provides the ability to automatically downgrade the degree of parallelism for a given statement based on the workload when a query executes. It is actually a powerful mechanism and it is the best approach we've had prior to 11gR2. This feature is enabled by setting the PARALLEL_ADAPTIVE_MULTI_USER parameter to TRUE. This is still the default in 11gR2 by the way, so this is definitely a parameter that you may want to consider changing. The downside of this approach is that parallelized statements can have wildly varying execution times. As you can imagine, a statement that gets 32 slaves one time and then gets downgraded to serial execution the next time will probably not make the users very happy.
The argument for this type of approach is that stuff is going to run slower if the system is busy regardless of what you do, and that users expect it to run slower when the system is busy. The first part of that statement may be true, but I don't believe the second part is (at least in most cases). The bigger problem with the downgrade mechanism though is that the decision about how many slaves to use is based on a single point in time, the point when the parallel statement starts. Recall that once the degree of parallelism (DOP) is set for an execution plan, it cannot be changed. The statement will run to completion with the number of slaves it was assigned, even if additional resources become available while it is running.
So consider the statement that takes one minute to execute with 32 slaves. And suppose that same statement gets downgraded to serial due to a momentarily high load. And say that a few seconds after it starts, the system load drops back to more normal levels. Unfortunately, the serialized statement will continue to run for nearly 30 minutes with its single process, even though on average, the system is not busier than usual. This sort of erratic performance can wreak havoc for those using the system, and for those supporting it.
The New Way
Now let's compare Parallel Adaptive Multi User (the old way), with the new mechanism introduced in 11gR2 that allows parallel statements to be queued. This mechanism separates long running parallel queries from the rest of the workload. The mechanics are pretty simple. Turn the feature on. Set a target number of parallel slaves using the PARALLEL_SERVERS_TARGET parameter. Run stuff. If a statement that requires exceeding the target tries to start, it will be queued until the required number of slaves become available. There are of course many details to consider and other control mechanisms that can be applied to manage the process. So let's look at how it behaves:
SYS@EXDB1> alter system set parallel_degree_policy=auto;


System altered.


SYS@EXDB1> alter system set parallel_servers_target=10;


System altered.


SYS@EXDB1> @parms

Enter value for parameter: parallel%

Enter value for isset:

Enter value for show_hidden:
NAME                              VALUE                          ISDEFAUL

--------------------------------- ------------------------------ --------

parallel_adaptive_multi_user      FALSE                          TRUE

parallel_automatic_tuning         FALSE                          TRUE

parallel_degree_limit             8                              FALSE

parallel_degree_policy            AUTO                           FALSE

parallel_execution_message_size   16384                          TRUE

parallel_force_local              TRUE                           FALSE

parallel_instance_group                                          TRUE

parallel_io_cap_enabled           FALSE                          TRUE

parallel_max_servers              320                            TRUE

parallel_min_percent              0                              TRUE

parallel_min_servers              16                             FALSE

parallel_min_time_threshold       2                              TRUE

parallel_server                   TRUE                           TRUE

parallel_server_instances         2                              TRUE

parallel_servers_target           10                             FALSE

parallel_threads_per_cpu          2                              TRUE


16 rows selected.


SYS@EXDB1> !ss.sh avgskew.sql 20 kso/kso


starting 20 copies of avgskew.sql


SYS@EXDB1> set echo on

SYS@EXDB1> @queued_sql

SYS@EXDB1> col sql_text for a60 trunc

SYS@EXDB1> SELECT sid, sql_id, sql_exec_id, sql_text

   2  from v$sql_monitor

   3  WHERE status='QUEUED'

   4  order by 3

   5  /


       SID SQL_ID        SQL_EXEC_ID SQL_TEXT

---------- ------------- ----------- -----------------------------------------

       494 05cq2hb1r37tr    16777218 select avg(pk_col) from kso.skew a

                                     where col1 > 0

       541 05cq2hb1r37tr    16777220

       152 05cq2hb1r37tr    16777221

       102 05cq2hb1r37tr    16777222

       106 05cq2hb1r37tr    16777223

       201 05cq2hb1r37tr    16777224

       397 05cq2hb1r37tr    16777225

       250 05cq2hb1r37tr    16777226

       693 05cq2hb1r37tr    16777227

       154 05cq2hb1r37tr    16777228

       444 05cq2hb1r37tr    16777229

       743 05cq2hb1r37tr    16777230

       300 05cq2hb1r37tr    16777231

         5 05cq2hb1r37tr    16777232

        53 05cq2hb1r37tr    16777233
       642 05cq2hb1r37tr    16777234

       348 05cq2hb1r37tr    16777235

       200 05cq2hb1r37tr    16777236

       251 05cq2hb1r37tr    16777237


19 rows selected.


SYS@EXDB1> @check_px

SYS@EXDB1> select * from V$PX_PROCESS_SYSSTAT where statistic like '%In Use%';


STATISTIC                           VALUE

------------------------------ ----------

Servers In Use                          8


SYS@EXDB1> /


STATISTIC                           VALUE

------------------------------ ----------

Servers In Use                          0


SYS@EXDB1> /


STATISTIC                           VALUE

------------------------------ ----------

Servers In Use                          8


SYS@EXDB1> /


STATISTIC                           VALUE

------------------------------ ----------

Servers In Use                          8


SYS@EXDB1> set echo off

SYS@EXDB1> @snapper ash=sid+event+wait_class,ash1=plsql_object_id+sql_id 5 1 all

Sampling with interval 5 seconds, 1 times...


-- Session Snapper v3.11 by Tanel Poder @ E2SN ( http://tech.e2sn.com )


--------------------------------------------------------------

Active% |    SID | EVENT                     | WAIT_CLASS

--------------------------------------------------------------

   100% |    300 | resmgr:pq queued          | Scheduler

   100% |    348 | resmgr:pq queued          | Scheduler

   100% |    201 | resmgr:pq queued          | Scheduler

   100% |    200 | resmgr:pq queued          | Scheduler

   100% |    743 | resmgr:pq queued          | Scheduler

   100% |    251 | resmgr:pq queued          | Scheduler

   100% |    693 | resmgr:pq queued          | Scheduler

   100% |    642 | resmgr:pq queued          | Scheduler

   100% |      5 | resmgr:pq queued          | Scheduler

   100% |    541 | resmgr:pq queued          | Scheduler
--------------------------------------

Active% | PLSQL_OBJE | SQL_ID

--------------------------------------

  2152% |            | 05cq2hb1r37tr

     7% |            |


--  End of ASH snap 1, end=2010-12-06 19:25:43, seconds=5, samples_taken=42


PL/SQL procedure successfully completed.
There are several things worth mentioning in this listing. To set up the desired conditions we turned on Auto DOP, which also enables Parallel Queuing, and then set the PARALLEL_SERVER_TARGET parameter to a very low number (10) in order to trigger queuing more easily. We then used a shell script (ss.sh) to fire off 20 copies of the avgskew.sql script in rapid succession. Querying V$SQL_MONITOR showed that the statements were indeed queuing. This is an important point. All statements using parallel query will show up in the V$SQL_MONITOR view. If they have a status of QUEUED they are not actually executing but are instead waiting until enough parallel slaves become available. We also queried V$PX_PROCESS_SYSSTAT a few times to see how many parallel slaves were being used. Finally, we ran Tanel Poder's snapper script to see what event the queued statements were waiting on. As you can see, it was the resmgr: pq queued wait event.
![]() Note There is one other thing you should be aware of with regard to the wait events. There is a wait event change that relates to parallel queuing. This example was created using Oracle Database version 11.2.0.2. If you are using 11.2.0.1 you will see a different set of wait events (there are two). The first is
Note There is one other thing you should be aware of with regard to the wait events. There is a wait event change that relates to parallel queuing. This example was created using Oracle Database version 11.2.0.2. If you are using 11.2.0.1 you will see a different set of wait events (there are two). The first is PX Queuing: statement queue. This is the event that a statement waits on when it is next to run. The other is enq: JX - SQL statement queue. This event is what a statement waits on when there are other statements ahead of it in the queue. This scheme seems quite unwieldy, which is probably why it was changed in the later release.
Controlling Parallel Queuing
There are several mechanisms in place for controlling how the Parallel Statement Queuing feature behaves. The basic approach is to use a first-in, first-out queuing mechanism. But there are ways to prioritize work within the queuing framework. It's also possible to completely by-pass the queuing mechanism via a hint. And conversely, it is possible to enable queuing for a statement via a hint even when the parallel Statement Queuing feature is not enabled at the database level. There are also a few parameters that affect the queuing behavior. And finally, Resource Manager has the capability to affect how statements are queued.
Controlling Queuing with Parameters
There are a handful of parameters that affect how Parallel Queuing behaves. The main parameter is PARALLEL_SERVERS_TARGET, which tells Oracle how many parallel server processes to allow before starting to hold statements back in the queue. The default value for this parameter is calculated as follows:
((4 × CPU_count) × parallel_threads_per_cpu) × active_instances
So on an Exadata X2-2 with a database that spans 4 RAC nodes, the default value would be calculated as:
((4 × 12)× 2) × 4 = 384
This calculated value is almost certainly higher than you would want for most mixed workload systems, as it is geared at completely consuming the available CPU resources with parallel query processes. Allowing long-running parallel statements to consume the server completely means that response-sensitive, OLTP-type statements, could suffer. You should also note that it is possible to have more server processes active than the parameter allows. Since the number of slaves assigned to a query may be twice the DOP, the target can occasionally be exceeded.
The second parameter that deserves some discussion is the hidden parameter, _PARALLEL_STATEMENT_QUEUING, which turns the feature on and off. As already discussed in the Auto DOP section, this parameter is set to TRUE when the PARALLEL_DEGREE_POLICY parameter is set to AUTO. However, the hidden parameter can also be set manually to turn Parallel Queuing off and on independently.
Auto DOP calculations are still a little scary. So it's nice that there is a way to turn on the Parallel Queuing feature without enabling Oracle to take complete control of which statements run in parallel. Of course since this involves setting a hidden parameter you should not do this in a production environment without approval from Oracle support. Nevertheless, here's another quick example showing that queuing can be turned on without enabling Auto DOP or In-memory Parallel Execution:
SYS@EXDB1> alter system set parallel_degree_policy=manual;


System altered.


SYS@EXDB1> alter table kso.skew parallel (degree 8);


Table altered.


SYS@EXDB1> @parms

Enter value for parameter: parallel%

Enter value for isset:

Enter value for show_hidden:


NAME                               VALUE                          ISDEFAUL

---------------------------------- ------------------------------ --------

parallel_adaptive_multi_user       FALSE                          TRUE

parallel_automatic_tuning          FALSE                          TRUE

parallel_degree_limit              8                              FALSE

parallel_degree_policy             MANUAL                         FALSE

parallel_execution_message_size    16384                          TRUE

parallel_force_local               TRUE                           FALSE

parallel_instance_group                                           TRUE

parallel_io_cap_enabled            FALSE                          TRUE

parallel_max_servers               320                            TRUE

parallel_min_percent               0                              TRUE

parallel_min_servers               16                             FALSE

parallel_min_time_threshold        2                              TRUE

parallel_server                    TRUE                           TRUE

parallel_server_instances          2                              TRUE
parallel_servers_target            10                             FALSE

parallel_threads_per_cpu           2                              TRUE


16 rows selected.


SYS@EXDB1>  !ss.sh avgskew.sql 20 kso/kso


starting 20 copies of avgskew.sql


SYS@EXDB1> @queued_sql


no rows selected


SYS@EXDB1> @queued_sql


no rows selected


SYS@EXDB1> @check_px


SYS@EXDB1> /


STATISTIC                         VALUE

------------------------------ --------

Servers In Use                       48


1 row selected.


SYS@EXDB1> /


STATISTIC                         VALUE

------------------------------ --------

Servers In Use                       56


1 row selected.


SYS@EXDB1> /


STATISTIC                         VALUE

------------------------------ --------

Servers In Use                       64


1 row selected.


SYS@EXDB1> /


STATISTIC                         VALUE

------------------------------ --------

Servers In Use                       48


1 row selected.
SYS@EXDB1> /


STATISTIC                         VALUE

------------------------------ --------

Servers In Use                       56


1 row selected.


SYS@EXDB1> queued_sql


no rows selected


SYS@EXDB1> -- no queuing, lot's of parallel slaves running

SYS@EXDB1>

SYS@EXDB1> alter system set "_parallel_statement_queuing"=true; -- enable Queuing


System altered.


SYS@EXDB1> !ss.sh avgskew.sql 20 kso/kso


starting 20 copies of avgskew.sql


SYS@EXDB1> @queued_sql


 SID SQL_ID        SQL_EXEC_ID SQL_TEXT

---- ------------- ----------- ----------------------------------------------

 181 05cq2hb1r37tr    16777363 select avg(pk_col) from kso.skew a

                               where col1 > 0

 216                  16777364

  44                  16777365

 273                  16777366

 234                  16777367

 160                  16777368

 100                  16777369

 233                  16777370

  30                  16777371

 138                  16777372

   7                  16777373

 293                  16777374

 137                  16777375

  83                  16777376

 251                  16777377

  66                  16777378

 123                  16777379

 195                  16777380


18 rows selected.


SYS@EXDB1> -- now we have control of which statements are parallelized and we have queuing
This listing shows that you can have Parallel Statement Queuing without turning on Auto DOP. Of course it's using a hidden parameter, so you probably don't want to do this on a production system without discussing it with Oracle Support first.
Controlling Queuing with Hints
There are two hints that can be used to control Parallel Statement Queuing at the statement level. One hint, NO_STATEMENT_QUEUING, allows the queuing process to be completely bypassed, even if the feature is turned on at the instance level. The other hint, STATEMENT_QUEUING, turns on the queuing mechanism, even if the feature is not enabled at the instance level. The STATEMENT_QUEUING hint provides a documented avenue for using the queuing feature without enabling Auto DOP. Here is an example showing how to bypass the queuing by using the NO_STATEMENT_QUEUING hint.
SYS@EXDB1> set echo on

SYS@EXDB1> @test_pxq_hint

SYS@EXDB1> -- this should cause queueing, but the hinted statements

SYS@EXDB1> -- should jump the queue

SYS@EXDB1> alter system set "_parallel_statement_queuing"=true;


System altered.


SYS@EXDB1> alter system set parallel_servers_target=32;


System altered.


SYS@EXDB1> !ss.sh test_pxq_hint1.sql 10 kso/kso


starting 10 copies of test_pxq_hint1.sql


SYS@EXDB1> @queued_sql


  SID SQL_ID        SQL_EXEC_ID SQL_TEXT

----- ------------- ----------- ------------------------------------------------------------

  484 bgcmmcyyyvpg9    16777239 select /*+ parallel (a 16) */ avg(pk_col) from kso.skew3 a

                                where col1 > 0

  774 bgcmmcyyyvpg9    16777240

  584 bgcmmcyyyvpg9    16777241

  199 bgcmmcyyyvpg9    16777242

  679 bgcmmcyyyvpg9    16777243

  391 bgcmmcyyyvpg9    16777244

 1060 bgcmmcyyyvpg9    16777245


7 rows selected.


SYS@EXDB1> !ss.sh test_pxq_hint2.sql 2 kso/kso


starting 2 copies of test_pxq_hint2.sql
SYS@EXDB1> @queued_sql


  SID SQL_ID        SQL_EXEC_ID SQL_TEXT

----- ------------- ----------- ------------------------------------------------------------

  774 bgcmmcyyyvpg9    16777240 select /*+ parallel (a 16) */ avg(pk_col) from kso.skew3 a

                                where col1 > 0

  584 bgcmmcyyyvpg9    16777241

  199 bgcmmcyyyvpg9    16777242

  679 bgcmmcyyyvpg9    16777243

  391 bgcmmcyyyvpg9    16777244

 1060 bgcmmcyyyvpg9    16777245


6 rows selected.


SYS@EXDB1> @as


SID   SQL_ID         CHILD PLAN_HASH_VALUE EXECS   AVG_ETIME SQL_TEXT

----- ------------- ------ --------------- ----- ----------- -------------------------------

    4 5v6grtvwkb836      0      1404581711     2      211.89 select /*+ NO_STATEMENT_QUEUING

 1448 5v6grtvwkb836      0      1404581711     2      211.89 select /*+ NO_STATEMENT_QUEUING

    8 5v6grtvwkb836      0      1404581711     2      211.89 select /*+ NO_STATEMENT_QUEUING

    7 5v6grtvwkb836      0      1404581711     2      211.89 select /*+ NO_STATEMENT_QUEUING

 1446 5v6grtvwkb836      0      1404581711     2      211.89 select /*+ NO_STATEMENT_QUEUING

 1354 5v6grtvwkb836      0      1404581711     2      211.89 select /*+ NO_STATEMENT_QUEUING

 1257 5v6grtvwkb836      0      1404581711     2      211.89 select /*+ NO_STATEMENT_QUEUING

 1253 5v6grtvwkb836      0      1404581711     2      211.89 select /*+ NO_STATEMENT_QUEUING

 1160 5v6grtvwkb836      0      1404581711     2      211.89 select /*+ NO_STATEMENT_QUEUING

 1156 5v6grtvwkb836      0      1404581711     2      211.89 select /*+ NO_STATEMENT_QUEUING

 1065 5v6grtvwkb836      0      1404581711     2      211.89 select /*+ NO_STATEMENT_QUEUING

  969 5v6grtvwkb836      0      1404581711     2      211.89 select /*+ NO_STATEMENT_QUEUING

  201 5v6grtvwkb836      0      1404581711     2      211.89 select /*+ NO_STATEMENT_QUEUING

  297 5v6grtvwkb836      0      1404581711     2      211.89 select /*+ NO_STATEMENT_QUEUING

  393 5v6grtvwkb836      0      1404581711     2      211.89 select /*+ NO_STATEMENT_QUEUING

  394 5v6grtvwkb836      0      1404581711     2      211.89 select /*+ NO_STATEMENT_QUEUING

  486 5v6grtvwkb836      0      1404581711     2      211.89 select /*+ NO_STATEMENT_QUEUING

  488 5v6grtvwkb836      0      1404581711     2      211.89 select /*+ NO_STATEMENT_QUEUING

  585 5v6grtvwkb836      0      1404581711     2      211.89 select /*+ NO_STATEMENT_QUEUING

  586 5v6grtvwkb836      0      1404581711     2      211.89 select /*+ NO_STATEMENT_QUEUING

  778 5v6grtvwkb836      0      1404581711     2      211.89 select /*+ NO_STATEMENT_QUEUING

  868 5v6grtvwkb836      0      1404581711     2      211.89 select /*+ NO_STATEMENT_QUEUING

  869 5v6grtvwkb836      0      1404581711     2      211.89 select /*+ NO_STATEMENT_QUEUING

  872 5v6grtvwkb836      0      1404581711     2      211.89 select /*+ NO_STATEMENT_QUEUING

  965 5v6grtvwkb836      0      1404581711     2      211.89 select /*+ NO_STATEMENT_QUEUING

  967 5v6grtvwkb836      0      1404581711     2      211.89 select /*+ NO_STATEMENT_QUEUING

 1255 bgcmmcyyyvpg9      0      1404581711     4      204.91 select /*+ parallel (a 16) */

  774 bgcmmcyyyvpg9      0      1404581711     4      204.91 select /*+ parallel (a 16) */

  484 bgcmmcyyyvpg9      0      1404581711     4      204.91 select /*+ parallel (a 16) */

  679 bgcmmcyyyvpg9      0      1404581711     4      204.91 select /*+ parallel (a 16) */

  199 bgcmmcyyyvpg9      0      1404581711     4      204.91 select /*+ parallel (a 16) */

  391 bgcmmcyyyvpg9      0      1404581711     4      204.91 select /*+ parallel (a 16) */

 1060 bgcmmcyyyvpg9      0      1404581711     4      204.91 select /*+ parallel (a 16) */
  584 bgcmmcyyyvpg9      0      1404581711     4      204.91 select /*+ parallel (a 16) */

 1157 bgcmmcyyyvpg9      0      1404581711     4      204.91 select /*+ parallel (a 16) */


35 rows selected.
This listing shows that statements using the NO_STATEMENT_QUEUING hint completely bypass the queuing mechanism. The steps we executed were to enable queuing, fire off 10 copies of a select statement that was hinted to use a DOP of 16. These statements were queued as shown by the queued_sql.sql script. We then fired off 2 copies of a statement using the NO_STATEMENT_QUEUING hint. The queued_sql.sql script showed that the new statements were not at the bottom of the queue. In fact, they were not queued at all. They were run immediately. The as.sql script shows active sessions, and as you can see, a side effect of bypassing the queuing is that the number of active slaves can end up being considerably higher than the setting of the PARALLEL_SERVERS_TARGET parameter.
Controlling Queuing with Resource Manager
Oracle's Database Resource Manager (DBRM) provides additional capability to control Parallel Statement Queuing. While a thorough discussion of DBRM is beyond the scope of this chapter, we will cover some specific features related to Parallel Query. Chapter 7 covers DBRM in more detail.
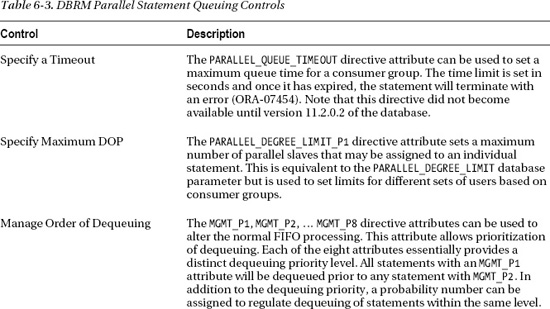
Without DBRM, the parallel statement queue behaves strictly as a first-in, first-out (FIFO) queue. DBRM provides several directive attributes that can be used to provide additional control on a consumer group basis. Many of these controls were introduced in version 11.2.0.2. Table 6-3 contains a list of additional capabilities provided by DBRM.

The DBRM directives can be quite involved. Here is an example from the Oracle® Database VLDB and Partitioning Guide 11g Release 2 (11.2) that shows four directives making use of the Parallel Statement Queuing features.
DBMS_RESOURCE_MANAGER.CREATE_PLAN_DIRECTIVE(

     'REPORTS_PLAN', 'SYS_GROUP', 'Directive for sys activity',

      mgmt_p1 => 100);


DBMS_RESOURCE_MANAGER.CREATE_PLAN_DIRECTIVE(

     'REPORTS_PLAN', 'OTHER_GROUPS', 'Directive for short-running queries',

      mgmt_p2 => 70,

      parallel_degree_limit_p1 => 4,

      switch_time => 60,

      switch_estimate => TRUE,

      switch_for_call => TRUE,

      switch_group => 'MEDIUM_SQL_GROUP'),


   DBMS_RESOURCE_MANAGER.CREATE_PLAN_DIRECTIVE(

     'REPORTS_PLAN', 'MEDIUM_SQL_GROUP', 'Directive for medium-running queries',

      mgmt_p2 => 20,

      parallel_target_percentage => 80,

      switch_time => 900,

      switch_estimate => TRUE,

      switch_for_call => TRUE,

      switch_group => 'LONG_SQL_GROUP'),


   DBMS_RESOURCE_MANAGER.CREATE_PLAN_DIRECTIVE(

     'REPORTS_PLAN', 'LONG_SQL_GROUP', 'Directive for long-running queries',

      mgmt_p2 => 10,

      parallel_target_percentage => 50,

      parallel_queue_timeout => 14400);
This example bears some explanation.
7. The first directive is for sys activity. So sessions in the consumer group SYS_GROUP, will have 100 percent of the highest dequeuing priority (MGMT_P1).
8. The second directive is for short-running queries. This applies to all sessions in the OTHER_GROUPS consumer group (the default consumer group). This directive specifies that Oracle should evaluate each SQL statement and if the estimated execution time is longer than 60 seconds (SWITCH_TIME), the sessions should be switched to the MEDIUM_SQL_GROUP consumer group. By the way, the session switches back to OTHER_GROUPS when the statement is complete because SWITCH_FOR_CALL=>TRUE. The dequeuing priority (MGMT_P2) is set to 70 percent meaning that statements should be dequeued after any MGMT_P1 statements with a probability of 70 percent when compared with other MGMT_P2 statements. Finally, the maximum DOP is set to 4 by the PARALLEL_DEGREE_LIMIT_P1 attribute.
9. The third directive is for medium-running queries. It applies to sessions in the MEDIUM_SQL_GROUP consumer group. This directive also includes a switch causing sessions to be moved to the LONG_SQL_GROUP if Oracle estimates a SQL statement will take longer than 15 minutes. Additionally, this directive sets the dequeuing priority to be 20 percent of the second priority group (MGMT_P2). This directive also puts a limit on the percentage of parallel slaves that may be used (PARALLEL_TARGET_PERCENTAGE). In this case, 80 percent of the total slaves allowed on the system is the maximum that may be used by sessions in this consumer group.
10. The last directive is for long-running queries. It applies to sessions in the LONG_SQL_GROUP consumer group. Sessions in this group have a very low dequeuing priority as compared to the others (MGMT_P2=10). It also limits the percentage of parallel slaves to 50 percent. Finally, since statements in this group may be queued for a long time, the PARALLEL_QUEUE_TIMEOUT attribute has been set to 14,400 seconds. So if a statement is queued for 4 hours, it will fail with a timeout error.
Parallel Statement Queuing Wrap Up
This section has been considerably more detailed than the coverage of the other two new parallel features in 11gR2. That's because this feature is a critical component in allowing Exadata to handle mixed workloads effectively. It enables us to effectively handle a mixture of statements that are sensitive to both throughput and response time. Without this feature it would be very difficult to provide adequate resources without severely compromising one or the other.
In-Memory Parallel Execution
The third new feature of 11gR2 related to parallel operations is probably the least well known. Prior to 11gR2, queries that were parallelized totally ignored the buffer cache. Oracle assumed that parallel queries would only be done on very large tables that would probably never have a large percentage of their blocks in the buffer cache. This assumption led to the conclusion that it would be faster to just read the data from disk. In addition, flooding the buffer cache with a large number of blocks from a full table scan was not desirable and so Oracle developed a mechanism called direct path reads, which bypassed the normal caching mechanism in favor of reading blocks directly in to the user's Program Global Area (PGA).
The In-Memory Parallel Execution feature takes a different approach. It attempts to make use of the buffer cache for parallel queries. The feature is cluster-aware and is designed to spread the data across the cluster nodes (that is, the RAC database servers). The data blocks are also affinitized to a single node, reducing the amount of communication and data transfers between the nodes. The goal, of course, is to speed up the parallel query by eliminating disk I/O. This can be a viable technique because many systems now have very large amounts of memory, which of course can provide a significant speed advantage over disk operations. There are some downsides to this approach though. The biggest disadvantage with regard to Exadata is that all the Smart Scan optimizations are disabled by this feature.
![]() Kevin Says: It is true that In-Memory Parallel Query I/O is buffered in the SGA and remains cached—thus Smart Scan is not involved. This would only be a disadvantage if a query executes faster with Smart Scan than with In-Memory Parallel Query. Comparing the processing dynamic of a query serviced by Smart Scan as opposed to In-Memory Parallel Query is a very complex topic—especially when compressed data is involved. In the same way Smart Scan is able to filter vast amounts of deeply-compressed data (specifically HCC), so is In-Memory Parallel Query. That is, HCC data is filtered in its compressed form regardless of who is doing the filtration. In the case of Smart Scan, however, the data that sifts through filtration must be decompression and sent to the database grid via iDB for data-intensive processing (such as join, sort, or aggregate). With In-Memory Parallel Query there is no data flow over iDB. Furthermore, a table that is accessed frequently by Smart Scan requires the same repetitious physical I/O+filtration+decompression (with the exception of results-cached queries) each time it is accessed. With In-Memory Parallel Query the I/O and iDB effort is eliminated and, as we know, memory is faster than both hard disk and flash. What customers must analyze is whether there are sufficient processor cycles available in the database grid to perform the repetitious filtration and decompression of popular tables. Remember, in the case of Smart Scan that effort is offloaded to the cells. To cap this train of thought, I'll simply say there is no absolute answer in the comparison between In-Memory Parallel Query and Smart Scan. The variables need to be plugged in by the customer using the knowledge gained from reading this book, Oracle documentation and, perhaps, blogs (smiley face).
Kevin Says: It is true that In-Memory Parallel Query I/O is buffered in the SGA and remains cached—thus Smart Scan is not involved. This would only be a disadvantage if a query executes faster with Smart Scan than with In-Memory Parallel Query. Comparing the processing dynamic of a query serviced by Smart Scan as opposed to In-Memory Parallel Query is a very complex topic—especially when compressed data is involved. In the same way Smart Scan is able to filter vast amounts of deeply-compressed data (specifically HCC), so is In-Memory Parallel Query. That is, HCC data is filtered in its compressed form regardless of who is doing the filtration. In the case of Smart Scan, however, the data that sifts through filtration must be decompression and sent to the database grid via iDB for data-intensive processing (such as join, sort, or aggregate). With In-Memory Parallel Query there is no data flow over iDB. Furthermore, a table that is accessed frequently by Smart Scan requires the same repetitious physical I/O+filtration+decompression (with the exception of results-cached queries) each time it is accessed. With In-Memory Parallel Query the I/O and iDB effort is eliminated and, as we know, memory is faster than both hard disk and flash. What customers must analyze is whether there are sufficient processor cycles available in the database grid to perform the repetitious filtration and decompression of popular tables. Remember, in the case of Smart Scan that effort is offloaded to the cells. To cap this train of thought, I'll simply say there is no absolute answer in the comparison between In-Memory Parallel Query and Smart Scan. The variables need to be plugged in by the customer using the knowledge gained from reading this book, Oracle documentation and, perhaps, blogs (smiley face).
Note that we haven't actually seen In-memory Parallel Query in the wild on Exadata, which is probably good, since many of the optimizations built into Exadata rely on Offloading, which depends on direct reads. Of course direct reads will not be done if blocks are being accessed in memory on the database servers. On most platforms, memory access would be much faster than direct reads from disk. But with Exadata, eliminating the disk I/O also eliminates a large number of CPUs that could be applied to filtering and other operations. This means that accessing the buffer cache for parallel execution could actually be less efficient than allowing the storage servers to participate in the execution of the SQL statement.
A little demonstration is probably in order at this point. It's worth noting that getting this feature to kick in at all takes quite a bit of effort. Here are the basic steps we had to take in order to get it to work. First we had to find a query that the optimizer estimated would run for longer than the number of seconds specified by the PARALLEL_MIN_TIME_THRESHOLD parameter (assuming the statement wasn't parallelized). The default for this parameter is AUTO, meaning 10 seconds. We set this parameter to 3 seconds to make it easier to trigger the In-memory Parallel behavior. This query also had to be on a table that would almost completely fit in the aggregate buffer cache provided by the combination of all the participating RAC instances. To simplify things, we limited the processing to a single instance by setting the PARALLEL_FORCE_LOCAL parameter to TRUE. Of course we had to set PARALLEL_DEGREE_POLICY to AUTO to enable the feature. We also set very low values for PARALLEL_SERVERS_TARGET and PARALLEL_DEGREE_LIMIT. Here are the parameter settings and pertinent information about the query we used to test the feature:
SYS@EXDB1> @parms

Enter value for parameter: parallel

Enter value for isset:

Enter value for show_hidden:


NAME                                     VALUE                ISDEFAUL

---------------------------------------- -------------------- --------

fast_start_parallel_rollback             LOW                  TRUE

parallel_adaptive_multi_user             FALSE                TRUE

parallel_automatic_tuning                FALSE                TRUE

parallel_degree_limit                    8                    FALSE

parallel_degree_policy                   AUTO                 FALSE

parallel_execution_message_size          16384                TRUE

parallel_force_local                     TRUE                 FALSE

parallel_instance_group                                       TRUE

parallel_io_cap_enabled                  FALSE                TRUE

parallel_max_servers                     320                  TRUE

parallel_min_percent                     0                    TRUE

parallel_min_servers                     16                   FALSE

parallel_min_time_threshold              3                    FALSE

parallel_server                          TRUE                 TRUE

parallel_server_instances                2                    TRUE

parallel_servers_target                  8                    FALSE

parallel_threads_per_cpu                 2                    TRUE

recovery_parallelism                     0                    TRUE


18 rows selected.


SYS@EXDB1> @pool_mem


AREA                                 MEGS

------------------------------ ----------

free memory                         562.5

fixed_sga                             2.1

log_buffer                            7.5

shared pool                         557.4

large pool                           48.1

buffer_cache                      3,808.0

                               ----------

sum                               4,985.6


6 rows selected.


SYS@EXDB1> @table_size
Enter value for owner: KSO

Enter value for table_name: SKEW

Enter value for type:


OWNER                SEGMENT_NAME         TYPE               TOTALSIZE_MEGS

-------------------- -------------------- ------------------ --------------

KSO                  SKEW                 TABLE                     2,560.0

                                                             --------------

sum                                                                 2,560.0


1 row selected.


SYS@EXDB1> @dba_tables

Enter value for owner: KSO

Enter value for table_name: SKEW


OWNER   TABLE_NAME    STATUS   LAST_ANAL   NUM_ROWS     BLOCKS DEGREE

------- ------------- -------- --------- ---------- ---------- ------

KSO     SKEW          VALID    18-SEP-10   32000004     162294      1


1 row selected.
So the buffer cache on this instance is about 3.8G, the table is about 2.5 G. The query we used is simple and will not benefit from storage indexes, as virtually all the records satisfy the single WHERE clause.
SYS@EXDB1> !cat avgskew.sql

select avg(pk_col) from kso.skew a where col1 > 0

/


SYS@EXDB1> select count(*) from kso.skew;


  COUNT(*)

----------

  32000004


1 row selected.


SYS@EXDB1> select count(*) from kso.skew where col1 > 0;


  COUNT(*)

----------

  32000000


1 row selected.


SYS@EXDB1> select 32000000/32000004 from dual;


32000000/32000004

-----------------

       .999999875


1 row selected.
Now we'll show some statistics before and after executing the statement. You'll be able to see that while the physical reads statistic does not increase, the logical reads statistic shows a large increase. Note that we've done a quick calculation of the total number of logical reads by selecting from dual, and that the number of logical reads (162,715) is very close to the number of blocks that the table occupies as reported by DBA_TABLES.
SYS@EXDB1> @flush_pool


System altered.


SYS@EXDB1> @mystats

Enter value for name: reads


NAME                                                                  VALUE

---------------------------------------------------------------- ----------

cold recycle reads                                                        0

data blocks consistent reads - undo records applied                       0

lob reads                                                                 0
physical reads                                                      4706178

physical reads cache                                                     30

physical reads cache prefetch                                             0

physical reads direct                                               4706148

physical reads direct (lob)                                               0

physical reads direct temporary tablespace                                0

physical reads for flashback new                                          0

physical reads prefetch warmup                                            0

physical reads retry corrupt                                              0

recovery array reads                                                      0

session logical reads                                               7152779

transaction tables consistent reads - undo records applied                0


15 rows selected.


SYS@EXDB1> set timing on

SYS@EXDB1> @avgskew


AVG(PK_COL)

-----------

 16093750.8


1 row selected.


Elapsed: 00:00:00.72

SYS@EXDB1> set timing off

SYS@EXDB1> @mystats

Enter value for name: reads


NAME                                                                  VALUE

-------------------------------------------------------------- ------------

cold recycle reads                                                        0

data blocks consistent reads - undo records applied                       0

lob reads                                                                 0

physical reads                                                      4706178

physical reads cache                                                     30

physical reads cache prefetch                                             0

physical reads direct                                               4706148

physical reads direct (lob)                                               0

physical reads direct temporary tablespace                                0

physical reads for flashback new                                          0

physical reads prefetch warmup                                            0

physical reads retry corrupt                                              0

recovery array reads                                                      0

session logical reads                                               7315494

transaction tables consistent reads - undo records applied                0


15 rows selected.


SYS@EXDB1> select 7315494-7152779 from dual;


7315494-7152779

---------------

         162715


1 row selected.


SYS@EXDB1> @dplan

Enter value for sql_id: 05cq2hb1r37tr

Enter value for child_no:


PLAN_TABLE_OUTPUT

------------------------------------------------------------------------------------------

SQL_ID  05cq2hb1r37tr, child number 1

-------------------------------------

select avg(pk_col) from kso.skew a where col1 > 0


Plan hash value: 578366071


------------------------------------------------------------------------------------------

| Id  | Operation                      | Name     | Rows | Bytes | Cost (%CPU)| Time     |

------------------------------------------------------------------------------------------

|   0 | SELECT STATEMENT               |          |      |       |  6139 (100)|          |

|   1 |  SORT AGGREGATE                |          |    1 |    11 |            |          |

|   2 |   PX COORDINATOR               |          |      |       |            |          |

|   3 |    PX SEND QC (RANDOM)         | :TQ10000 |    1 |    11 |            |          |

|   4 |     SORT AGGREGATE             |          |    1 |    11 |            |          |

|   5 |      PX BLOCK ITERATOR         |          |   32M|   335M|  6139   (1)| 00:01:14 |

|*  6 |       TABLE ACCESS STORAGE FULL| SKEW     |   32M|   335M|  6139   (1)| 00:01:14 |

------------------------------------------------------------------------------------------


Predicate Information (identified by operation id):

---------------------------------------------------


   6 - storage(:Z>=:Z AND :Z<=:Z AND "COL1">0)

       filter("COL1">0)
Note

-----

automatic DOP: Computed Degree of Parallelism is 8


SYS@EXDB1> @fsx2

Enter value for sql_text: %skew%

Enter value for sql_id:


SQL_ID         AVG_ETIME  PX OFFLOAD IO_SAVED% SQL_TEXT

------------- ---------- --- ------- --------- ------------------------------

05cq2hb1r37tr        .47   8 No            .00 select avg(pk_col) from

                                               kso.skew a where col1 > 0


1 rows selected.
So as you can see, the statement was executed in parallel with eight slaves (the PX column in the fsx.sql script output). Note also that the fsx.sql script reports an estimated value for the AVG_ETIME column when parallel slaves are used. This occurs because v$sql reports elapsed time as the sum of the all the elapsed times of the slave processes. Dividing this number by the number of slaves gives an estimate, but that will not be totally accurate as slaves can vary greatly in their elapsed times. If you look back in the listing you'll see that the actual elapsed time of avgskew.sql was 0.72 seconds instead of the estimated average provided by the fsx.sql script (0.47 seconds). Nevertheless, it is a useful metric when comparing between two statements.
Let's now compare our In-memory Parallel Execution to how our system behaves when In-memory Parallel Execution is not in play. We can disable this feature in a couple of ways. The documented way is to set the PARALLEL_DEGREE_POLICY parameter to MANUAL. However, this also disables Auto DOP and Parallel Statement Queuing. The other way is to set the hidden parameter _PARALLEL_CLUSTER_CACHE_POLICY to ADAPTIVE.
SYS@EXDB1> alter system set "_parallel_cluster_cache_policy"=adaptive;


System altered.


SYS@EXDB1> @mystats

Enter value for name: reads


NAME                                                                   VALUE

------------------------------------------------------------ ---------------

cold recycle reads                                                         0

data blocks consistent reads - undo records applied                        0

lob reads                                                                  0

physical reads                                                       5193061

physical reads cache                                                      31

physical reads cache prefetch                                              0

physical reads direct                                                5193030

physical reads direct (lob)                                                0

physical reads direct temporary tablespace                                 0

physical reads for flashback new                                           0

physical reads prefetch warmup                                             0

physical reads retry corrupt                                               0

recovery array reads                                                       0

session logical reads                                                8133835
transaction tables consistent reads - undo records applied                 0


15 rows selected.


SYS@EXDB1> set timing on

SYS@EXDB1> @avgskew


AVG(PK_COL)

-----------

 16093750.8


1 row selected.


Elapsed: 00:00:00.79

SYS@EXDB1> set timing off

SYS@EXDB1> @mystats

Enter value for name: reads


NAME                                                                   VALUE

------------------------------------------------------------ ---------------

cold recycle reads                                                         0

data blocks consistent reads - undo records applied                        0

lob reads                                                                  0

physical reads                                                       5355355

physical reads cache                                                      31

physical reads cache prefetch                                              0

physical reads direct                                                5355324

physical reads direct (lob)                                                0

physical reads direct temporary tablespace                                 0

physical reads for flashback new                                           0

physical reads prefetch warmup                                             0

physical reads retry corrupt                                               0

recovery array reads                                                       0

session logical reads                                                8296342

transaction tables consistent reads - undo records applied                 0


15 rows selected.


SYS@EXDB1> select 5355355-5193061 from dual;


5355355-5193061

---------------

         162294


1 row selected.


SYS@EXDB1> @fsx2

Enter value for sql_text: %skew%

Enter value for sql_id:
SQL_ID         AVG_ETIME  PX OFFLOAD IO_SAVED% SQL_TEXT

------------- ---------- --- ------- --------- ------------------------------

05cq2hb1r37tr        .47   8 No            .00 select avg(pk_col) from

                                               kso.skew a where col1 > 0

05cq2hb1r37tr        .58   8 Yes         59.82 select avg(pk_col) from

                                               kso.skew a where col1 > 0


2 rows selected.
Notice that with In-memory Parallel Execution disabled, the statistics show that the number of physical reads increased by roughly the number of blocks in the table, as expected. Notice also that the fsx.sql script shows that there is now a new cursor in the shared pool that was executed with eight parallel slaves, but that was offloaded to the storage tier. This is an important point. In-memory Parallel Execution disables the optimizations that Exadata provides via Smart Scans. That should be obvious since the disk I/O was eliminated by the In-memory Parallel Execution feature, but it is the main reason that we believe this feature will not be as useful on the Exadata platform as on other platforms.
As a final demonstration, we'll show a very selective query that benefits more from Offloading than it does from In-memory Parallel Execution.
SYS@EXDB1> @parms

Enter value for parameter: para%cache

Enter value for isset:

Enter value for show_hidden: Y


NAME                                     VALUE                ISDEFAUL

---------------------------------------- -------------------- --------

_parallel_cluster_cache_pct              80                   TRUE

_parallel_cluster_cache_policy           ADAPTIVE             TRUE


2 rows selected.


SYS@EXDB1> -- In-memory Paraellel Execution is off

SYS@EXDB1>

SYS@EXDB1> @flush_pool


System altered.


SYS@EXDB1> set timing on

SYS@EXDB1> select count(*) from kso.skew where col1 is null;


  COUNT(*)

----------

         4


1 row selected.


Elapsed: 00:00:00.26
SYS@EXDB1> alter system set "_parallel_cluster_cache_policy"=cached;


System altered.


Elapsed: 00:00:00.01

SYS@EXDB1> select count(*) from kso.skew where col1 is null;


  COUNT(*)

----------

         4


1 row selected.


Elapsed: 00:00:00.84

SYS@EXDB1> set timing off

SYS@EXDB1> @fsx2

Enter value for sql_text: %skew%

Enter value for sql_id:


SQL_ID         AVG_ETIME  PX OFFLOAD IO_SAVED% SQL_TEXT

------------- ---------- --- ------- --------- ------------------------------

4rz0gjuwr9jyq        .14   8 Yes        100.00 select count(*) from kso.skew

                                               where col1 is null

4rz0gjuwr9jyq        .72   8 No            .00 select count(*) from kso.skew

                                               where col1 is null


2 rows selected.
In this case, Offloading was more effective (faster) than using In-memory Parallel Execution, primarily because Storage Indexes were able to eliminate an extremely large percentage of the disk I/O. So the comparison came down to reading about 2.5 Gigabytes from the buffer cache on the database server vs. reading the Storage Indexes and a handful of blocks off disk. Granted this is a very simple contrived example, but it illustrates the point that there may be cases where Smart Scan is faster than In-memory Parallel Query.
Summary
Parallel execution of statements is important for maximizing throughput on the Exadata platform. Oracle database 11g Release 2 includes several new features that make the parallel execution a more controllable feature. This is especially important when using the platform with mixed workloads. The new Auto DOP feature is designed to allow intelligent decisions about DOP to be made automatically based on individual statements. In-memory Parallel Execution may not be as useful on Exadata platforms as it is on non-Exadata platforms, because it disables the optimizations that come along with Smart Scans. Of the three new features, Parallel Statement Queuing is the most useful as it allows a mixture of throughput-oriented work to co-exist with response-time–sensitive work. Integration with Oracle Resource Manager further enhances the feature by providing a great deal of additional control over the queuing.