
C H A P T E R 5
Exadata Smart Flash Cache
The marketing guys at Oracle must like the term “smart.” They have applied it to a dozen or so different features on the Exadata platform. They also seem to like the term “flash,” which is associated with at least a half dozen features as well. To add to the confusion, there are two features in Oracle Database 11g Release 2 that have almost exactly the same names, Database Smart Flash Cache (DBFC) and Exadata Smart Flash Cache (ESFC). While both features make use of flash-based memory devices, they are very different. This chapter is focused on ESFC so we'll only mention DBFC in passing.
Cleary, one of the goals with Exadata V2 (and now X2) was to expand Exadata capabilities to improve its performance with OLTP workloads. ESFC was the key component that was added to the V2 configuration to accomplish this goal. The addition provides over 5TB of cache in a full rack. It's important to understand that this cache is managed by Oracle software that is aware of how the data is being used by the databases that the storage is supporting. Oracle has been working on software for effectively managing database caches for over 30 years. Since the storage software knows what the database is asking for, it has a much better idea of what should and shouldn't be cached than a conventional storage array.
DBFC vs. ESFC
Hardware
Each Exadata storage server has 4 Sun Flash Accelerator F20 PCIe cards. Each card holds 96G for a total of 384G on each storage server. These are the numbers that you normally see quoted in the specifications although the amount that's available for use is slightly less. The cards are actually made up of 4 solid-state flash modules (FMods), sometimes called disk on modules (DOMs). Each of the modules contain eight 4GB SLC NAND components. So each of the 4 FMods has 32GB of storage, of which 24GB is addressable. With 4 FMods on each of the 4 cards you have 16 of these modules in each storage server. The modules are presented to the O/S separately. Each module reserves an additional 1.125G of its addressable space for its own purposes, yielding a usable space of 22.875G per module. This yields a total of 366G of usable flash storage per storage cell. That's over a terabyte (TB) on the smallest quarter rack configuration and over 5 TB on a full rack.
The F20 cards also include an energy storage module (ESM), sometimes also referred to as a Super Capacitor. You can think of it as a battery, although it actually uses a capacitor, whereas a traditional battery relies on chemical reactions. At any rate, the purpose of the ESM is to provide enough power to flush any data in its volatile memory to the nonvolatile flash memory in the case of a sudden power loss. The volatile memory consists of 64M of DRAM per FMod and is used to buffer writes to the nonvolatile flash memory. You should note that if the ESM fails, writes will by-pass the DRAM and be sent directly to the flash memory. As a result, write speeds will be significantly decreased in the case of ESM failure. This doesn't present a major issue when the cards are configured as ESFC, since the Oracle storage software treats the ESFC as a write-through cache and therefore writes directly to disk, bypassing the cache. It can be an issue though if the cards are used as Flash Disks. Sun recommends that the ESM modules be replaced every two years as the stored energy degrades over time (like a battery). The ILOM system management firmware monitors ESM usage and issues warnings as the ESM approaches the end of its lifespan. See the Sun Flash Accelerator F20 PCIe Card User's Guide for further details.
According to the Sun documentation, the storage servers allow PCIe cards to be replaced while the system is running. However, the Oracle Exadata Storage Software User's Guide recommends powering down the storage servers before replacing one of these cards. Fortunately, you can accomplish this without experiencing an outage, as ASM redundancy allows entire storage cells to be offline without affecting the databases they are supporting. Note that replacing one of the F20 cards should not require any reconfiguration. Figure 5-1 shows a conceptual diagram of one of the Flash Accelerator cards.
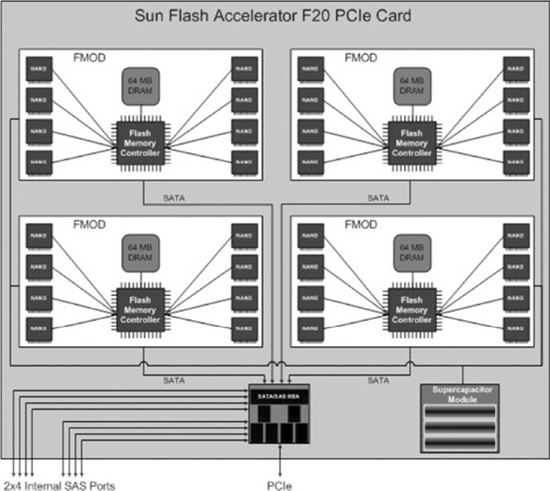
Figure 5-1. Conceptual diagram of the Sun F20 PCIe Flash Card
Cache vs. Flash Disk
The flash memory on the storage servers can be used in two ways. It can be configured as a large disk cache (ESFC), or it can be carved up and presented as solid-state disks (which can be used by ASM for database storage). These two modes are not mutually exclusive. The flash memory can be allocated to either format in whatever percentages are desired. The recommended configuration is to use all the flash memory as cache. This configuration significantly speeds up random access reads. However, it provides no direct benefit to write speeds.
In many systems the approach of allocating all flash memory as cache works very well. However, for systems that are very write-intensive, it may be beneficial to use some of the flash memory as a disk. Keep in mind that depending on the ASM redundancy level used (Normal or High), choosing this option will consume 2 or 3 times the amount of flash storage that the objects actually occupy. This fact alone makes the option less palatable. Also keep in mind that writes to data files are done in the background by the DBWR processes. So choosing to use part of the flash based storage as a disk may not provide as much benefit as you might hope. Fortunately it's pretty easy to reallocate flash storage, so testing your specific situation should not prove too difficult. However, since this chapter focuses on the Exadata Smart Flash Cache feature, we will only briefly cover using the F20's as flash disks.
![]() Note A common misconception is that putting online redo logs on flash storage will significantly speed up writes to redo logs and thus increase the throughput of high-transaction systems. While it's true that small random writes are faster on SSD-based storage than on traditional disks, writes to redo logs on high-transaction systems generally do not fall into that bucket and actually do not benefit that much from being stored on SSD storage. In addition, SSD write mechanics cause a lot of variability in individual write times. There may be individual writes that take orders of magnitude longer than the average. This can cause problems on very busy systems as well. So, before you put your online redo logs on to your valuable Exadata Flash storage, you should test to make sure that the benefits outweigh the costs.
Note A common misconception is that putting online redo logs on flash storage will significantly speed up writes to redo logs and thus increase the throughput of high-transaction systems. While it's true that small random writes are faster on SSD-based storage than on traditional disks, writes to redo logs on high-transaction systems generally do not fall into that bucket and actually do not benefit that much from being stored on SSD storage. In addition, SSD write mechanics cause a lot of variability in individual write times. There may be individual writes that take orders of magnitude longer than the average. This can cause problems on very busy systems as well. So, before you put your online redo logs on to your valuable Exadata Flash storage, you should test to make sure that the benefits outweigh the costs.
Using Flash Memory as Cache
A very simplified description of how a disk cache works goes something like this. When a read request comes in, the I/O subsystem checks the cache to see if the requested data exists in cache. If the data is in the cache, it is returned to the requesting process. If the requested data doesn't reside in the cache, it is read from disk and returned to the requesting process. In the case of uncached data, the data is later copied to the cache (after it is returned to the requesting process). This is done to ensure that the cache doesn't slow down the I/O for the requesting process.
With Exadata, disk caching is not quite as simple as the general case we just described. In an effort to maximize the potential throughput, the cellsrv program may actually fire off async I/O requests to both the disk and the flash cache. Generally speaking, if the requested data is in the cache, the requests will be fulfilled by the flash cache before the disk reads will be able to complete. However, when the system is heavily loaded, it is possible for some requests to be fulfilled by the flash cache while others are fulfilled by the disks. This two-pronged attack effectively increases the amount of throughput that the system can deliver.
![]() Kevin Says: “The hardware upon which Exadata Storage Server is based offers five high-bandwidth PCI slots for storage attachment. Without attacking both Flash and Hard Disk assets in parallel, each cell would be limited to roughly 1.8 GB/s scan throughput. With
Kevin Says: “The hardware upon which Exadata Storage Server is based offers five high-bandwidth PCI slots for storage attachment. Without attacking both Flash and Hard Disk assets in parallel, each cell would be limited to roughly 1.8 GB/s scan throughput. With cellsrv scanning both Flash and Hard Disk concurrently, the scan throughput increases to roughly 4.8 GB/s.
Figure 5-2 shows the I/O path of reads using Oracle's ESFC.
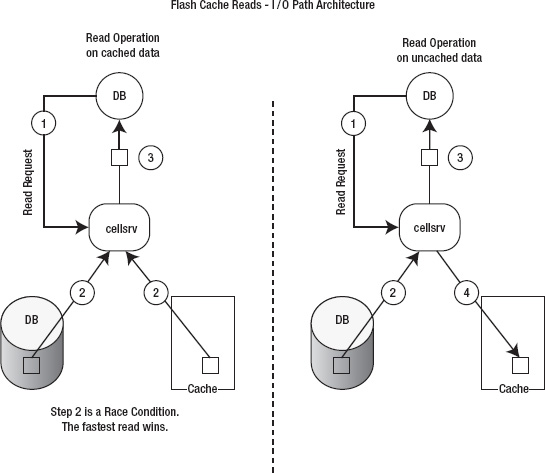
Figure 5-2. Conceptual model of read operation I/O path
Since ESFC is a write-through cache, writes bypass the cache and go directly to disk. However, after sending an acknowledgement back to the database server, Oracle's storage software then copies the data into the cache, assuming it is suitable for caching. This is a key point. The metadata that is sent with the write request lets the storage software know if the data is likely to be used again and if so, the data is also written to the cache. This step is done after sending an acknowledgement to the database tier in order to ensure that the write operation can complete as quickly as possible.
Figure 5-3 shows the I/O path of writes using Oracle's ESFC.
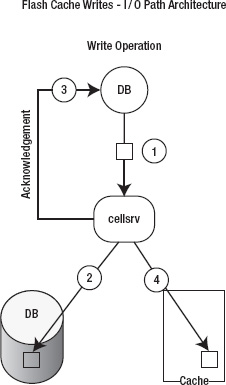
Figure 5-3. Conceptual model of write operation I/O path
As you might guess, Smart Scans generally ignore the ESFC and read directly from disk. However, if the object being scanned has been designated for preferential caching (by setting the storage clause attribute CELL_FLASH_CACHE to KEEP), then even Smart Scans will attempt to read from flash cache. The following example demonstrates this behavior.
SYS@EXDB1> @mystats

Enter value for name: cell flash%


NAME                                                                 VALUE

---------------------------------------------------------- ---------------

cell flash cache read hits                                            3570


Elapsed: 00:00:00.01

SYS@EXDB1> alter table kso.skew3 storage (cell_flash_cache keep);


Table altered.


Elapsed: 00:00:00.01

SYS@EXDB1> select avg(pk_col) from kso.skew3 where col1 > 1;


AVG(PK_COL)

-----------

 16053318.5
Elapsed: 00:00:34.35

SYS@EXDB1> @mystats

Enter value for name: cell flash%


NAME                                                                 VALUE

---------------------------------------------------------- ---------------

cell flash cache read hits                                            3571


Elapsed: 00:00:00.01

SYS@EXDB1> -- nothing in the flash cache the first time, try again

SYS@EXDB1>

SYS@EXDB1> select avg(pk_col) from kso.skew3 where col1 > 1;


AVG(PK_COL)

-----------

 16053318.5


Elapsed: 00:00:27.82   notice that the elapsed time is somewhat faster

SYS@EXDB1> @mystats

Enter value for name: cell flash%


NAME                                                                 VALUE

---------------------------------------------------------- ---------------

cell flash cache read hits                                           24401


Elapsed: 00:00:00.01

SYS@EXDB1> alter table kso.skew3 storage (cell_flash_cache default);


Table altered.


Elapsed: 00:00:00.05

SYS@EXDB1> select avg(pk_col) from kso.skew3 where col1 > 1;


AVG(PK_COL)

-----------

 16053318.5


Elapsed: 00:00:31.54

SYS@EXDB1> @mystats

Enter value for name: cell flash%


NAME                                                                 VALUE

---------------------------------------------------------- ---------------

cell flash cache read hits                                           24401


Elapsed: 00:00:00.00

SYS@EXDB1>

SYS@EXDB1> alter table kso.skew3 storage (cell_flash_cache keep);


Table altered.


Elapsed: 00:00:00.01
SYS@EXDB1> select avg(pk_col) from kso.skew3 where col1 > 1;


AVG(PK_COL)

-----------

 16053318.5


Elapsed: 00:00:27.90

SYS@EXDB1> @mystats

Enter value for name: cell flash%


NAME                                                                 VALUE

---------------------------------------------------------- ---------------

cell flash cache read hits                                           45225


Elapsed: 00:00:00.01
In the preceding example you can see that the Smart Scan is faster when the CELL_FLASH_CACHE storage clause attribute is set to KEEP and more importantly, that a large number of “cell flash cache read hits” are generated in that case. When the CELL_FLASH_CACHE attribute is set to DEFAULT, the query is slower and no “cell flash cache read hits” are generated.
How ESFC is Created
Storage configuration is covered in detail in Chapter 8, but the basic commands for creating and managing flash cache will be covered briefly in this section as well. The cache is created and managed using the cellcli utility on each storage server (the cellcli command syntax is covered in detail in Appendix A). Alternatively, the dcli utility, which replicates commands across multiple storage cells, can be used. The command to create the cache is CREATE FLASHCACHE. Here's an example.
CellCLI> create flashcache all size=300g


Flash cache cell03_FLASHCACHE successfully created
This form of the command tells the storage software to spread the cache across all the FMods on all the flash cards. In this case, the size parameter was used to specify that the entire cache should occupy only 300G, leaving roughly 65G available for use as a flash disk. To use all available space for flash cache, simply leave off the size parameter.
CellCLI> create flashcache all


Flash cache cell03_FLASHCACHE successfully created
This command uses all available storage on all available flash cards. Note that the flash cache is automatically assigned a name that includes the name of the storage cell. To see the size of the flashcache you can issue the LIST FLASHCACHE DETAIL command:
CellCLI> list flashcache detail

         name:                   cell03_FLASHCACHE

         cellDisk: FD_15_cell03,FD_02_cell03,FD_14_cell03,FD_10_cell03,FD_01_cell03,

FD_13_cell03,FD_12_cell03,FD_08_cell03,FD_07_cell03,FD_11_cell03,FD_09_cell03,FD_05_cell03,

FD_06_cell03,FD_04_cell03,FD_03_cell03,FD_00_cell03

         creationTime:           2010-11-07T19:45:32-06:00

         degradedCelldisks:
         effectiveCacheSize:     300G

         id:                     80a40cc9-371c-4c9f-85bf-ffbe580976c1

         size:                   300G

         status:                 normal
Notice that the flash cache is spread across 16 cell disks. There is one cell disk for each FMod on each flash card. To get more information about the cell disks that make up the flash cache, you can use the LIST CELLDISK command, shown here:
CellCLI> list celldisk attributes name, diskType, size where name like 'FD.*'

         FD_00_cell03    FlashDisk       22.875G

         FD_01_cell03    FlashDisk       22.875G

         FD_02_cell03    FlashDisk       22.875G

         FD_03_cell03    FlashDisk       22.875G

         FD_04_cell03    FlashDisk       22.875G

         FD_05_cell03    FlashDisk       22.875G

         FD_06_cell03    FlashDisk       22.875G

         FD_07_cell03    FlashDisk       22.875G

         FD_08_cell03    FlashDisk       22.875G

         FD_09_cell03    FlashDisk       22.875G

         FD_10_cell03    FlashDisk       22.875G

         FD_11_cell03    FlashDisk       22.875G

         FD_12_cell03    FlashDisk       22.875G

         FD_13_cell03    FlashDisk       22.875G

         FD_14_cell03    FlashDisk       22.875G

         FD_15_cell03    FlashDisk       22.875G
Since the flash cache sits on top of cell disks, the cell disks must be created before the flash cache. This can be done with the CREATE CELLDISK command:
CellCLI> create celldisk all flashdisk

CellDisk FD_00_cell03 successfully created

CellDisk FD_01_cell03 successfully created

CellDisk FD_02_cell03 successfully created

CellDisk FD_03_cell03 successfully created

CellDisk FD_04_cell03 successfully created

CellDisk FD_05_cell03 successfully created

CellDisk FD_06_cell03 successfully created

CellDisk FD_07_cell03 successfully created

CellDisk FD_08_cell03 successfully created

CellDisk FD_09_cell03 successfully created

CellDisk FD_10_cell03 successfully created

CellDisk FD_11_cell03 successfully created

CellDisk FD_12_cell03 successfully created

CellDisk FD_13_cell03 successfully created

CellDisk FD_14_cell03 successfully created

CellDisk FD_15_cell03 successfully created
You can also create a flash cache on a limited set of FMods by specifying a specific list of cell disks. In most cases this is not done, but it is possible. Here's an example:
CellCLI> create flashcache celldisk='FD_00_cell03, FD_01_cell03', size=40G

Flash cache cell03_FLASHCACHE successfully created
CellCLI> list flashcache detail

         name:                   cell03_FLASHCACHE

         cellDisk:               FD_01_cell03,FD_00_cell03

         creationTime:           2010-11-09T15:29:28-06:00

         degradedCelldisks:

         effectiveCacheSize:     40G

         id:                     ad56aa9d-0de4-4713-85f2-197134523ebb

         size:                   40G

         status:                 normal
Once again, using cellcli to manage storage including flash cache is covered in more detail in Chapter 8, but this section should give you a basic understanding of how the flash cache is created.
Controlling ESFC Usage
Generally speaking, objects will be cached in the ESFC based on the storage software's automatic caching policy. However, you can override the automatic policy for individual database objects by using the CELL_FLASH_CACHE storage clause attribute. The attribute has three valid values:
NONE: Never cache this object.
DEFAULT: The Automatic caching mechanism is in effect. This is the default value.
KEEP: The object should be given preferential status. Note that this designation also changes the default behavior of Smart Scans, allowing them to read from both the cache and disk.
You can specify the storage clause when an object is created. Some options of the storage clause can be modified using the ALTER command as well. Here's an example of changing the CELL_FLASH_CACHE storage clause using the ALTER command.
alter table kso.skew storage (cell_flash_cache keep);
You can also see whether objects have been designated for more aggressive caching by looking at the cell_flash_cache column of dba_tables or dba_indexes:
SYS@EXDB1> @esfc_keep_tables

SYS@EXDB1> select owner, table_name, status, last_analyzed,

  2  num_rows, blocks, degree, cell_flash_cache

  3  from dba_tables

  4  where cell_flash_cache like nvl('&cell_flash_cache','KEEP')

  5  /

Enter value for cell_flash_cache:


OWNER TABLE_NAME STATUS LAST_ANAL  NUM_ROWS  BLOCKS DEGREE CELL_FLASH_CACHE

----- ---------- ------ --------- --------- ------- ------ ----------------

KSO   SKEW       VALID  18-SEP-10  32000004  162294      1 KEEP

KSO   SKEW3      VALID  14-OCT-10 384000048 1949727      1 KEEP
Monitoring
Your options for monitoring ESFC are limited on the database servers. There is only one statistic related to ESFC in v$sysstat and related views (cell flash cache read hits). The storage servers, however, provide a much larger array of diagnostic information via the cellcli utility. Unfortunately, since these metrics are provided by cellcli on individual storage cells, they are limited to that single storage server. There is no comprehensive set of diagnostic information that covers the entire storage grid at this point.
At the Storage Layer
There are a number of statistics that are captured for ESFC usage at the storage cell layer. The cellcli utility allows us to view those metrics. The LIST METRICDEFINITION command provides a description of the various statistics that are collected. For example:
CellCLI> LIST METRICDEFINITION attributes name, description WHERE objectType = 'FLASHCACHE'
Table 5-1 shows the output of the command. The table provides a brief description for each statistic tracked at the storage layer that you can report on.
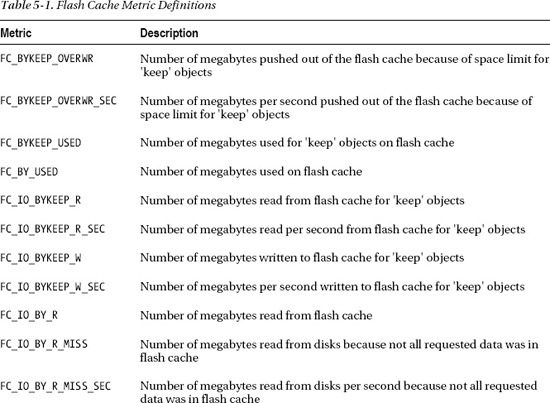
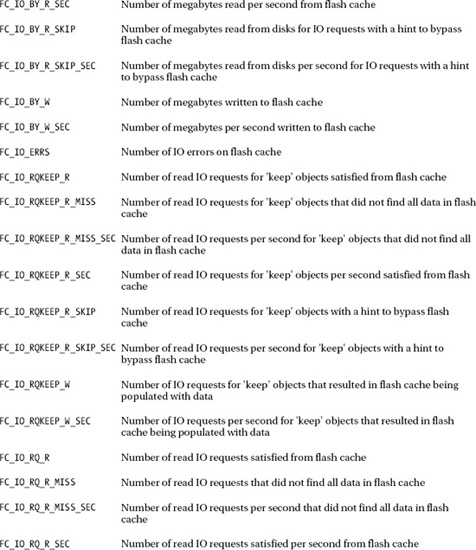
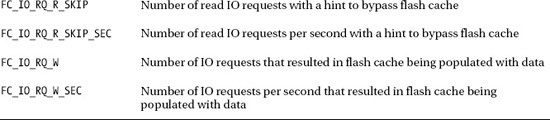
The metrics in Table 5-1 are cumulative since cellsrv was started. The LIST METRICCURRENT command shows the current values of the metrics for a single storage cell. Following are examples of a couple of cellcli commands showing first all flash cache-related metrics and then only the flash cache metrics that are related to objects designated for aggressive caching (that is, objects whose storage clause specifies CELL_FLASH_CACHE=KEEP).
CellCLI> LIST METRICCURRENT WHERE objectType = 'FLASHCACHE'

         FC_BYKEEP_OVERWR          FLASHCACHE      0.0 MB

         FC_BYKEEP_OVERWR_SEC      FLASHCACHE      0.0 MB/sec

         FC_BYKEEP_USED            FLASHCACHE      5,072 MB

         FC_BY_USED                FLASHCACHE      5,434 MB

         FC_IO_BYKEEP_R            FLASHCACHE      80,288 MB

         FC_IO_BYKEEP_R_SEC        FLASHCACHE      0.0 MB/sec

         FC_IO_BYKEEP_W            FLASHCACHE      11,134 MB

         FC_IO_BYKEEP_W_SEC        FLASHCACHE      0.0 MB/sec

         FC_IO_BY_R                FLASHCACHE      3,512,908 MB

         FC_IO_BY_R_MISS           FLASHCACHE      944,942 MB

         FC_IO_BY_R_MISS_SEC       FLASHCACHE      0.0 MB/sec

         FC_IO_BY_R_SEC            FLASHCACHE      0.0 MB/sec

         FC_IO_BY_R_SKIP           FLASHCACHE      11,224,781 MB

         FC_IO_BY_R_SKIP_SEC       FLASHCACHE      0.3 MB/sec

         FC_IO_BY_W                FLASHCACHE      3,547,430 MB

         FC_IO_BY_W_SEC            FLASHCACHE      0.4 MB/sec

         FC_IO_ERRS                FLASHCACHE      0

         FC_IO_RQKEEP_R            FLASHCACHE      91,231 IO requests

         FC_IO_RQKEEP_R_MISS       FLASHCACHE      11,155 IO requests

         FC_IO_RQKEEP_R_MISS_SEC   FLASHCACHE      0.0 IO/sec

         FC_IO_RQKEEP_R_SEC        FLASHCACHE      0.0 IO/sec

         FC_IO_RQKEEP_R_SKIP       FLASHCACHE      1,532 IO requests

         FC_IO_RQKEEP_R_SKIP_SEC   FLASHCACHE      0.0 IO/sec

         FC_IO_RQKEEP_W            FLASHCACHE      17,794 IO requests

         FC_IO_RQKEEP_W_SEC        FLASHCACHE      0.0 IO/sec

         FC_IO_RQ_R                FLASHCACHE      420,546,099 IO requests

         FC_IO_RQ_R_MISS           FLASHCACHE      28,959,907 IO requests

         FC_IO_RQ_R_MISS_SEC       FLASHCACHE      0.0 IO/sec

         FC_IO_RQ_R_SEC            FLASHCACHE      0.0 IO/sec

         FC_IO_RQ_R_SKIP           FLASHCACHE      80,970,122 IO requests

         FC_IO_RQ_R_SKIP_SEC       FLASHCACHE      25.4 IO/sec
         FC_IO_RQ_W                FLASHCACHE      304,286,158 IO requests

         FC_IO_RQ_W_SEC            FLASHCACHE      22.4 IO/sec


CellCLI> LIST METRICCURRENT WHERE objectType = 'FLASHCACHE' AND name LIKE '.*KEEP.*'

         FC_BYKEEP_OVERWR           FLASHCACHE      0.0 MB

         FC_BYKEEP_OVERWR_SEC       FLASHCACHE      0.0 MB/sec

         FC_BYKEEP_USED             FLASHCACHE      5,072 MB

         FC_IO_BYKEEP_R             FLASHCACHE      80,288 MB

         FC_IO_BYKEEP_R_SEC         FLASHCACHE      0.0 MB/sec

         FC_IO_BYKEEP_W             FLASHCACHE      11,134 MB

         FC_IO_BYKEEP_W_SEC         FLASHCACHE      0.0 MB/sec

         FC_IO_RQKEEP_R             FLASHCACHE      91,231 IO requests

         FC_IO_RQKEEP_R_MISS        FLASHCACHE      11,155 IO requests

         FC_IO_RQKEEP_R_MISS_SEC    FLASHCACHE      0.0 IO/sec

         FC_IO_RQKEEP_R_SEC         FLASHCACHE      0.0 IO/sec

         FC_IO_RQKEEP_R_SKIP        FLASHCACHE      1,532 IO requests

         FC_IO_RQKEEP_R_SKIP_SEC    FLASHCACHE      0.0 IO/sec

         FC_IO_RQKEEP_W             FLASHCACHE      17,794 IO requests

         FC_IO_RQKEEP_W_SEC         FLASHCACHE      0.0 IO/sec
In addition to the performance metrics, you can also see what objects are in the cache. The LIST FLASHCACHECURRENT command displays what's in the cache. This command shows a single entry for each cached object, the amount of space it is occupying, and various other statistics. Here's an example of looking at the flash cache content:
CellCLI> describe flashcachecontent

        cachedKeepSize

        cachedSize

        dbID

        dbUniqueName

        hitCount

        hoursToExpiration

        missCount

        objectNumber

        tableSpaceNumber

CellCLI> list flashcachecontent where dbUniqueName like 'EXDB' -

> and hitcount > 100 -

> attributes dbUniqueName, objectNumber, cachedKeepSize, -

> cachedSize, hitCount, missCount

         EXDB    2       0               4194304         587     208

         EXDB    40      0               2424832         376     60

         EXDB    383     0               2146304         117     27

         EXDB    471     0               4071424         274     85

         EXDB    475     0               5881856         503     123

         EXDB    503     0               5308416         669     455

         EXDB    6373    0               2539520         122     39

         EXDB    66849   438763520       438763520       420     3322
         EXDB    71497   0               1220608         255     15

         EXDB    71775   0               651780096       1263    20868
Unfortunately, the object name is not included in the list of attributes. This means you must go back to the database to determine which object is which (by querying dba_objects for example). Note that the ObjectNumber attribute in cellcli is equivalent to the data_object_id in the database views such as dba_objects.
SYS@EXDB1> select owner, object_name, object_type

  2 from dba_objects where data_object_id = 66849;


OWNER                          OBJECT_NAME          OBJECT_TYPE

------------------------------ -------------------- -------------------

KSO                            SKEW                 TABLE
At the Database Layer
The database really doesn't provide much visibility into how ESFC is used. There is only one statistic available in v$sysstat and related views regarding its use.
SYS@EXDB1> @mystats

Enter value for name: cell flash%


NAME                                                                  VALUE

---------------------------------------------------------------- ----------

cell flash cache read hits                                             2188
As with all such statistics, “cell flash cache read hits” is cumulative. In v$sysstat the statistic reflects the system total since the instance was started. In v$mystat the statistic reflects the session total since the session was started. So the only real way to make use of the information is to look at the value before and after the execution of a SQL statement of interest:
SYS@EXDB1> @mystats

Enter value for name: cell flash%


NAME                                                                 VALUE

---------------------------------------------------------- ---------------

cell flash cache read hits                                             769


SYS@EXDB1> set echo on

SYS@EXDB1> @avgskew

SYS@EXDB1> select avg(pk_col) from kso.skew a where col1 > 0

  2  /


AVG(PK_COL)

-----------

 16093750.8


SYS@EXDB1> set echo off

SYS@EXDB1> @mystats

Enter value for name: cell flash%
NAME                                                                 VALUE

---------------------------------------------------------- ---------------

cell flash cache read hits                                            2550
Performance
So how much benefit does the Exadata Smart Flash Cache actually provide? Probably one of the most effective measures of the effectiveness of the cache is the single block read times. Here's a snippet from an AWR report for a fairly representative mixed workload production environment.
Event                      Waits <1ms <2ms <4ms <8ms <16ms <32ms <=1s  >1s

-------------------------- ----- ---- ---- ---- ---- ----- ----- ---- ----

cell single block physical 29.4K 96.7  1.5   .2   .4    .4    .3   .4
This output was taken from a one-hour snapshot and as you can see, there were almost 30,000 single block reads, of which about 97% took less than 1ms. This is fairly representative of the production systems we've observed and compares favorably with SSD-based systems. Systems that run entirely on SSD storage generally have average single block access times in the 0.4ms range, which is marginally faster than what we generally see on Exadata. However, the SSD systems are usually not capable of scaling the I/O the way Exadata can. Exadata enjoys this advantage primarily because it is designed to be a balanced configuration, meaning that the components in the I/O path are more closely matched than in most conventional storage arrays. Nothing is without limitations, of course, but most storage systems are bottlenecked at various points in the I/O path (at the disk controllers, for example).
An example may be useful in illustrating this point. We recently did a benchmarking exercise pitting an Exadata V2 High Capacity SATA quarter rack system against a Sun M5000 with 32 cores using SSD for all database storage. The test was a batch program that spent most of its time doing what we would typically call OLTP-type processing. There was a large table with a billion plus rows, but it was accessed via B-Tree indexes a row at a time. On the M5000, the process took about 3 hours and on the Exadata it took a little less than an hour. We have had similar experiences with other OLTP-type workloads as well. We generally don't see the enormous performance benefits over other systems that we see on data warehouse oriented workloads, but we have seen the platform turn in improved performance numbers on every system we've compared to date.
So how else could we measure the effectiveness of ESFC? It's tempting to try to calculate a hit ratio for the flash cache. No doubt it would be interesting to know what percentage of requested I/Os are satisfied by the ESFC. But this calculation is not straightforward. Since ESFC caches more than just table and index blocks, it's difficult to get a reasonable estimate. You could argue that other accesses (ESFC buffers control files access as well) are not significant enough to make any difference, and that may be true. But the fact of the matter is there is no easy way to do anything other than make a somewhat educated guess, knowing full well that it won't be completely accurate. Nevertheless, here is a script (esfc_hit_ratio.sql) that makes an attempt. The script adds the single block and multiblock physical reads and compares those with the cell flash cache hits. In many systems this will be reasonably close. You should be aware though that Smart Scans can also access the ESFC for objects that have been designated for aggressive caching via the CELL_FLASH_CACHE storage parameter.
SYS@EXDB1> @esfc_hit_ratio

SYS@EXDB1> column c1 heading 'Event|Name'             format a30 trunc

SYS@EXDB1> column c2 heading 'Total|Waits'            format 99,999,999

SYS@EXDB1> column c3 heading 'Seconds|Waiting'        format 9,999,999

SYS@EXDB1> column c5 heading 'Avg|Wait|(ms)' format 9999.9

SYS@EXDB1> column c6 heading 'Flash Cache Hits' for 999,999,999,999

SYS@EXDB1> col hit_ratio heading 'Hit Ratio' for 999.999
SYS@EXDB1>

SYS@EXDB1> select

  2   'cell single + multiblock reads' c1,

  3   c2, c3, c5, c6,

  4   c6/decode(nvl(c2,0),0,1,c2) hit_ratio

  5  from (

  6  select

  7     sum(total_waits)                   c2,

  8     avg(value)                         c6,

  9     sum(time_waited / 100)             c3,

 10     avg((average_wait /100)*1000)          c5

 11  from

 12     sys.v_$system_event, v$sysstat ss

 13  where

 14     event in (

 15   'cell single block physical read',

 16               'cell multiblock physical read')

 17  and

 18      name like 'cell flash cache read hits'

 19  and

 20     event not like '%Idle%')

 21  order by

 22     c3

 23  ;


                                                 Avg

Event                            Total Seconds  Wait                  Hit

Name                             Waits Waiting  (ms) Flash Cache Hits Ratio

------------------------------ ------- ------- ----- ---------------- -----

cell single + multiblock reads 106,642     374   3.5          247,951 2.325
As you can see, the script vastly overestimates the hit ratio on this particular system, coming up with a hit ratio of over 200%. This happens because this system has several objects that are designated for aggressive caching, resulting in many cache hits for Smart Scan events which are not included in the single block and multi-block read statistics . For systems that don't use the KEEP attribute, the numbers should be closer to reality. However, calculated hit ratios are probably not the best approach. It is generally more enlightening to look at the actual single block access times than to try to calculate a hit ratio.
Summary
Exadata Smart Flash Cache provides yet another way to pare down the I/O cost associated with Oracle databases. Most of the optimizations that the Exadata platform provides require the use of Smart Scans (full table or index scans). ESFC does not depend on Smart Scans and in fact is most useful for speeding up access on random reads of single blocks. These operations are generally associated with OLTP workloads, and so ESFC is the key component of Exadata for OLTP or mixed workloads. The fact that ESFC does not provide a write-back cache, though, severely limits its effectiveness with systems that are bottlenecked on writes. Nevertheless, the large cache and the intelligent caching algorithms used by the Oracle storage software allow ESFC to provide read performance similar to solid-state based disk systems. Offloading large portions of random read activity from the disks also provides an indirect benefit to processes attempting to write to those same disks.
While ESFC is generally thought of as an optimization aimed at reducing latency for small reads, it can also be used quite effectively for large DW-type queries. In fact, the large throughput numbers that Oracle quotes depend on disk and flash cache being scanned concurrently. The flash cache actually shoulders the lion's share of the burden in this case. You can enable this ability on specific tables by setting the CELL_FLASH_CACHE attribute on the table to KEEP. This ability should not be overlooked for key tables, as the performance difference can be dramatic.