
9
MCDA Application via DSS Software
9.1 Introduction
This chapter focuses on applying multiple-criteria decision analysis (MCDA) through a decision support system (DSS), a computerized program used to support determinations, judgments, and courses of action in an organization or a business. MCDA is a series of systematic approaches intended to support the analysis process of decision-making involving multiple criteria and conflicting objectives, often conflicting objectives. DSS is a collection of decision support software products that use those analytical techniques in the MCDA framework to aid decision makers and stakeholders in solving complex decision problems in a much better and more comprehensive way. They are conventionally interactive computer-based systems that can be applied to various contexts of complex decision scenarios. The tools adopt models or algorithms from data processing, mathematical programming, and logic modeling. Some DSS applications even incorporate a multitude of MCDA methods and come with a preliminary preference setting that allows users to (Vasuthanasub 2019):
- break down a problem into a set of more manageable components
- define and structure individual components in systematic ways
- weigh and measure each component, and then
- combine all evaluated results to identify the preferable solutions
When applying MCDA in group decision-making, the framework will help people express their thoughts, judgment, and decision opportunity in a way that the values of each viewpoint are as crucial as the others.
In the third phase of the ReIDMP platform, the details from the NRS or Norfolk Resilient Strategy (City of Norfolk 2015) document are used again as input data for designing and evaluating the decision models. Specific pieces of information, particularly the “NRS: Framework,” were synthesized to fit appropriately with two selected MCDA methods: MAUT and evidential reasoning (ER). For this decision model testing, three key goals of the NRS project are transformed into three primary areas of interest: environment, economy, and society. Each goal consists of its associated strategies and corresponding proposed actions, which will serve as attributes and alternatives. In the case of proposed actions, the original propositions of each strategy in the NRS document have been intentionally revised and clustered into a single item at this time to comply with the MCDA framework requirement. Table 9.1 describes the selected strategies and the proposed actions for the City of Norfolk.
Table 9.1 Resilient goals, strategies, and actions for the City of Norfolk.
| Aspects (goals) | |||
|---|---|---|---|
| Selective strategies (criteria/attributes) | Proposed actions (alternatives) | ||
| Environmental aspect: design the coastal community of the future | |||
| EVS1 | Creative vision for Norfolk City’s future | EVA1 | Development of next generation water management strategies |
| EVS2 | Innovative infrastructure for water management | EVA2 | Comprehensive studies of flood risk and control |
| EVA3 | Global practice on water innovation and integrated flood management solutions | ||
| EVS3 | Ideal place for living and working | EVA4 | Norfolk collaboratory and live Norfolk programs |
| EVS4 | Tools and regulations for vision accomplishment | EVA5 | Partnership with academia and experts on the future of land use |
| EVA6 | Long-term recovery plan and rapid housing recovery | ||
| Economic aspect: create economic opportunity by advancing efforts to grow existing and new sectors | |||
| ECS1 | Multi-pronged economic development strategy | ECA1 | Economic development plan and job creation capital (EB-5) |
| ECS2 | City’s entrepreneurial ecosystem | ECA2 | Business community support and resilience lab |
| ECS3 | Workforce development initiative | ECA3 | Regional career technical school and workforce development center |
| ECA4 | Early childhood care and education systems | ||
| ECS4 | Neighborhood revitalizations | ECA5 | Lots of Opportunity program and affordable housing trust fund |
| ECS5 | Innovative financing methods | ECA6 | Creative risk reduction bond and local business investment fund |
| Societal aspect: advance initiatives to connect communities, deconcentrate poverty, and strengthen neighborhoods | |||
| SCS1 | Citizen’s information access | SCA1 | Bank on Norfolk and resilience dashboard programs |
| SCS2 | Community-building support through technology | SCA2 | Helping hands and emergency response programs |
| SCS3 | Community connection channels | SCA3 | Neighborhood asset mapping and open lines of communication |
9.1.1 The Description of Selective Strategies and Proposed Actions
9.1.1.1 EVS1–EVA1
To create and preserve the coastal community, The City of Norfolk is committed to defining its future through a collaborative visioning process. A campaign focuses on facilitating a citizen-led discussion to address “what is important for Norfolk” and to identify “what principles should be adopted by or would be the best option for the city” (City of Norfolk 2015). This idea aims to generate an innovative plan for living with water now while making a long-term investment for future growth.
9.1.1.2 EVS2–EVA2 and EVA3
Securing the future of Norfolk’s coastal community requires innovative water management approaches and infrastructures that can respond to both present and future risk events (City of Norfolk 2015). The city intends to conduct a comprehensive study of flooding in partnership with the US Army Corps of Engineers and to create integrated flooding management solutions by combining human-made and natural systems, such as green infrastructure and seawall upgrades, to better control flooding. The City of Norfolk is also teaming up with a group of global experts to provide peer critiques and explore how multiple benefits can be achieved successfully from flood mitigation investments.
9.1.1.3 EVS3–EVA4
Coastal access is a key advantage for Norfolk. This fundamental value attracts people in terms of residential dwellings and business investments (City of Norfolk 2015). Therefore, while protecting the coastline and core area through infrastructure investment, the City of Norfolk strives to brand itself with a strong identity as a vibrant place for inhabitants and investors.
9.1.1.4 EVS4–EVA5 and EVA6
People are at the beginning of change, but to form better change together the city must redesign the government process and redefine the regulatory environment that aligns with the resilient actions (City of Norfolk 2015). New tools and regulations, especially zoning code, land use, rapid housing model, and long-term recovery plan, should be user-friendly and encourage future project developments in sustainability and resiliency.
9.1.1.5 ECS1–ECA1
To create more economic opportunity, Norfolk has investigated its economic situation and identified the potential disciplinary approaches and drivers for existing and new sectors to boost economic prosperity (City of Norfolk 2015). The city is committed to incorporating knowledge into a new comprehensive economic development strategy for future growth. The development plan will include information, such as business recruitment, expansion, retention, and creation, focusing on capturing markets outside the region. The City of Norfolk also collaborates with the US Citizens and Immigration Service to establish an EB-5 regional center, where direct investments from foreign investors will be allowed to fund the regional projects.
9.1.1.6 ECS2–ECA2
Norfolk has become a burgeoning center for entrepreneurs over the past few years. These small businesses and growing enterprises are bringing energy and excitement into the city. With this in mind, the city believes that to accelerate and maintain overall growth, Norfolk must address the key challenge of access to capital and talent. The need for these requirements is to invent a resilience lab/accelerator platform that connects problems, solutions, and products.
9.1.1.7 ECS3–ECA3 and ECA4
Highly qualified human resources are another key to the future success of Norfolk’s economy. Thus, a strong workforce must be built, starting with the youth (City of Norfolk 2015). Providing training opportunities for residents and nurturing the necessary skill sets to strengthen future economic growth is the apparent answer to crafting resilience. The City of Norfolk intends to pave the way for consistent growth and ensure ongoing access to education and opportunity through adulthood. The city also plans to open the first regional career technical school and workforce development center, which will help students and transitioning workers gain more knowledge or technical competency for higher-level employment.
9.1.1.8 ECS4–ECA5
It is inevitable that the expansion and prosperity of Norfolk’s future economy are tied directly to the vitality of neighborhoods. The social disparities, like concentrated poverty, social isolation, and lack of educational or career training opportunities, limit the economic growth rate in many city areas. To resolve these issues as well as secure future resilience, the City of Norfolk means to collapse those disparities by launching poverty support programs called “Lots of Opportunity” and “Affordable Housing Trust Fund” (City of Norfolk 2015). The former was invented to target households in the low to moderate median income range with the condition that they must be first-time homebuyers. The latter was founded to establish the operating principles and long-term sustainable funding sources for the fund.
9.1.1.9 ECS5–ECA6
Funding is one of the primary challenges for the NRS project. Resourcing resilience solutions require a tremendous amount of investment. The City of Norfolk not only intends to focus on existing resource allocations but also plans to develop new financing methods for the implementation of forty-five proposed resilience actions. To raise more funding resources, however, Norfolk’s Departments of Budget and Strategic Planning and Finance have worked with its partner in seeking innovative ways to leverage the financial benefits from investments of risk reduction bonds or social impact bonds.
9.1.1.10 SCS1–SCA1
Accessing accurate information promptly is critical to an individual in making an informed decision. So much so that all key data, such as buildings, permits, code violations, flood risks, storm damages, and calls for service, must be integrated into a single system and can also be disseminated into actionable information. The City of Norfolk has partnered with Palantir (https://www.palantir.com), a global data integration company, to develop the building blocks for information-based decision-making. This new resilience module will enhance the city’s ability to serve and respond to citizens.
9.1.1.11 SCS2–SCA2
City of Norfolk (2015) claimed that a city with well-connected communities would withstand better and recover quicker from disruptive events. Technology advancements can help citizens connect more efficiently and build a more extensive network of people. The City of Norfolk aims to bring communities together and increase their attachment to one another by engineering new smartphone applications and networking technologies that are capable of connecting vulnerable populations with communities and services.
9.1.1.12 SCS3–SCA3
The City of Norfolk strives to improve communication methods for connecting people with each other and their government. The city believes that citizens who share the same vision will be essential to fulfilling that vision (City of Norfolk 2015). The city’s Department of Neighborhood Development works closely with local communities and residents to map their neighborhood’s physical, social, and economic assets. This effort will help the city to understand those core values that make neighborhoods strong and to provide support in times of emergency.
9.1.2 Summary
This section has provided data parameters that work with two DSS software programs (LDW and IDS), briefly discussed in Chapter 7. However, the decision analysis will be implemented with a two-step approach to represent well-defined decision modeling structures. First, each area of interest (i.e. environment, economy, and society) will be modeled individually to explore a ranking of proposed actions (alternatives) regarding their associated strategies (i.e. attributes) and targeted objectives (i.e. goal). Second, the top-three priority of alternatives on each goal will be adopted and combined as a complete version of the decision model to analyze the prioritization of alternatives concerning twelve attributes and three goals. Third, inform the purpose of implementing DSS in this study. Again, the aim is to demonstrate the benefits of the MCDA approach through DSS tools and especially to present examples of analysis results from an academic research viewpoint. Any findings from either LDW or IDS are not to be taken as the final product or absolute answer. People, and not tools, make decisions.
9.2 Logical Decisions® for Windows
LDW is a DSS software designed to support the processes of decision-making analysis (Georgescu et al. 2019; Howard 1968; Kim and Ambler 2002; Vasuthanasub 2019). It allows decision makers and stakeholders to address and solve complex problems by considering many variables at once, separating facts from value judgments, and explaining the choice to others. The tool captures differences by evaluating each alternative on a set of attributes called “measures” and analyzes the importance of those differences by incorporating value judgments, known as preferred levels, into the measures. Once the preferred levels have been assigned, LDW can apply the implications of those defined judgments to particular data and information and then provide alternative ranking results based on preference settings. All in all, the software is capable of handling a large number of attributes and manipulation of multiple utility curves (Kim and Ambler 2002). Adding objects, such as goal, sub-goal, attribute, sub-attribute, and alternative, requires only a few keystrokes. The configuration of utility functions for those attributes is automated. The application also comes with various methods for assessing attribute weights, displays many results, and enhances users’ experiences with a number of sophisticated features. Perhaps the most useful element of LDW is its capability to support rapid changes in values, with results that can be viewed immediately.
Structuring decision models and specifying the data parameters are the most important aspects of using a DSS tool. LDW facilitates the beginning step by providing a pre-outlined hierarchical structure for modeling a decision problem. This default hierarchy is comprised of two levels. The first level is a goal, and the second level is a measure. In LDW, a goal is a set of measures and other goals that form a hierarchy of decision problems. Each analysis always needs at least one goal, initially called the “overall goal.” Additionally, to identify which objects are the goal component and which objects are the measure component, LDW distinguishes them using basic shapes. The rectangle represents goals or sub-goals, and the oval depicts attributes or sub-attributes. While Chapter 10 discusses data input into the LDW, this chapter addresses the construction of hierarchical structure of decision models regarding the three individual goals (i.e. environment, economy, and society)Figures 9.1–9.3 depict LDW hierarchical structure models for the environment, the economy, and society, respectively. The integrated version of all three goals is depicted in Figure 9.4.

Figure 9.1 A LDW hierarchical structure model for the environment.

Figure 9.2 A LDW hierarchical structure model for the economy.
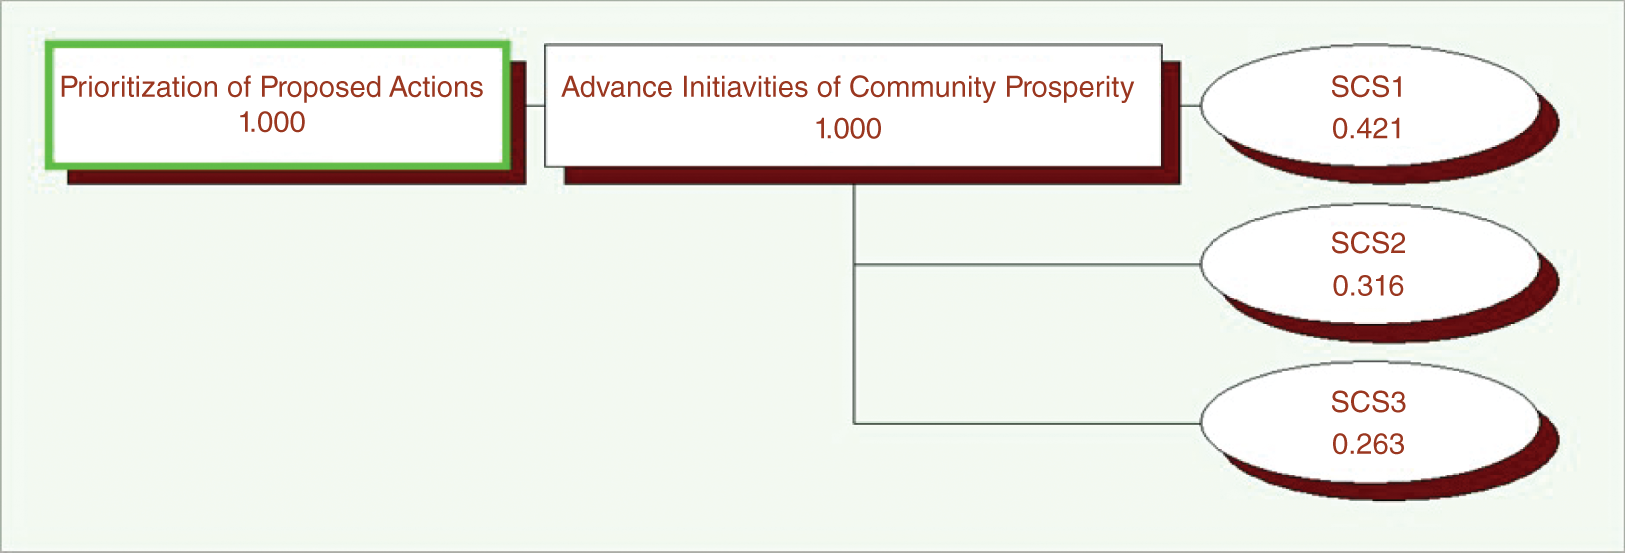
Figure 9.3 A LDW hierarchical structure model for society.

Figure 9.4 An integrated LDW hierarchical structure model for all goals.
Each goal has certain measures that are used to define how well an alternative meets the goal. Thus, adding measures is slightly more complicated than goals. Measures require inputting the most or least preferred levels and scale with units for each measure. The input of most and least preferred values is a significant characteristic since this is how the application detects that a goal is designed to maximize or minimize a specific weight. LDW also allows label scales for particular attributes and numerical values. This function is a distinctive feature of the application as often; many attributes cannot be characterized in numerical units. As for this decision analysis, a scale of five priority levels (i.e. lowest, low, moderate, high, and highest) is selected for every model’s attributes. Figure 9.5 depicts the setting for designated units, while Figure 9.6 depicts the assigned labels of lowest, low, moderate, high, and highest.

Figure 9.5 Using label scales in LDW for the designation of units.

Figure 9.6 Using label scales in LDW for the nomination of label scales.
Alternatives are a collection of choices that decision makers and stakeholders expect to rank in the order of best to worst in the analysis and mean to select after obtaining the result. However, when implementing decision analysis with LDW, the set of proposed alternatives will not be included or illustrated graphically in the hierarchical structure of the decision model. It will be displayed separately in another window. The user can navigate the model/program to reach that alternative registration window by clicking on the tab bar, namely “Matrix: Name of Overall Goal,” located at the top of the LDW main activity window. The list of alternatives for the NRS was used in the scoring judgment matrix concerning the set measures within the NRS decision-making process. For example, Table 9.2 depicts the LDW matrix of alternatives for the priority level of the proposed environmental actions. Table 9.3 depicts the LDW matrix of alternatives for the priority level of proposed economic actions. Table 9.4 depicts the LDW matrix of alternatives for the priority level of societal proposed actions.
Table 9.2 Using label scales in LDW for the nomination of label scales for proposed environmental actions.
| EVS1 | EVS2 | EVS3 | EVS4 | |
|---|---|---|---|---|
| EVA1 | Highest | High | Moderate | High |
| EVA2 | High | Highest | High | High |
| EVA3 | Moderate | Highest | High | High |
| EVA4 | Low | Low | Highest | Moderate |
| EVA5 | Moderate | Moderate | Lowest | Highest |
| EVA6 | Moderate | Lowest | High | Highest |
Table 9.3 Using label scales in LDW for the nomination of label scales for proposed economic actions.
| ECS1 | ECS2 | ECS3 | ECS4 | ECS5 | |
|---|---|---|---|---|---|
| ECA1 | Highest | Moderate | High | Moderate | High |
| ECA2 | High | Highest | Low | Lowest | Moderate |
| ECA3 | High | Moderate | Highest | Moderate | Moderate |
| ECA4 | Moderate | Low | Highest | High | Moderate |
| ECA5 | Lowest | Low | Moderate | Highest | High |
| ECA6 | Moderate | Low | Low | Moderate | Highest |
Table 9.4 Using label scales in LDW for the nomination of label scales for societal proposed actions.
| SCS1 | SCS2 | SCS3 | |
|---|---|---|---|
| SCA1 | Highest | Moderate | Low |
| SCA2 | Moderate | Highest | Moderate |
| ASC3 | Low | High | Highest |
Each of NRS’s three primary goals is modeled individually to investigate the possible ranking of alternatives on each goal. Later, the top-three alternatives in each ranking result will be adopted and put together to develop a comprehensive version of the integrated decision model. Note that just two alternatives from the ranking result of Goal III will be selected at this time since its original strategies and proposed actions are fewer in numbers than the activities listed in Goals I and II – Chapter 11 discusses goals in greater detail. In this step, each alternative’s priority level must correspond with each attribute to generate a certain amount of utility that will contribute to the overall goal. So much so that the assigned priority level has to accurately indicate how the alternative performs with respect to that measure. Each pairwise will have different priority levels; some might be more or less favorable than others. Eventually, each of these measures must be mutually independent, meaning that an increase in one measure’s value will not change the value of another.
The assessment of common units is a function wizard of LDW that was ideally designed to convert the level for each measure to common units of utility. In principle, this step is mandatory and always subjected to be evaluated if a set of measures utilizes different types of scale, either quantitative (numerical) or qualitative (label). In LDW, multiple conversion methods are available to assess common units, such as Analytic Hierarchy Process (AHP), SUF, AHP SUF, Balance Beam SUF, Adjusted AHP, Ideal AHP, and Direct Assessment. By default, most are risk neutral and assume that scales are equally distributed (i.e. 0, 0.25, 0.50, 0.75, and 1). The user can individually edit the utility of each scale using these conversion methods. The feature converts a measure’s level into utility, which can be linear or exponential. However, when any measure’s levels in the decision model use labels as a unit, only four methods, including AHP, Adjusted AHP, Ideal AHP, and Direct Assessment, will be applicable to perform the conversion assessment. This rule is applied to the current situation since all measures in the decision models were characterized to use the label scales of priority level. Hence, the Adjusted AHP was chosen to accommodate the conversion process of common units. Theoretically, this method is essentially the same as the original AHP. Both versions define the relative performances by comparing the performance ratio on each possible pair of alternatives or labels. However, the difference is that the Adjusted AHP function wizard provides a simpler approach to assigning values, in which the least preferred has a utility of 0 and the most preferred has a utility of 1. Figure 9.7 depicts the adjustment of performance ratios used in this decision analysis. The same values are repeatedly assigned to each measure since they all use the label scales.

Figure 9.7 LDW common unit assigned values in Adjusted AHP.
The final stage of any decision analysis with multiple attributes is the assessment of weights. This step aims to define how the utilities of an active set of goals and their members (measures) are combined into the utility for a higher-level or overall goal. The assessment is usually completed by using a weighted average of the utilities. Similar to the common unit assessment step, LDW provides several options for weight assessment for each of the measures. The available methods include AHP, Smart, Smarter, Tradeoffs, Balance Beam, Direct Entry, and Pairwise Weight Ratios. For this experimental evaluation, the Smart Method (swing weights) option was adopted to determine the preferred level of importance of any attributes. This method was selected as it is the most straightforward approach among the weight assessment options, which renders an easy understanding as well as flexible adjustment. By selecting the swing weight function, the user can directly enter the value, ranging from the least preferred (0) to the most preferred (100), to adjust each attribute’s relative weight of importance. The swing weight values administered in the three individual decision models (environmental, economic, and societal attributes) are presented in Figures 9.8–9.10.

Figure 9.8 LDW weight assessment for the weight distribution on environmental attributes.

Figure 9.9 LDW weight assessment for the weight distribution on economic attributes.

Figure 9.10 LDW weight assessment for the weight distribution on societal attributes.
Once the components of goals, attributes, and alternatives are correctly transformed into the decision models, the conversions of a common unit on all of the measures are appropriately established, and the assessment of weight distribution on an active set of goals and their members is precisely verified. LDW will calculate the results based on those settings and configurations. Regarding the result representations, LDW offers a variety of features to present the analysis results in different formats. However, the most common and simplistic one is the Rank Alternatives. With a selection of this function wizard, the application will generate a graphical chart, which displays the relative utility scores and the stacked bar comparing each of the alternatives. The utility values are the determinant that indicates the length of the stacked bar. The higher the number of total utilities, the longer the length of the bar.
Additionally, each stacked bar represents the accumulated utility ratios obtained from each measure. As a result, each alternative could be compared to the other to see exactly how the utility of each measure factored into the final decision – the results of the alternative ranking for each area of interest (environmental, economic, and societal goals) are depicted in Figures 9.11–9.13.

Figure 9.11 LDW alternative ranking result for environmental goal.

Figure 9.12 LDW alternative ranking result for economic goal.

Figure 9.13 LDW alternative ranking result for societal goal.
Modeling each of NRS’s goals individually is only a first-step approach to examining the alternative rankings based on their goal. New screening sets of proposed actions include EVA2, EVA3, EVA1, ECA1, ECA4, ECA3, SCA1, and SCA2.
With the finding of eight selective proposed actions, an inclusive version of the decision model will be executed by using this set of alternatives. In the second-step approach, three NRS goals were incorporated into a larger-scale model by demoting goals to sub-goals. In contrast, the associated strategies of each goal remain as indicated in Table 9.1. The label scale judgments of priority levels previously determined for each pairwise (Tables 9.2–9.4) are mapped and combined with any new possible pair of proposed actions and strategies, as shown in Table 9.5. Regarding the assessment of common units, neither custom configuration in the conversion method nor specific adjustment on the performance ratios were changed. The same set of values demonstrated earlier in the matrix of common unit conversion by Adjusted AHP (Figure 9.7) was still applied in the larger-scale modeling case. There is also no change in either the selection of weight assessment method or determination of swing weight values regarding any measures. However, the only additional correction in the setting at this time was the ratio of weight distributions on each of the city’s three primary goals. The adjustments of weight distribution and new utility ratios are exhibited in Figure 9.14.

Figure 9.14 LDW weight assessment for the adjustment of weight distribution on three goals.
Table 9.5 LDW matrix of alternatives for priority level of selected proposed actions.
| EVS1 | EVS2 | EVS3 | EVS4 | ECS1 | ECS2 | ECS3 | ECS4 | ECS5 | SCS1 | SCS2 | SCS3 | |
|---|---|---|---|---|---|---|---|---|---|---|---|---|
| EVA1 | Highest | High | Moderate | High | Moderate | Moderate | Lowest | High | Moderate | Low | Moderate | Lowest |
| EVA2 | High | Highest | High | High | Low | Low | Low | High | Low | Moderate | Moderate | Moderate |
| EVA3 | Moderate | Highest | High | High | Low | Low | Low | High | Low | Moderate | Moderate | Low |
| ECA1 | High | Low | Moderate | Moderate | Highest | Moderate | High | Moderate | High | Moderate | Low | Low |
| ECA3 | High | Low | High | Low | High | Moderate | Highest | Moderate | Moderate | Moderate | Low | Low |
| ECA4 | High | Lowest | High | Moderate | Moderate | Low | Highest | High | Moderate | Moderate | Low | Low |
| SCA1 | Moderate | Low | Low | Moderate | Low | Moderate | Low | Moderate | High | Highest | Moderate | Low |
| SCA2 | Moderate | Lowest | High | Moderate | Lowest | Lowest | Low | High | Low | Moderate | Highest | Moderate |
According to the description of a stacked bar chart disclosed in Figure 9.15, the prioritization of proposed actions is ranked as follows: (1) ECA1, (2) EVA2, (3) ECA3, (4) EVA3, (5) EVA1, (6) ECA4, (7) SCA1, (8) SCA2. To sum up, ECA1, ECA3, and ECA4 were ranked first, third, and sixth respectively; EVA2, EVA3, and EVA1 were ranked second, fourth, and fifth; and SCA1 and SCA2 somehow were outranked by the others and dropped to seventh and eighth. This ranking of priorities could imply that the priority level of proposed actions in economic and environmental aspects may appear to be distinguishable in terms of scoring performance. Still, they are critical to achieving the overall goal of the city. From a societal viewpoint, its proposed actions may seem to have less priority than the others, yet they are important and need to be accomplished as well. However, Phase III of the ReIDMP platform was purposely designed to be developed using two different MCDA techniques through two specific DSS software packages, so much so that this prioritization list was not a final answer. The result merely provides an initial assumption and overall idea of the priority level of proposed alternatives. A summary of points based on the finding will be reviewed and finalized after implementing the decision model with IDS. Incidentally, besides the Ranking Alternative function, additional options providing informative result representations are Dynamic Sensitivity and Compare Alternatives.

Figure 9.15 LDW alternative ranking result for integration of three goals.
Figure 9.16 depicts the sensitivity analysis graph for NRC (i.e. NRS) and gives insight into how the ranking of alternatives could change if the weight of specific attributes is altered. The user can adjust the weight by directly dragging the blue color bar or clicking on the current weight to enter the new value at the lower section of the LDW main activity window. In LDW, the user can also compare each alternative’s performance against the others. By selecting this function, the user chooses two alternatives to create a pair that needs to be examined. Examples of Compare Alternative charts are provided in Figures 9.17 and 9.18.

Figure 9.16 LDW dynamic sensitivity.

Figure 9.17 LDW comparison of alternatives (ECA1 vs. EVA2).

Figure 9.18 LDW comparison of alternatives (ECA3 vs. EVA1).
9.3 Intelligent Decision System
Like LDW, Intelligent Decision System (IDS) is a DSS software developed to assist decision makers and stakeholders in facing a complicated decision problem. Moreover, while the other DSS use traditional MCDA methods (e.g. AHP or MAUT), IDS adopts a theory of ER approach. An evidence-based reasoning process deals with complex decision problems, particularly for quantitative and qualitative criteria with uncertainties (Xu and Yang 2001, 2003, 2005; Yang and Xu 2002, 2004). In IDS, the MCDA problem is modeled and analyzed using an extended decision matrix in which each pairwise attribute and alternative is assessed with a two-dimensional variable, namely possible criteria referential values and their associated degree of belief (Xu and Yang 2003, 2004; Zhou et al. 2010). The tool has significant advantages over conventional methods, allowing the user to improve consistency, transparency, and objectivity during the execution process. Overall, the software is considered a flexible application that is not only capable of handling different types of data (e.g. probability uncertainty, incomplete information, subjective judgments, and interval data) but also offers various informative analysis results, including alternatives’ scores, performance diversity, strengths and weaknesses, and profile and graphical representation.
Regarding software implementation, constructing decision models and defining the necessary data is the most important aspect of utilizing a DSS product. The interface and usability of IDS are quite similar to LDW, yet somewhat more user-friendly and straightforward. In IDS, the main menu bar and basic function shortcut bar are located at the top of the main application wizard, and below those two bars is the modeling activity window. This window consists of two sections: the right side is the tree view window for illustrating a hierarchical structure of the decision problem, particularly goals and criteria. The left side is the list view window to display possible alternatives that need to be assessed (Yang and Xu 2004). The data parameter will remain unchanged for this decision model testing with IDS. The two-step approach used in LDW is still applied.
Eventually, by mapping the same input data set into the IDS with its function wizard, the hierarchical structure of decision models regarding three individual goals (environmental, economic, and societal) and the integrated version of all three goals are presented in Figures 9.19–9.22.

Figure 9.19 Creating an IDS tree for list views of decision model of environmental goal.

Figure 9.20 Creating an IDS tree for list views of decision model of economic goal.

Figure 9.21 Creating an IDS tree for list views of decision model of societal goal.

Figure 9.22 Creating an integrated IDS tree for list views of decision model of all goals.
However, in addition to representing the decision model in the tree and list view as described earlier, IDS also offers another viewing option for visualizing a holistic view of the decision model. This mode is called “Dialog Box View” and can be found and operated by selecting the fifth icon on the basic function shortcut bar. Within this mode, the yellow-colored boxes represent the alternatives (proposed actions). The light blue colored boxes portray the attribute (strategies). Each also presents brief information about the decision component. For the alternative box, the name is at the top, the ranking is in the bottom left, and the utility value is in the bottom right. For the attribute object, the name is at the top, the weight is in the bottom left, and the value (quantitative case) or average utility value (qualitative case) is in the bottom right. Figures 9.23–9.25 are the IDS Dialog Box Views of the environmental, economic, and societal goals, respectively. Figure 9.26 is the IDS Dialog Box View of the integrated goals.
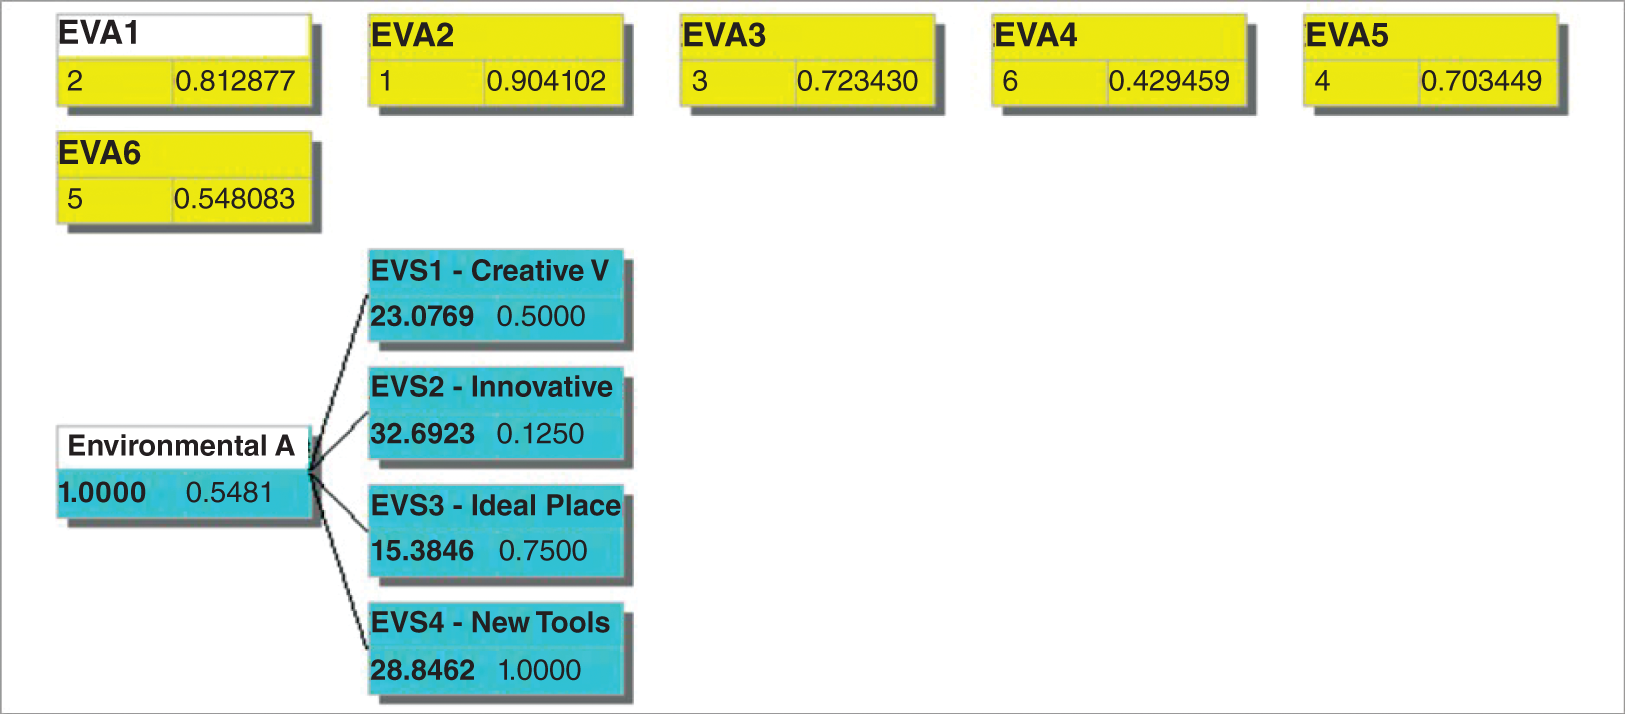
Figure 9.23 IDS dialog box view of decision model of the environmental goal.

Figure 9.24 IDS dialog box view of decision model of the economic goal.

Figure 9.25 IDS dialog box view of decision model of the societal goal.

Figure 9.26 IDS dialog box view of decision model of the integrated goals.
Defining a set of assessment grades for each attribute is imperative when using IDS to conduct a decision analysis on the MCDA problem. Each grading set must be separately determined, so the software can understand how each attribute is being assessed. In the dialog setting window, the attribute can be defined as qualitative or quantitative with whether certain or uncertain conditions. As for the case of NRC decision model testing, since the selected strategies and proposed actions were meant to be assessed with the label scale of five priority levels, an option of the qualitative attribute was selected at this time. The five evaluation grades are indicated in Figure 9.27. The associated grades are labeled (1) lowest, (2) low, (3) moderate, (4) high, and (5) highest, as indicated in Figure 9.28. Furthermore, to keep the configuration settings of this model testing comparatively identical as well as relatively consistent with the previous modeling implementation in LDW, it is assumed that the utility values of five priority grades are linearly distributed, which are 0, 0.25, 0.50, 0.75, and 1, as indicated in Figure 9.29.
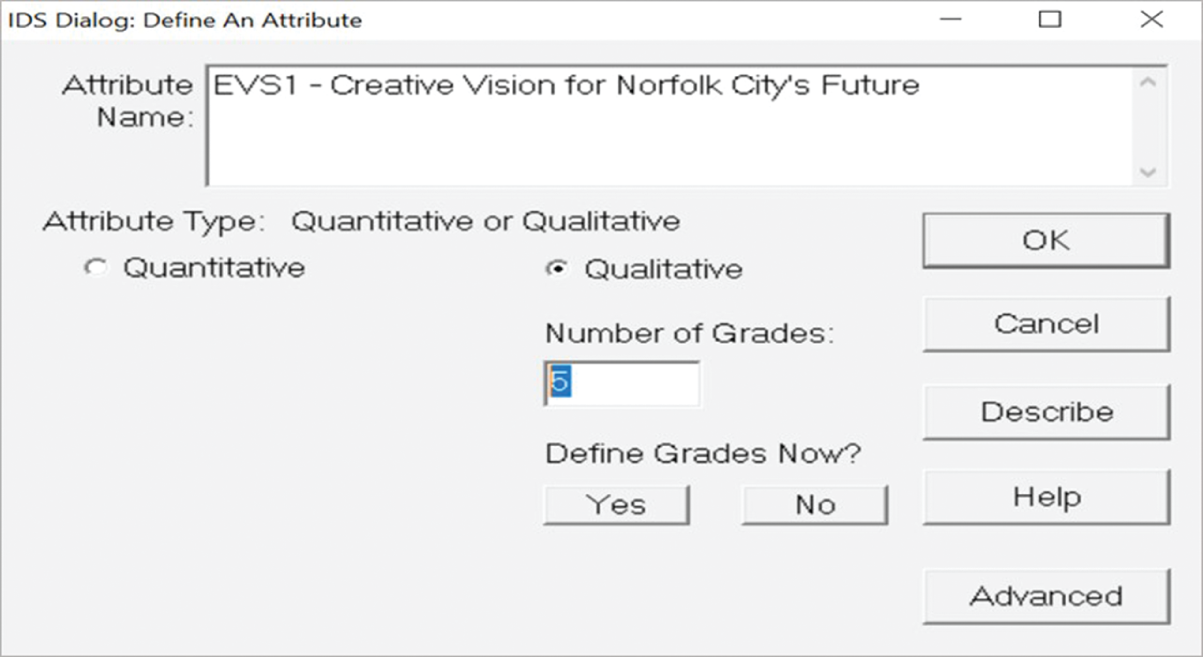
Figure 9.27 IDS dialog window defining name and number of grades.

Figure 9.28 IDS dialog window defining qualitative grades.

Figure 9.29 IDS dialog window defining utility assignment of evaluation grades.
Judging the score or assigning the grade for each of the alternatives corresponding with each of the attributes in IDS differs from LDW and other DSS applications. In IDS, the software does not offer an option of visualizing all possible combinations between alternatives and attributes in a comparison table or a matrix format. Each alternative and each attribute must be manually paired and individually evaluated one-by-one at a time. Moreover, on the condition that ER assesses the qualitative attributes by using both grades and a degree of belief. Consequently, instead of assigning just a single value of scores or determining one level of importance, the user can choose one or more preferred grades with different degrees of belief. Figures 9.30–9.32 provide examples of how the grades can be assigned to some of each possible pair of the alternative and attribute.

Figure 9.30 IDS dialog window for pairing alternatives (EVA1–EVS1).

Figure 9.31 IDS dialog window for pairing alternatives (ECA1–ECS3).

Figure 9.32 IDS dialog window for pairing alternatives (SCA1–SCA2).
One additional annotation to these figures is the implication of a degree of belief in the field on the right of a checkbox. Technically, this variable represents the strength with which an answer is believed to be true. The value can be less than or equal to one (1). This means that when only one answer is selected, a belief degree would equal (1). However, suppose that two or more answers were chosen. In that case, the values of a belief degree will either be equally average based on the number of checked answers by IDS or be instantly adjustable with an exact number by the user, which in the end must in total be equal to one (1) as indicated in Figures 9.31 and 9.32. At any rate, this distinctive feature is an outstanding benefit that sets IDS apart from other DSS tools. It possesses unique flexibility in handling MCDA problems with subjective information and judgmental uncertainty simultaneously.
Another mandatory requirement in developing the decision model with IDS is the determination of relative weights for each attribute. In IDS, the software provides a few options for the assessment method, notably visual scoring, and pairwise comparisons, to assist the user in assigning weights to the attributes. The former seems to be a suitable method in this decision analysis since the latter requires additional knowledge and opinions from subject matter experts. By selecting the visual scoring option, the function wizard allows the user to administer the weight distribution to each attribute by dragging an interactive bar graph up and down to reach a preferred limit or entering an exact value in the weight edited field. For example, Figures 9.33–9.35 depict the weight distribution for values assigned to environmental, economic, and societal attributes, respectively. In all cases, the visual scoring approach is performed with the normalized condition to ensure that the sum of the weights on all attributes is equal to 1.

Figure 9.33 IDS weight distribution for environmental attributes.

Figure 9.34 IDS weight distribution for economic attributes.

Figure 9.35 IDS weight distribution for societal attributes.
With the completed set of three required modeling procedures, the software should be ready to analyze the decision model and produce the output information. In IDS, the most frequently used function in processing the result representation is “Graph Ranking.” The user can reach the command by either selecting “Report Graph Ranking” on the main menu bar or directly clicking the twentieth icon on the basic shortcut bar within the IDS window. By opting in for this function wizard, the software will generate a graphical chart, which displays the relative utility scores and the vertical bar comparing each of the alternatives. Again, the utility values are the determinant that indicates the height of the bar. The more significant the number of utilities, the taller the bar’s height. For example, Figure 9.36 shows the rankings for the environmental alternatives in vertical bar charts, with EVA2 being the tallest. Figure 9.37 indicates the economic options rankings in vertical bar charts, with ACA1 appearing tallest. Figure 9.38 shows the orders for the societal alternatives in vertical bar charts, with SCA1 appearing tallest.

Figure 9.36 IDS alternative ranking for environmental attributes.

Figure 9.37 IDS alternative ranking for economic attributes.

Figure 9.38 IDS alternative ranking for societal attributes.
Likewise, this finding was intended to be utilized as a new set of alternatives in a comprehensive version of the decision model for the final prioritization. In proceeding with the second-step approach of modeling implementation, the components in each of the three individual decision models (see Figures 9.19–9.21) were incorporated into a larger-scale model with the same condition as previously done in LDW (Figure 9.22). The grading of priority levels for each pair of alternatives and strategy, as provided in Figures 9.30–9.32, were characterized and consolidated with additional grading of new possible combinations between proposed actions and strategies. In the case of attributes’ weight, there is no change in either the selection of assessment method or evaluation of distribution ratios. The task was completed by applying the same sets of weight values through a visual scoring function (see Figures 9.33–9.35). The only additional configuration in the setting at this time was the weight distribution ratios on three NRC targeted objectives. Figure 9.39 presents the adjustments of weight distribution and new utility ratios.

Figure 9.39 IDS weight distribution for the three goals.
By integrating three primary goals and analyzing them as a comprehensive model, the final output in Figure 9.40 shows that the prioritization of proposed actions is ranked as follows: (1) ECA1, (2) EVA2, (3) ECA3, (4) EVA1, (5), ECA4, (6) EVA3, (7) SCA1, (8) SCA2. Comparing this result to the one obtained from LDW, both are the same in terms of the top three and the last two priorities but slightly different in the fourth, fifth, and sixth ranks. With the application of the ER approach, ECA1, EVA2, and ECA3 still rank first, second, and third on the prioritization list. EVA1 and ECA4 scored higher than the previous decision analysis and earned fourth and fifth place.

Figure 9.40 IDS prioritization of the integrated goals.
On the contrary, as EVA1 and ECA4 have pushed themselves one rank up, ECA4 has dropped down to the sixth. While SCA1 and SCA2 are relevant in the decision-making process, they have somehow been outranked by the others, falling to seventh and eighth again.
9.4 Concluding Remarks
At any rate, the earlier analysis can be summarized as follows: to transform Norfolk into a resilient city, there is a need to create economic opportunities in the city, which requires a development plan, capital for job creation, and a technical school and workforce development center that align with existing businesses and future directions. In the meantime, designing the coastal community for the future requires a comprehensive study on flood risk and flooding control before developing integrated flood management solutions and next-generation water management strategies. Both environmental preservation and economic development are correspondingly significant and must be arranged simultaneously. As for societal reformation, connecting the communities, deconcentrating the poverty, and strengthening the neighborhoods are considered just some of the essential elements needed to accomplish an overall goal. The analysis suggests that societal reformation is just a little less vital in execution priority than the others. Even though societal reformation activities are ranked second to last and last in both lists of priority ranking, those indications do not imply that the proposed actions are of less importance or that they should be ignored.
Again in offering a cautionary tale about the articulated analysis, we report a familiar aphorism: “all models are wrong the scientist cannot obtain a ‘correct’ one by excessive elaboration” (Box 1976, p. 792). The engineered analysis is “useful” in the “context” in which it is developed. And those that understand the model can continually improve it.
9.5 Exercises
1 Discuss the importance of MCDA in evaluating and developing resilient cities.
2 Discuss the importance of LDW in evaluating and developing resilient cities.
3 Discuss the importance of IDS assessment in evaluating and developing resilient cities.
4 Identify and discuss other DSS that can enhance the decision-making process for evaluating and developing resilient cities.
5 In the NRS project, the three primary areas of interest are the environment, economy, and society. Discuss whether these are sufficient areas of interest.
References
- Box, G.E.P. (1976). Science and statistics. Journal of the American Statistical Association 71 (356): 791–799. https://doi.org/10.2307/2286841.
- City of Norfolk. (2015). Norfolk Resilience Strategy. The Norfolk City Manager’s Office of Resilience. https://www.norfolk.gov/3612/Office-of-Resilience.
- Georgescu, A., Gheorghe, A.V., Piso, M.-I. et al. (2019). CSI – A Complex System Governance Approach. In: Critical Space Infrastructures: Risk, Resilience and Complexity (eds. A. Georgescu, A.V. Gheorghe, M.-I. Piso et al.), pp. 281–320. Springer International Publishing. https://doi.org/10.1007/978-3-030-12604-9_12.
- Howard, R.A. (1968). The foundations of decision analysis. IEEE Transactions on Systems Science and Cybernetics 4 (3): 211–219. https://doi.org/10.1109/TSSC.1968.300115.
- Kim, H.-M. and Ambler, T. (2002). Using logical decision in DFT method selection. In: Proceedings, IEEE AUTOTESTCON, 634–639. https://doi.org/10.1109/AUTEST.2002.1047945.
- Vasuthanasub, J. (2019). The resilient city: A platform for informed decision-making process. Dissertation, Old Dominion University. https://digitalcommons.odu.edu/emse_etds/151.
- Xu, D.L. and Yang, J.-B. (2005). Intelligent decision system based on the evidential reasoning approach and its applications. Journal of Telecommunications and Information Technology 3: 73–80.
- Xu, D.-L. and Yang, J.-B. (2003). Intelligent decision system for self-assessment. Journal of Multi-Criteria Decision Analysis 12 (1): 43–60. https://onlinelibrary.wiley.com/doi/10.1002/mcda.343.
- Xu, L. and Yang, J.-B. (2001). Introduction to multi-criteria decision making and the evidential reasoning approach (Working Paper No. 106). University of Manchester Institute of Science and Technology.
- Yang, J. and Xu, L. (2004). Intelligent decision system for supplier assessment. In: DSS2004: The 2004 IFIP Conference on Decision Support Systems. Manchester University Press. https://www.research.manchester.ac.uk/portal/en/publications/intelligent-decision-system-for-supplier-assessment(999748c6-ceb6-403c-8a9b-8ed874ee3724)/export.html.
- Yang, J.-B. and Xu, D.-L. (2002). On the evidential reasoning algorithm for multiple attribute decision analysis under uncertainty. IEEE Transactions on Systems, Man, and Cybernetics – Part A: Systems and Humans 32 (3): 289–304. https://doi.org/10.1109/TSMCA.2002.802746.
- Zhou, M., Liu, X.B., and Yang, J.-B. (2010). Evidential reasoning based nonlinear programming model for MCDA under fuzzy weights and utilities. International Journal of Intelligent Systems 25 (1): 31–58.