10
Representing System Complexity Using Object-oriented Programming
10.1 Introduction
Representing complex phenomena – whether in language, film, computer modeling, or other media – affects our understanding and remains a challenge for researchers, even in the twenty-first century (Katina et al. 2020; Steiner 2013). While this chapter does not directly address this challenge, it shows how a complex system can be represented via object-oriented programming (OOP). OOP is a programming paradigm that uses “objects” to design applications and computer programs. This body of knowledge was created based on several concepts and techniques, including abstraction, encapsulation, modularity, and inheritance (see Chapter 7, Section 7.2). In OOP, the objects may contain data, in the form of fields (attributes) and code, in the form of procedures (methods). They can interact with one another by receiving messages, processing data, and sending information to others. Each acts as an independent unit with distinctive roles and responsibilities (Ancel 2011). Overall, the paradigm aims to support the development of efficient data structures and target real-world elements’ behaviors within the digital environment.
The present research uses a specialized tool, “TopEase® Designer,” to handle OOP-related activities. TopEase® Designer software allows the user to manage critical information of focused systems and visualize those entities in a holistic view of a complex system (Pulfer and Schmid 2006). A Swiss company named Action4Value developed the tool. It is a commercial software product intentionally designed to handle business processes and initially used in various fields of the business sector, such as financial institutions, healthcare providers, and real estate firms. The software, which has been used for nearly twenty-five years as a business application tool, comes with the capability to provide methodological procedures to capture a desirable end-state of the organization, company, or enterprise while highlighting the gap between the current “system as is” and desired “system to be” states. The idea behind the development of the software was to establish a balance between principles and pragmatism. This fundamental concept is laid on four axioms:
- 1 – Methodology: The software utilizes only one methodology, which attempts to accomplish its targets or goals based on a pragmatic solution and a balanced manner.
- 2 – Layers: In TopEase®, There are three layers, including definition, support, and implementation. This feature assists the user in obtaining a target audience-related business structure.
- 3 – Models: The models allow inputs and data structures to be modeled, documented, and elaborated. With a system analysis and design through TopEase®, the output can be validated through value chains and questions in case all required elements are modeled appropriately. The five models are business, resource, information, delivery, and change.
- 4 – Questions: This function supports interpreting the connections between three layers and five models. It helps the user to determine and verify interrelationships among nodes and objects that are constructed. These questions are about cost, benefit, risk, quality, feasibility, manageability, and impact.
The recent version of TopEase® offers even more flexibility with powerful features at every step of the analysis and design processes to assist the user in achieving continuous improvements and meaningful results. The tool aims to provide sustainable solutions to system problems by concentrating on the management of system complexity, transparency of data structure, and control of transformation processes. Phase IV of the ReIDMP (Resilient-Informed Decision-Making Process) platform development aims to present the benefits of adopting the OOP paradigm to address and visualize the system’s complexity. Therefore, this chapter focuses on how the OOP-based software approach could be useful in handling emergency management operations as enterprise management processes, mainly through study and investigation.
10.2 Hampton Roads: Critical Infrastructure Resilience
The safety of critical infrastructure (CI) systems is one of the highest priority tasks for national security. Service interruption on any one or more of them due to either man-made threats or natural disasters, such as terrorist attacks, pandemics, hurricanes, and earthquakes, could result in catastrophic failure, not only for the region but also for the entire nation. For example, after 9/11 and Hurricane Katrina, it was obvious that the “protection plans” were insufficient (Georgescu et al. 2019; Gheorghe et al. 2006, 2018; Katina et al. 2014; US Department of Homeland Security 2005, 2009, 2013). It emerged that new paradigms were necessary. For instance, it transpired that there was a need for emphasis on resilience and creating resilient infrastructures that are able to minimize extreme impacts and withstand damages (or disruptions) from both expected and unexpected events. However, the main problem in enhancing the resilience capacity of CI systems is that it requires a comprehensive approach and an appropriate tool to incorporate existing protection plans with emergency preparedness actions.
Security and protection of CI systems have received significant attention and have become a major concern for the United States and nations worldwide (Katina and Keating 2015). Numerous research projects on the risk and vulnerability of CI systems have been funded to address the key issues and find pragmatic solutions. Among those developments, one of the projects, “Critical Infrastructure Resilience for the Hampton Roads Region (CIRHRR),” involved analyzing and assessing the factors that could affect the functionality, reliability, security, and resiliency of four particular CI sectors in the region: energy, water and wastewater, transportation, and communications. The study introduced a strategic risk assessment process using the International Risk Governance Council’s (2017) “Risk Governance Framework” to identify systemic risks of imminent threats or adverse events. It then employed an object-oriented instrument to demonstrate a multi-dimensional complexity of interconnection and interdependence between two or more large-scale infrastructure systems. The project’s goal was to develop high-level risk management on economic and social impacts from identified threats and to create a risk assessment model that can be implemented as standard procedural security and countermeasure for other regions.
Hampton Roads is a region consisting of a body of water and the surrounding metropolitan areas in the southeastern United States. The area comprises sixteen jurisdictions, including nine cities and seven counties, with a population of over 1.7 million. Hampton Roads has a unique characteristic and is highly critical to national security. It is home to the world’s largest naval complex station and the second-largest port on the Atlantic Coast. Besides its prominence as the economic hub and one of the US military strongholds, the region’s location is low-lying in terms of geographic condition, so it is more susceptible to floods and vulnerable to the effects of seasonal hurricanes and occasional tornadoes. Taking those characteristics and identities of a region into consideration, the Port of Hampton Roads, also officially known as “Port of Virginia,” is a key CI in the Hampton Roads region (Gheorghe et al. 2008). Concerning the Port of Virginia, it is a natural deep-water harbor with a depth of 50 feet with unobstructed channels and berths. Consequently, an autonomous agency is the only major operating port on the US east coast that receives congressional authorization for 55-feet depth channels (Virginia Port Authority 2017). It is located just 2.5 hours from the open sea and operates on a year-round schedule due to ice-free conditions. Most activities and services are facilitated by a total of 22 Suez-class ship-to-shore cranes port-wide and almost 7 miles of on-dock rail track (Virginia Port Authority 2018).
Furthermore, there are four principal facilities: Norfolk International Terminals (NIT), Portsmouth Marine Terminal (PMT), Newport News Marine Terminal (NNMT), and Virginia International Gateway (VIG). The waterways and coastal areas are occupied with military assets, nuclear power plants, oil refineries, fuel tanks, pipelines, chemical plants, cargo terminals, and passenger terminals. The very nature of these systems suggests that they have inherent security vulnerabilities (Gheorghe et al. 2008; Vamanu et al. 2016). Each facility is relatively spacious and easily accessible by water and land. The terminal is also located in the crowded industrial zone and connected with a transportation network that stretches throughout the nearby metropolitan areas, including Norfolk, Portsmouth, Newport News, Hampton, Virginia Beach, Chesapeake, and Suffolk (US Department of Homeland Security 2005). This transportation system consists of infrastructures and assets, such as roads, railroads, bridges, tunnels, and hundreds of highway miles. Under these circumstances, the bridges and tunnels are considered vulnerable spots in the area, which pose a significant threat during any emergency and crisis situation (Gheorghe et al. 2008).
As a CI and key resource, the Port of Virginia is a vital part of the complex systems necessary for public well-being, national security, and the global economy. The port and its facilities along with the vessels and barges that sail through the harbor of Hampton Roads are indispensable components in supporting the free movement of goods and passengers into and out of the United States and the world. Some physical and virtual assets of the port and other associated infrastructures are also tied to the resistance function and countermeasure ability of the US defense infrastructure systems. A single unexpected attack by terrorists on one or more parts of this CI may cause temporary disruption, massive casualties, or economic damages. In the worst-case scenario, the action could even result in catastrophic failure of the entire system (US Department of Homeland Security 2005). In addition to man-made threats, natural disasters are another threat in Hampton Roads, a region that borders the Atlantic Ocean. So much so that the region is no stranger to storm surges and flash floods. In this area, most flooding is the result of surges, heavy rains, rainstorms, or hurricanes. These events have been known to bring traffic to a grinding halt and to affect underpasses, tunnels, and bridges, which can lead to activity discontinuation and service interruptions between the main facilities and branch locations. As a result, the availability of the Port of Virginia must be constantly assured for national security operations. Addressing the risks and mitigating their potential impacts should remain a priority for the general public, Hampton Roads policy, and decision-makers.
10.3 CIRHRR Through TopEase® Designer Implementation
In this section, the US Department of Homeland Security’s funded project, “CIRHRR” (Critical Infrastructure Resilience for the Hampton Roads Region), is used as a test case for implementation using TopEase® Designer. First, we suggest that resilient infrastructures include components, facilities, assets, or systems, whether physical or virtual, that can withstand disruption and damage but, if affected, can be readily recovered or cost-effectively restored (Gheorghe et al. 2008). Second, to establish a regional disaster mitigation, response, and recovery plan as well as enhance regional security and resiliency of Hampton Roads, a complex set of management and policy issues have to be addressed. Third, a complete list of critical assets and essential public and private resources must be integrated as a regional model. Finally, all involved facilities, relationships among them, and their dependencies over one another must also be analyzed to determine the capabilities of response and recovery in each of the jurisdictions during emergencies (Gheorghe et al. 2008). Moreover, with the complication of diversity in local authorities, federal agencies, and private organizations in multiple jurisdictions, the City of Hampton was selected as a model city to develop its Emergency Operation Plan (EOP). The idea of using TopEase® in the CIRHRR project is to convert the EOP of the City of Hampton into a digital model for illustrating the interdependencies among CI systems.
Again, the Hampton Roads region has unique characteristics and is strategically critical to national security, especially the economy and military. For this reason, multiple jurisdictions, military assets, and private utility facilities require an analytical solution through the system of system technology. To analyze the current state of an emergency plan, the process was initiated within TopEase® by outlining four primary CI systems as layers. Each represents a specific sector and selected infrastructures, including electric power, water and wastewater, transportation and military, and communication. Figure 10.1 depicts the primary CI sectors as layers. The functionalities of these integrated CI layers and EOP against different threats are cross-cut as predefined issues. Figure 10.2 depicts the selected CI systems and their associated threats.

Figure 10.1 The six primary CI sectors for analysis.

Figure 10.2 Selected CI and their associated threat.
The next example of implementation is modeling the organizational chart and the visualization of complexity among entities. At this point, it should be noted that when using TopEase® to develop models, every output result needs the input data. In other words, the user must enter all details and information and construct the data structure to generate the models. Figure 10.3 depicts the data structure of the organization – accounting for employees, roles, and responsibilities. TopEase® uses this data to produce a graphical output model that shows the relationship between objects and the complexity of emergency management in a process support diagram, as shown in Figure 10.4.

Figure 10.3 A data structure with employees, roles, and responsibilities.

Figure 10.4 Process support diagram of emergency management complexity.
Regarding the implementation of this organization chart, the software also provides the RACI matrix feature to support the user in evaluating the characteristics and responsibilities of various positions in the organization chart. In TopEase®, “RACI” refers to Responsible, Accountable, Concerned, and Informed. The overall RACI matrix is depicted in Figure 10.5. This function facilitates the process by mapping all detail and information in the data structure, which allows the user to analyze the entire organization chart and to identify the influence factors and interdependencies among the objects. For example, Figure 10.6 depicts RACI Matrix Function Wizard for “Responsible.” While Figure 10.7 illustrates RACI Matrix Function Wizard for “Informed.”

Figure 10.5 The overall RACI matrix output.
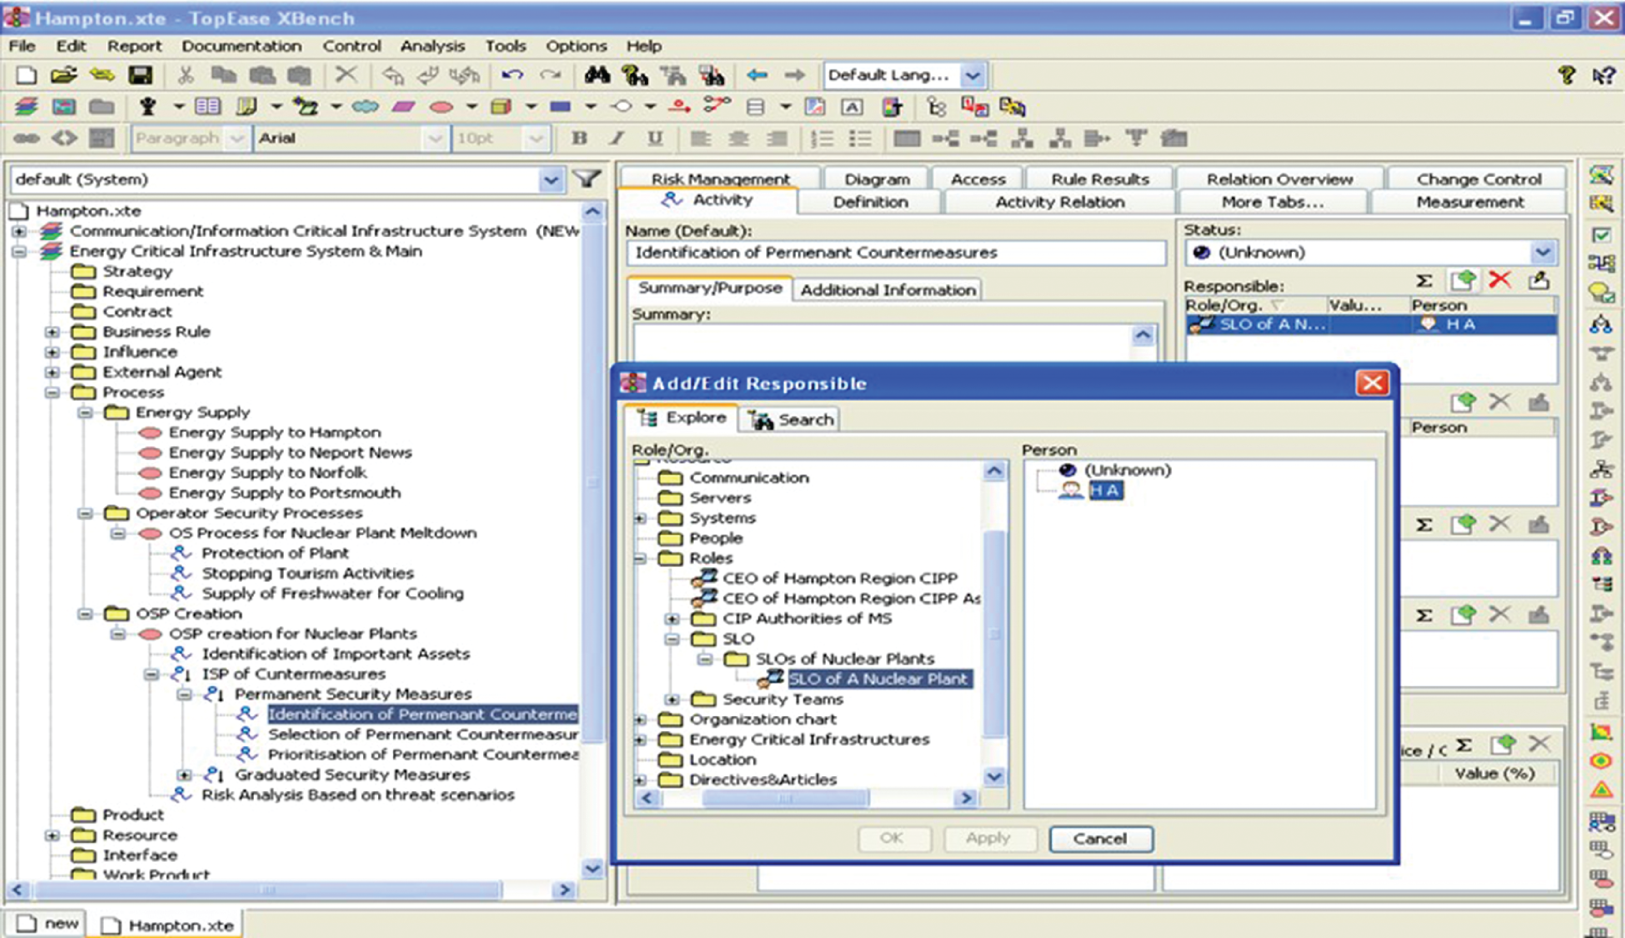
Figure 10.6 The “Responsible” RACI Matrix Function Wizard.

Figure 10.7 The “Informed” RACI Matrix Function Wizard.
In complex situations, managing emergency operations is not for the lazy. For example, delayed responses – for example, due to overlapping authority and uncleared instructions – to incidents in minutes (or seconds) could lead to costly consequences. The plan must identify and include all possible external factors to avoid unnecessary confusion and errors. In CIRHRR, this step has incorporated additional information, such as the explanatory glossary, detail activities, process life cycle, influence agents, and reference database, which were directly adapted from the EOP of the City of Hampton into the TopEase®. Examples of additional information are depicted in Figure 10.8 (external agents), Figure 10.9 (explanatory glossary), Figure 10.10 (reference database), Figure 10.11 (influence), and Figure 10.12 (sub-activities).
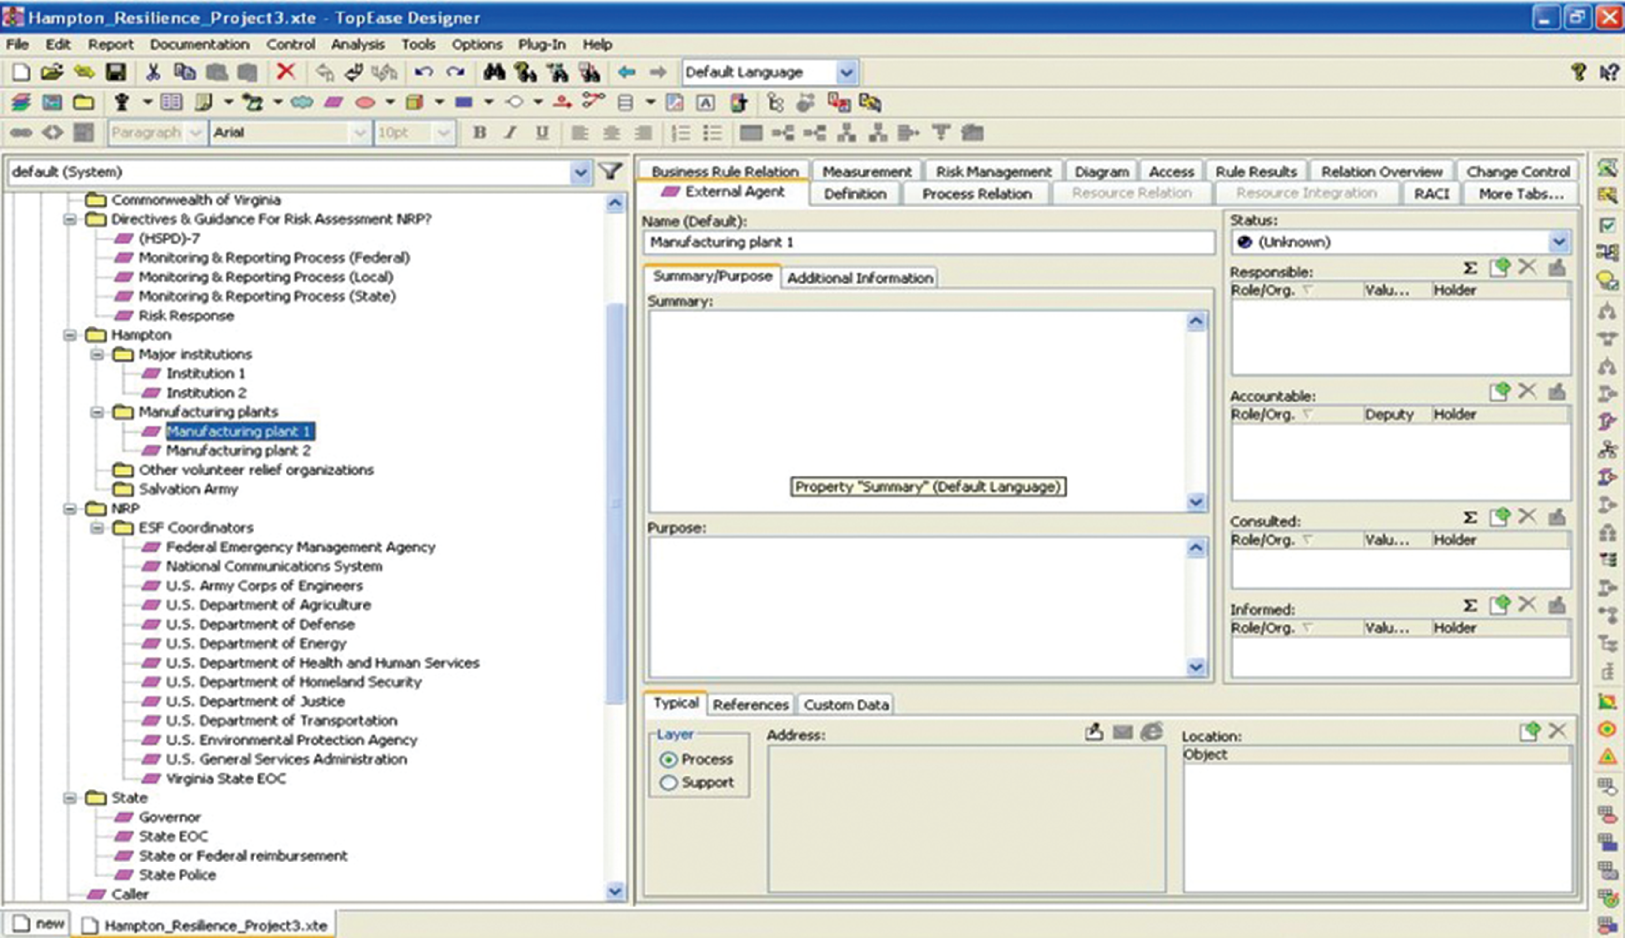
Figure 10.8 Data structure for additional information (external agents).

Figure 10.9 Data structure for additional information (explanatory glossary).

Figure 10.10 Data structure for additional information (reference database).

Figure 10.11 Data structure for additional information (influence).

Figure 10.12 Data structure for additional information (Sub-Activities).
The aforementioned additional data structures allow the software to create an inclusive visualization of a model that includes activities, processes, roles, responsibilities, and people in the same diagram. Figure 10.13 is a partial example of a visual output depicting activities, processes, roles, and responsibilities.

Figure 10.13 Visualization diagram of activities, processes, roles, and responsibilities.
In addition to the capability of creating models and graphic representations, TopEase® also comes with the risk catalog function. This feature can handle any definable risk to the system that is being analyzed and modeled. In TopEase®, the risk is defined by two parameters: likelihood and impact (Gheorghe et al. 2008; Vasuthanasub 2019). Table 10.1 depicts scales associated with risk in the software.
Table 10.1 Likelihood and impact categories for TopEase®.
| Likelihood ranking | Impact severity | ||||
|---|---|---|---|---|---|
| Description | Frequency of occurring event | Probability of 1-off event | Description | Safety | Security |
| Improbable | Once every 10,000 years | 1 in 1,000 | Minor | Minor injuries | Minor breach |
| Remote | Once every 1,000 years | 1 in 100 | Moderate | Major injuries | Major breach |
| Occasional | Once every 100 years | 1 in 10 | Significant | Single fatality | |
| Probable | Once every 10 years | Likely | Substantial | Multiple fatalities (10+) | |
| Frequent | Once every year | Certain | Mega | Multiple fatalities (100+) | |
The results suggest that Hampton Roads is vulnerable to man-made disasters and natural catastrophes. For example, Figure 10.14 depicts the region’s overall landscape of disaster risk. In the study, the risk numbers for different disasters are generic (thus the approach and model are adaptable to new sources of data). These numbers are the basis for the effects on CI operations. Figure 10.15 depicts the disaster “earthquake” being applied to different energy-critical systems (i.e. nuclear power plants) in the region.

Figure 10.14 A risk template for overall disaster risk.

Figure 10.15 A risk template for “earthquake” applied nuclear power plants.
There are different ways of representing risk (e.g. risk matrix or interdependency diagram). For example, Figure 10.16 shows the likelihood of different types of disasters (i.e. a cyber attack, an industrial accident, a meltdown, and an earthquake) happening in the same nuclear power plant. As expected, a scenario would be catastrophic. Figure 10.17 provides another way of viewing the same scenario.

Figure 10.16 Scoring multiple risks affecting one CI.

Figure 10.17 A different view of multiple risks affecting one CI.
10.4 Concluding Remarks
Object-oriented programming (OOP) is a programming paradigm that uses “objects” to design applications and computer programs. TopEase® Designer implements the OOP approach by allowing the user to manage critical information of focused systems and visualize those entities in a holistic view of a complex system. Several conclusions can be drawn from the application in this chapter. However, emphasizing the idea most pertinent to the present research, TopEase® OOP analysis suggests that Hampton Roads is vulnerable to man-made disasters and natural catastrophes. In TopEase®, the assigned risk can be represented with different options, including a risk matrix and interdependency diagram. Moreover, it was possible to generate different kinds of disasters.
While TopEase® is not free of technical issues, there remains a need for research that can take advantage of the additional features of the TopEase® OOP approach. Additional features include:
- New web architecture for enhanced WebExplorer functionality – TopEase® V6.3. comes with a new web architecture based on AJAX and JavaServer Faces (JSF). With the new web architecture, various interactive features, such as dynamic filters, editing of texts and data, creation of object relations, web graphics editor, etc., were integrated into the TopEase WebExplorer.
- New toolbars in the WebExplorer – Toolbars in the WebExplorer provide access to various interactive functions such as creating and modifying charts, changing text, creating and modifying RACI relationships, entering values, making comments, etc.
- The graphic editor is now also available in the WebExplorer – TopEase users who have not installed TopEase designer on their system can now create or modify charts employing the graphic web editor, which is integrated into the WebExplorer.
- Advanced TopEase MyZone – TopEase MyZone comes with an additional tab for all objects where the user is registered as responsible, accountable, or consulting and with a tab for all organizational units in which the user is registered as a member.
- Graphical representation and modeling of class diagrams – Class diagrams, modeled in TopEase® Designer, can now be displayed in UML-compliant notation in TopEase® Designer and WebExplorer. Modeling changes are easy to perform through the use of the integrated graphics editor.
10.5 Exercises
1 Discuss the importance of OOP in evaluating and developing resilient cities.
2 What aspects of critical interdependent infrastructure systems are difficult to implement using OOP and why?
3 Identify and discuss a city of your choice from a CI viewpoint.
4 Discuss the importance of TopEase® in evaluating and developing resilient cities.
5 What aspects of TopEase® are critical in evaluating and developing resilient cities?
References
- Ancel, E. (2011). A Systemic Approach to Next Generation Infrastructure Data Elicitation and Planning Using Serious Gaming Methods. PhD, Old Dominion University. http://search.proquest.com.proxy.lib.odu.edu/docview/896960555/abstract/C4484A36FA444018PQ/5.
- Georgescu, A., Gheorghe, A.V., Piso, M.-I. et al. (2019). Critical Space Infrastructures: Risk, Resilience and Complexity. Springer International Publishing. https://www.springer.com/us/book/9783030126032.
- Gheorghe, A., Vamanu, D.V., Katina, P. et al. (2018). Critical Infrastructures, Key Resources, Key Assets: Risk, Vulnerability, Resilience, Fragility, and Perception Governance (Vol. 34). Springer International Publishing. https://www.springer.com/us/book/9783319692234.
- Gheorghe, A.V., Masera, M., Weijnen, M.P.C et al. (eds.). (2006). Critical Infrastructures at Risk: Securing the European Electric Power System (Vol. 9). Springer.
- Gheorghe, A.V., Tokgoz, B.E., Cakir, V. et al. (2008). Critical Infrastructure Resilience for the Hampton Roads Region: Policy Analysis for Regional Resilience. Internal Report, Department of Engineering Management and Systems Engineering, Old Dominion University.
- International Risk Governance Council. (2017). Introduction to the IRGC Risk Governance Framework: Revised Version. International Risk Governance Center. https://irgc.org/risk-governance/irgc-risk-governance-framework.
- Katina, P.F. and Keating, C.B. (2015). Critical infrastructures: A perspective from systems of systems. International Journal of Critical Infrastructures 11 (4): 316–344. https://doi.org/10.1504/IJCIS.2015.073840.
- Katina, P.F., Pinto, C.A., Bradley, J.M. et al. (2014). Interdependency-induced risk with applications to healthcare. International Journal of Critical Infrastructure Protection 7 (1): 12–26. https://doi.org/10.1016/j.ijcip.2014.01.005.
- Katina, P.F., Tolk, A., Keating, C.B. et al. (2020). Modelling and simulation in complex system governance. International Journal of System of Systems Engineering 10 (3): 262–292. https://doi.org/10.1504/IJSSE.2020.109739.
- Pulfer, R. and Schmid, U. (2006). Control Your Business: The Balance Between Principles and Pragmatism. Pulinco.
- Steiner, F. (2013). Representing Complexity. Landscape Architecture Frontiers 1 (6): 44–63. https://journal.hep.com.cn/laf/EN/Y2013/V1/I6/44.
- US Department of Homeland Security. (2005). The National Strategy for Maritime Security. The White House. https://www.hsdl.org/?view&did=456414.
- US Department of Homeland Security. (2009). NIPP 2009: Partnering for Critical Infrastructure Security and Resilience. US Department of Homeland Security. https://www.cisa.gov/publication/nipp-2009-partnering-enhance-protection-resiliency?topics=all.
- US Department of Homeland Security. (2013). NIPP 2013: Partnering for Critical Infrastructure Security and Resilience. US Department of Homeland Security. https://www.dhs.gov/publication/nipp-2013-partnering-critical-infrastructure-security-and-resilience?topics=all.
- Vamanu, B.I., Gheorghe, A.V., and Katina, P.F. (2016). Critical Infrastructures: Risk and Vulnerability Assessment in Transportation of Dangerous Goods: Transportation by Road and Rail. Springer International Publishing. https://www.springer.com/us/book/9783319309293.
- Vasuthanasub, J. (2019). The Resilient City: A Platform for Informed Decision-making Process. Dissertation, Old Dominion University. https://digitalcommons.odu.edu/emse_etds/151.
- Virginia Port Authority. (2017). Big-Ship Ready: Fiscal Year 2017 Annual Report. Virginia Port Authority. http://www.portofvirginia.com/wp-content/uploads/2017/11/The-Port-of-Virginia-FY17-Annual-Report.pdf.
- Virginia Port Authority. (2018). Capabilities. Virginia Port Authority. https://www.portofvirginia.com/capabilities.