
In civil engineering, points are the foundation of all geometry—both existing and design. When a project is started, points are often used to represent ground elevations, feature locations, property corners, and other critical elements. When working through a project, a designer might set points to assist with grading or to mark special areas. Finally, the project cannot be built in the field without a survey crew marking out the design through a list of points from the engineer.
This chapter includes the following topics:
Importing points from a text file
Creating point groups
Changing a point elevation
Creating points at parcel corners
Creating points at alignment and profile geometry points
Creating tree points along an alignment
Organizing stakeout points with point groups
Creating a point table
Exporting stakeout points
At the beginning of a project, you are often presented with a text file listing point numbers, northings, eastings, elevations, and descriptions (see Figure 5.1). This file may come from an outside surveyor or GPS—or perhaps your own crew doesn't take advantage of the survey tools discussed in Chapter 4, "Survey." Civil 3D provides tools for working with these coordinate geometry (COGO) points. The next few exercises focus on giving you hands-on practice with importing, manipulating, organizing, and stylizing points from a text file.
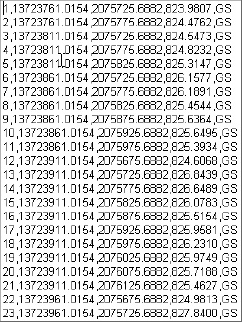
Figure 5.1. A typical text file of point locations in Point Number, Northing, Easting, Elevation, Description (PNEZD) format
Although most firms are striving to make their survey processes more automatic, starting a project with a text file of points downloaded from a data collector is still the most common way to begin a project. These points will be the foundation for linework—such as curbs, centerlines, and property boundaries—as well as for building surfaces. The following exercise leads you through importing a PNEZD file of points:
Open the drawing file
Points1.dwg, which you can download fromwww.sybex.com/go/introducingcivil3d2010. It is an empty drawing, but it has a surface object already set up, ready to be filled with data.From the Insert tab and Import panel on the ribbon, select Points from File. The Import Points dialog will appear.
In the Import Points dialog, confirm that the PNEZD (comma delimited) format is selected.
Click the plus sign (+). The Select Source File dialog will appear.
In the Select Source File dialog, navigate to the
IntroducingPoints.txtfile. Select the file and click Open.Back in the Import Points dialog, uncheck the Do Elevation Adjustment If Possible box. The dialog should look like Figure 5.2. Note that your path will vary depending on where you saved the data.
Click OK. The points will appear in the drawing as red Xs without labels, as shown in Figure 5.3.
Locate the Points entry on the Prospector tab of the Toolspace, as shown in Figure 5.4. Select the Points entry.
Look at the bottom half of the Prospector and locate the item view that lists all of the points in the drawing.
Scroll down to the entry for point number 408, as shown in Figure 5.5. Select the entry, and right-click. A context-specific shortcut menu will appear. Choose Zoom To. The drawing will zoom in on point 408.
Hover your cursor over the point on the screen. Note that a tooltip appears with point information, as shown in Figure 5.6.


After the points are imported, they must be organized and annotated. Although it may occasionally be useful to have points simply marked with an X, most designers will want some labeling to help identify the points. The following exercise leads you through using the _All Points group to assign a label style to the newly imported points:
Continue working in the drawing from the previous exercise, or open the
Points2.dwg.Locate the Point Groups entry on the Prospector tab of the Toolspace. Expand the entry. The _All Points group will appear in the tree.
Right-click the _All Points group, and choose Properties. The Point Group Properties dialog appears.
In the Point Group Properties dialog, use the Point Label Style pull-down list to choose Point#-Elevation-Description.
Click OK.
All of the points in the drawing now have the Point#-Elevation-Description label style assigned.
Labeling is a great way to display the information that was captured during the field work, but it is often not enough. Special points representing hydrants, shrubs, manholes, guy poles, and other features require an appropriate symbol.
In the following exercise, you use point groups to assign a point style to points based on their descriptions:
Continue working in
Points2.dwg.Locate the Point Groups entry on the Prospector. Right-click the Point Groups entry and choose New. The Point Group Properties dialog appears.
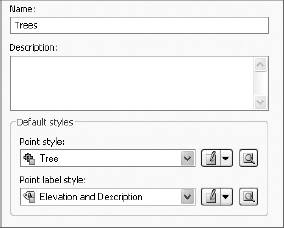
Change the Name of the point group from the default to Trees.
Use the Point Style pull-down list to choose Tree, and use the Point Label Style pull-down list to choose Elevation and Description. The dialog should now look like Figure 5.7.
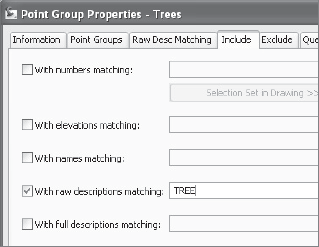
Switch to the Include tab. Check the With Raw Description Matching box, and type TREE in the empty field, as shown in Figure 5.8. Note that this field is not case-sensitive!
Click OK.
All of the points in the Trees group will now have the tree style and the Elevation and Description label style applied, as shown in Figure 5.9.

In addition to organizing points into groups to assist with their visual appearance, it is a good idea to create groups to sort points that will be edited together or perhaps used for certain linework. This could include creating points for edge-of-pavement shots, stream-course centerlines, property corners, or other similar, meaningful groups. The following example sorts some ditch top-of-bank points into their own group so that they can be visually isolated from the other drawing points to make linework creation easier.
Continue working in the
Points2.dwgfile.Locate the Point Groups entry on the Prospector. Right-click the Point Groups entry and choose New.
Change the Name of the point group to Top of Bank.
Use the Point Style pull-down list to choose Basic. Use the Point Label Style pull-down list to choose Elevation and Description.
Switch to the Include tab. Check the With Raw Description Matching box, and type TOB in the empty field.
Click OK.
All of the TOB points in the northeast portion of the site are now in the Top of Bank point group.
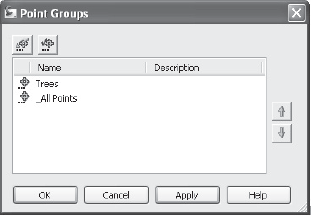
Figure 5.10. Point groups can be moved up or down the hierarchy to determine which group controls the visual appearance of points.
A point can belong to multiple point groups, which at first glance might seem confusing. How does the point know which style to use if the two groups have different styles assigned? In the previous exercise, how did the tree points know they should appear as trees and not the style assigned to the _All Points group? Figure 5.10 illustrates the point group appearance hierarchy that will be used several times in the next few exercises. The groups that are higher on the list control the appearance over point groups that are lower on the list.
The following exercise will lead you through changing the Point Group hierarchy for controlling point group visibility:
Continue working in the
Points2.dwgfile.Locate the _All Points group on the Prospector. Right-click and choose Properties. The Point Group Properties dialog will appear.
In the Point Group Properties dialog, use the pull-down lists to change the Point Style to <none> and the Point Label style to <none>. Click OK. Most of the points in the drawing become invisible, except the Trees group and the Top of Bank group, as shown in Figure 5.11.
Locate the Point Groups entry on the Prospector. Right-click and choose Properties. The Point Groups dialog appears.
Use the up arrow to move the _All Points group to the top of the list that appears in the Point Groups dialog, as shown in Figure 5.12. Click OK. All of the points in the drawing become invisible.
Repeat step 4 to bring up the Point Groups dialog. Use the up arrow to move the Top of Bank group above the _All Points group. Click OK. The Top of Bank group appears in the drawing. This would be handy for creating linework for the Top of Bank points without having to sort through all of the rest of the ground shots.


After points have been imported, it is fairly common to find a mistake. Perhaps the surveyors mistyped a description in the field, or an elevation got an extra digit. Civil 3D makes it easy to edit points. Any changes made to the point will immediately be reflected in the point labeling and Prospector information.
Points can be moved, copied, erased, or aligned using standard AutoCAD commands. Points can also be rotated using a special grip that appears when the point is selected, as shown in Figure 5.13.

Point information such as elevation and raw description can also be edited in the Item View in Prospector and in the AutoCAD Properties window.
The following exercise shows you how to use Panorama to edit a point elevation.
Continue working in the drawing from the previous exercise, or open the
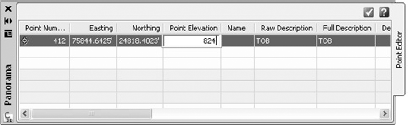
Points3.dwg.Locate the Points entry on the Prospector. Use the item view at the bottom of Prospector to scroll down to point number 412. Right-click the entry for 412, and choose Zoom To. The drawing will zoom in on point 412, which has an elevation of 823.58, as shown in Figure 5.14. (The point number is not visible in the label.)
Select the point, right-click, and choose Edit Points. The Panorama window appears with the point information displayed.
Click inside the Point Elevation field, and change the point elevation from 823.578′ to 824′, as shown in Figure 5.15. Dismiss the Panorama. Note that the point label has adjusted to match the value entered in Panorama.

Points often serve as the foundation for a project's beginnings, but they are also critical for taking a drawing from being an abstract idea on the computer to being actively created in the field.
After the plan is complete, there are many point-creation tools for creating the stakeout locations required by the field crew. This section describes several of the most common stakeout requirements.
One of the elements of a site plan that requires staking is property corners. It is incredibly important to accurately set property corners to avoid potential disputes between homeowners, easement issues, or other costly confusion. Often, these points are set without elevation information—they are simply a horizontal location.
The following exercise leads you through using point tools and the finished parcels to create stakeout information:
Open the
Points4.dwgfile. This drawing contains parcels, alignments, profiles, a surface, and more for a subdivision plan, as shown in Figure 5.16. Also note that although there are no points in the drawing, there is already a Trees point group.From the Home tab and Create Ground Data panel on the ribbon, select Points → Point Creation Tools. The Create Points toolbar will appear.
Click the chevrons button on the far-right side of the Create Points toolbar to expand the parameter options, as shown in Figure 5.17.
Click the plus sign (+) sign next to Points Creation to expose additional options.
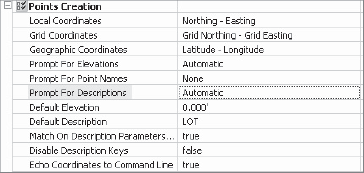
Click inside the field next to Prompt for Elevations. If necessary, use the pull-down list to change the setting from Manual to None.
Click inside the field next to Prompt for Descriptions. This setting should be set to Automatic.
Click inside the field next to Default Description. Change the default description by typing LOT. The parameters should appear similar to Figure 5.18.
Click the chevrons button on the far-right side of the Create Points dialog to roll up the parameter options.
Click the arrow on the leftmost button on the Create Points dialog and choose Automatic.
At the
Select arcs, lines, lot lines, or feature lines:prompt, zoom in on the any of the right-of-way segments in the drawing and select it. Press Enter.Points will appear at each parcel corner and vertex along the right-of-way parcel segments.
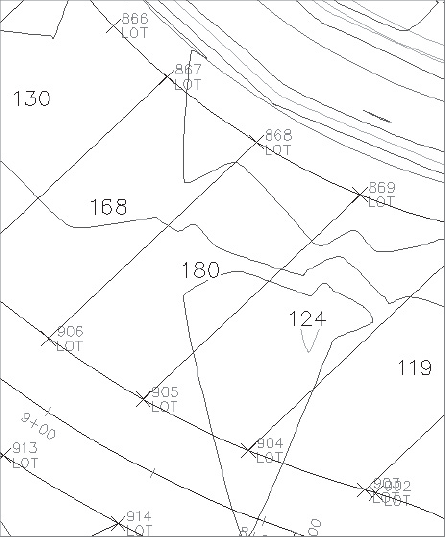
Repeat steps 9 and 10, except this time choose a rear parcel segment instead of the right-of-way.
Points will appear at each parcel corner and vertex along the rear lot lines, as shown in Figure 5.19.


There are several points along a road centerline that must be carefully noted. From a horizontal design perspective, the northings and eastings of points of curvature, tangency, and intersection are required to properly create curves in the field. For vertical curves, the locations and elevations of points of vertical curvature, tangency, and intersection are necessary. After an alignment and its associated finished grade profile have been created, this information is easy to access.
The following exercise leads you through setting points that mark the locations of horizontal curve points as well as the location of vertical curve points and their elevations:
Continue working in the
Points4.dwgfile.If the Create Points dialog is not already on the screen, from the Home tab and Create Ground Data panel on the ribbon, select Points → Point Creation Tools. The Create Points dialog will appear.
Click the chevrons button on the far-right side of the Create Points dialog to expand the parameter options.
Click the plus sign (+) next to Points Creation to expose additional options.
Confirm that Prompt for Elevations is set as None.
Confirm that Prompt for Descriptions is set as Automatic. If necessary, use the pull-down list to change the setting from Manual to Automatic.
Click inside the field next to Default Description. Change the default description by typing ROAD.
Click the chevrons button on the far-right side of the Create Points dialog to roll up the parameter options.
Click the arrow on the third button from the left in the Create Points dialog and choose At Geometry Points.
At the
Select alignment:prompt, select the alignment that runs down the main road (Timber Haven). The Select a Profile dialog will appear.Leave the selection as <none> in the Select a Profile dialog, and click OK.
At the
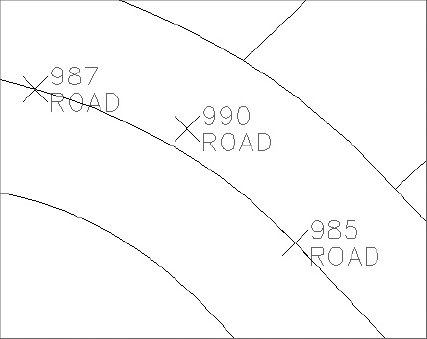
Starting station <0+00>:prompt, press Enter.At the
Starting station <10+31.40>:prompt, press Enter.Points will appear at the PC, PI, PT, and other alignment geometry points, as shown in Figure 5.20.
Click the arrow on the third button from the left in the Create Points dialog and choose Profile Geometry Points.
At the
Select alignment:prompt, select the alignment that runs down the main road (Timber Haven). The Select a Profile dialog will appear.At the
Starting station <0+00>:prompt, press Enter.At the
Starting station <10+31.40>:prompt, press Enter.Points will appear in the drawing at PVC, PVT, PVI, and other profile geometry points. The elevation information was extracted from the finished ground profile, which can be inspected on the right side of the site plan.
Special features (such as trees, light posts, hydrants, poles, and fencing) also need to be staked. These types of points may also include elevation information from a design surface.
You can use several different tools to create points along an alignment task, including the Measure Alignment Points command, which places points at a set interval along an alignment. The following exercise uses the Divide Alignment command, which prompts for a number of segments and determines out how far apart the points need to be:
Continue working in the
Points4.dwgfile.If the Create Points dialog is not already on the screen, from the Home tab and Create Ground Data panel on the ribbon, select Points → Point Creation Tools. The Create Points dialog will appear.
Click the chevrons button on the far-right side of the Create Points dialog to expand the parameter options.
Use the plus sign (+) next to Points Creation to expose additional options.
Confirm that Prompt for Elevations is set as None.
Confirm that Prompt for Descriptions is set as Automatic.
Click inside the field next to Default Description. Change the default description by typing TREE.
Click the chevrons on the far-right side of the Create Points dialog to roll up the parameter options.
Click the arrow on the third button from the left in the Create Points dialog and choose Divide Alignment.
At the
Select alignment:prompt, select the alignment that runs down the main road (Timber Haven). The Select a Profile for Timber Haven dialog will appear.In the Select a Profile dialog, leave the selection as <none> and click OK.
At the
Enter the number of segments <1>:prompt, type 25 and press Enter.At the
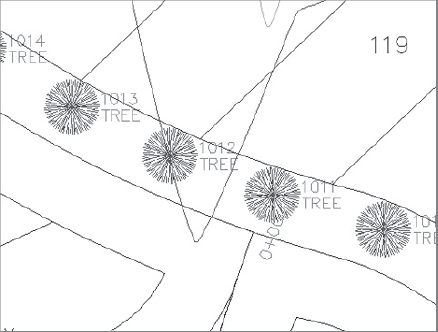
Specify an offset <0.00>:prompt, type 15 and press Enter.Points with the description of TREE will appear at regular intervals along the alignment. If desired, you can repeat steps 9 through 13 for the other side of the road, using a −15 offset.
If the tree points do not automatically appear as trees, locate the Trees point group on the Prospector. Note that there is a yellow exclamation point next to the group, as shown in Figure 5.21.
Select the Trees point group, right-click, and choose Update.
The tree points will now use the style assigned in the Trees point group, as shown in Figure 5.22.
From the Modify tab and Ground Data panel on the ribbon, select Points. A new contextual tab called COGO Point will appear. In the Modify panel, select the Elevations from Surface icon. The Select surface dialog will appear.
In the Select Surface dialog, use the pull-down list to choose the Existing Ground surface. Click OK.
At the
Points [All/Numbers/Group/Selection]<All>:prompt, type G for group and press Enter. The Point Groups dialog will appear.In the Point Groups dialog, choose the Trees group. Click OK.
The tree points in the drawing now have an elevation assigned from the surface, as shown in Figure 5.23.

You will probably create many points during a project. There are existing points, proposed points, points used in grading, points used for reference, and finally, the stakeout points. It wouldn't make sense to export the entire list of points from the drawing when some of them weren't created with stakeout in mind.
Throughout this chapter, many uses for point groups have been discussed from both an aesthetic and organizational standpoint. In the following exercise, you will build a point group to contain all of the different types of stakeout points created so far in this chapter:
Continue working in the
Points4.dwgfile, or openPoints5.dwg(which you can download fromwww.sybex.com/go/introducingcivil3d2010).Locate the Point Groups entry on the Prospector. Right-click the Point Groups entry and choose New. The Point Group Properties dialog appears.
Change the Name of the point group from the default to Lot Corners.
Confirm that the Point Style is set to Basic, and the Label Style is set to choose Elevation and Description.
Switch to the Include tab. Check the With Raw Description Matching box, and type LOT in the empty field.
Click OK. All of the Parcel corner points are grouped together.
Repeat steps 2 through 6 to create a point group for the Road Points, using ROAD in the Raw Description Matching field.
Locate the Point Groups entry on the Prospector. Right-click the Point Groups entry and choose New. The Point Group Properties dialog appears.
Change the Name of the point group from the default to Stakeout Points.
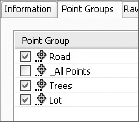
Switch to the Point Groups tab. Check the boxes next to the Road, Trees, and Lot point groups, as shown in Figure 5.24.
Click OK. A new point group is created that contains the points from all three types of stakeout points you created.
Sometimes it is appropriate to create a point table to list certain points in the drawing. Perhaps the local municipality requires a detailed list of hydrant placements or a breakdown of wetlands flags locations. In the following example, you create a dynamic point table for the stakeout points you've created so far:
Continue working in
Points5.dwg.From the Annotate tab and the Labels & Tables panel on the ribbon, choose Add Tables → Add Point Table. The Point Table Creation dialog appears.
Click the Select Point Group button. The Point Groups dialog appears as shown in Figure 5.25
Choose the Stakeout Points group. Click OK.
At the
Select upper left corner:prompt, select a location on the right of the site plan.
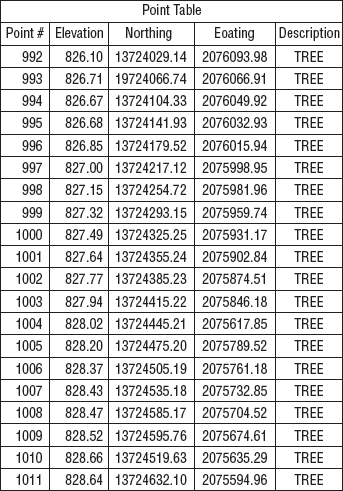
Point tables appear in the drawing, similar to Figure 5.26. These tables will dynamically update if the points are edited, or if more points are added to the stakeout group.

After points have been set at all of the necessary locations, the information can be exported for use by the survey crew, or perhaps to be imported into a new project or sent out to a subcontractor.
The following exercise shows you how to quickly create a text file to export the stakeout point group:
Continue working in
Points5.dwg.Locate the Stakeout point group in the Prospector and Points Group. Right-click the Stakeout entry and choose Export Points. The Export Points dialog appears.
In the Export Points dialog, confirm that the Format is set to PNEZD (comma delimited).
Click the File button. The Select Destination File dialog appears.
Navigate to any folder on your computer that can receive the text file. Type Stakeout in the File Name field, and click Open.
Back in the Export Points dialog, note that the box next to Limit to Points in Point Group is checked. Confirm that the Advanced Options are all unchecked. Click OK.
A text file is created in the folder of your choosing. This file can be imported into another drawing, or other software that supports text imports.
In this chapter, you learned about some of the tools available for working with points. You learned how to import points from a text file, edit their elevations, and then use point groups to organize and control visibility. You also learned several methods for creating common stakeout points after the design is complete, and you practiced the skills necessary to create dynamic point tables and export a text file of critical points.