
Audience Research in Advertising
Throughout this book we have stressed that the business of commercial television is to sell audiences to advertisers. But, unlike subscription newspapers and magazines, electronic media do not have circulation numbers to tell them who is using their product. Instead, they depend on research firms to estimate the size and composition of “their” audiences. These estimates, the ratings, are the principal information used by media and advertisers to determine the monetary value of television time.
Advertisers are interested in capturing the attention of the viewer or listener to convey some message. The message might be as simple as introducing people to a new brand or reminding them of an old one, or it might involve trying to change their attitudes toward a person or product. Often advertisers attempt to influence viewer behavior on some level—from mundane product purchases to voting for a specific political candidate. Whatever the purpose, advertisers need access to audiences, if only for a moment, and they pay the media for this opportunity.
The need of advertisers to buy audiences, and the eagerness of broadcasters to sell them, brought the ratings services into being. As a consequence, advertisers have an enormous stake in the audience measurement business and wield considerable influence in shaping the form of ratings data. In fact, without advertiser support, electronic media ratings as we know them would not exist. Their raison d’etre is to give buyers and sellers the information they need to negotiate the price of advertising time.
For several decades after the widespread adoption of television as a form of popular entertainment, ratings services employed relatively static measurement structures to generate estimates of viewership. This “audience information system” evolved with technology—although it often had difficulty keeping pace. Cable, direct broadcast satellite, and the Internet all required changes in measurement methods in order to generate the audience information needed to support economic exchange. Today, viewers can use computers, tablets, and mobile phones to access video content, and they have DVRs to make time shifting easier than ever before. These modes of viewing require new adjustments to audience measurement methods, but whatever the technology used to watch television content, ratings data are needed to estimate the value of time to advertisers.
The buying and selling of audiences takes place at many levels. In the comparatively simple world of broadcast, cable, and satellite television, a large national market was dominated by a few broadcast and cable networks, syndicators, and major corporate advertisers. In local markets, individual stations sold to area merchants. National spot and regional markets provided access to specific geographic areas. While this is still the basic framework, technology has changed the options for reaching audiences, and these changes have affected the markets for advertising time.
Each marketplace has developed its own institutions and practices, which affect how audience data are analyzed and interpreted. The following section describes the major markets for electronic media audiences. We explain how the trade in audiences is carried out through the traditional media of network and local broadcasting, the newer medium of satellite television (DBS), and the online world characterized by nontraditional modes of viewing: computer, tablet, or mobile device.
Table 7.1 summarizes total ad revenues for each medium, illustrating patterns of market growth. In the United States alone, advertising is a $150 billion business. As more and more countries open their markets to private ownership and advertiser support of communications media, global ad expenditures are predicted to reach $522 billion by 2013. We focus here on the structures supporting economic exchange in the United States because, while the specifics of organization may vary across the globe, the basic transactional arrangements involving audience information are consistent.
Broadcast and Cable Networks and Alternate Delivery Systems
Broadcast Networks. For advertisers who need to reach vast national markets, legacy networks still have much to offer. On average, the major television broadcast networks still draw the largest audiences, although cable programs now compete very effectively—often garnering larger audiences than the legacy networks. As a practical matter, the network television market is divided into smaller markets called dayparts, which are defined by time of day or program content. Because each designation is associated with specific audience characteristics, the various dayparts appeal to different advertisers and generate different amounts of sales revenue.
TABLE 7.1
Advertising Revenues of Electronic Mediaa
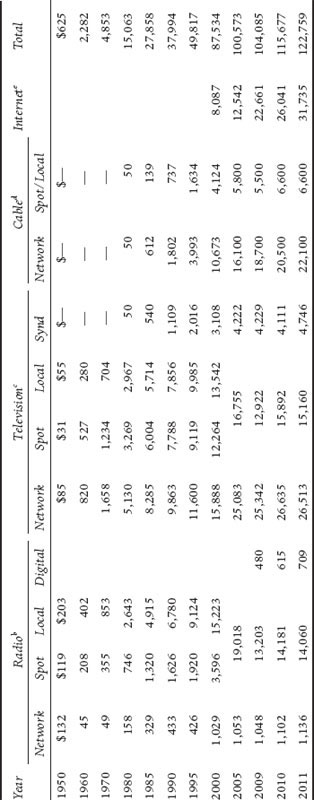
Note: Fox was counted as syndication prior to 1990, and as network after 1990. UPN, WB, and PAX were counted as syndication after 1990. Reprinted by permission of Interactive Advertisers Association.
aRevenue in millions.
bRadio Advertising Bureau.
cTelevision Bureau of Advertising. (“TV Basics” based on TVB analysis of Kantar data)
dCabletelevision Advertising Bureau. Spot/Local includes regional sports.
eInteractive Advertising Bureau/PricewaterhouseCoopers. (“IAB Internet Advertising Revenue Report”)
Prime time, the most important of the network dayparts, includes all regularly scheduled programs from 8 P.M. to 11 P.M. EST, Monday through Saturday, and 7 P.M. to 11 P.M. on Sunday. Networks generate their highest revenues during prime time because they attract the largest audiences. Advertisers like this day-part because they can simultaneously reach a wide variety of people across the entire nation, including people who work during the day. Access to this mass market, however, is not cheap; the most popular prime-time programs are the most expensive.
Daytime is the second most lucrative daypart. For the networks, daytime extends from 7 A.M. to 4:30 P.M. EST, Monday through Friday. This audience is much smaller and, with the exception of early news programs, disproportionately female. As a result, it appeals most to advertisers who want to reach women, especially full-time homemakers. Companies selling household products like soap and food frequently buy spots in this time period, paying far less than prime-time advertisers.
The sports daypart is defined strictly by program content. Among the most important network sports programs are major-league games like those of the NFL or NBA. These events attract men to the audience and, as might be expected, advertisers who buy most heavily in this daypart include breweries, car and truck manufacturers, and companies that sell automotive products. The cost of advertising in sports varies widely—mostly as a function of audience size—all the way up to the Super Bowl, which cost an estimated $3.5 million per 30-second spot in 2012.
The news daypart is defined more by program content than by simple time periods, although there is a correlation between news and time of day. This day-part includes the network’s evening news programs, weekend news programming, and news specials and documentaries. Excluded from this daypart are the morning news programs (considered daytime) and regularly scheduled prime time programs like 60 Minutes, even though network news divisions might produce these programs. The news daypart tends to attract an older audience, so it is especially appealing to companies that sell products like pharmaceuticals, healthful foods, and luxury items.
Late night begins at 11:30 P.M. EST, Monday through Friday. Its best-known programs are The Tonight Show With Jay Leno and Late Show With David Letter-man, which have dominated the time period for years. Not surprisingly, the audience during this daypart is small and almost entirely adult in composition.
Many public interest groups and regulators view the children’s daypart as one of the most important electronic media markets. This market includes the Saturday and Sunday morning children’s programs, a time period that critics once dubbed the “children’s ghetto,” as well as weekday programming aimed at children. Although children watch a great deal of television at other times, the children’s daypart offers advertisers the most efficient way to reach this audience through broadcast television. Among the largest advertisers in daytime are cereal and candy makers and toy manufacturers. The cost of a 30-second spot varies as the demand changes by season. An advertising spot at Christmastime, for example, might cost three times as much as it would in the months that follow.
Although television networks, whether broadcast, cable, or satellite, command much of our attention these days, we should recall that the first networks were radio. Permanently established by the late 1920s, these radio networks set in place many practices and traditions that are evident in network television today. And even though television has moved to center stage in our lives, now commanding the lion’s share of the advertising revenues, radio networks have been an important social and cultural force in American life. In fact, radio still offers advertisers an alternative to reach a national audience. This is especially true of satellite radio, although these services still do not have the reach of terrestrial networks.
Most national radio networks in operation today are controlled by a handful of companies. Arbitron measures audiences for six of these network operators: American Urban Radio Networks, Crystal Media Networks, Cumulus Media, Dial Global, Premiere Networks, and United Stations Radio Network. Each of these organizations offers multiple services including news, music, and political and sports talk programming. Syndicators, although not “networks” per se, provide specialized radio formats via satellite to a large number of stations all over the country. These formats include all types of popular music, call-in sports, and political conversation. Some feature well-known personalities like Rush Limbaugh and Don Imus and are carried by hundreds of radio stations simultaneously. Stations can receive news programs from news-gathering organizations like Associated Press, as well as cable services such as CNN, Fox News, and ABC’s ESPN. And group owners can distribute programming to their own stations, essentially functioning as ad hoc networks.
Cable Networks and Alternate Delivery Systems. Table 7.2 shows a ranking of national cable television networks by their Persons 2+ audience. All of these services depend, at least in part, on advertising revenues to make money. However, even the oldest and most popular cable networks still reach fewer American homes than the major broadcast networks.
The most obvious competitive strategy employed by cable programmers is to target a particular kind of viewer. Note the number of networks in Table 7.2 that offer programming for just a part of the audience. MTV, for example, is designed for teens and young adults. Nickelodeon and the Cartoon Network appeal to children. Lifetime is a network for women; Spike TV is for men. BET targets African Americans. To the extent that cable networks offer media buyers these specific audiences, they may be a more efficient buy for an advertiser. Further, cable networks are often more willing to work with advertisers to develop special programming or promotional efforts to enhance the impact of commercials.
TABLE 7.2
Cable Networks 2012 Ranked by Average Audience 2+
| Network | Households (000) | Coverage % |
The Weather Channel |
100,205 |
87.36% |
TBS Network |
100,025 |
87.21% |
CNN / HLN |
99,727 |
86.95% |
Nick-at-Nite |
99,664 |
86.89% |
Nickelodeon |
99,664 |
86.89% |
Discovery Channel |
99,604 |
86.84% |
Food Network |
99,601 |
86.84% |
USA Network |
99,301 |
86.57% |
Adult Swim |
99,159 |
86.45% |
Cable News Network |
99,156 |
86.45% |
The Cartoon Network |
99,159 |
86.45% |
A&E Network |
99,012 |
86.32% |
Headline News |
98,971 |
86.29% |
Home and Garden TV |
98,947 |
86.27% |
Turner Network Television |
98,921 |
86.24% |
ESPN |
98,903 |
86.23% |
Lifetime Television |
98,904 |
86.23% |
Tlc |
98,871 |
86.20% |
ESPN2 |
98,806 |
86.14% |
History |
98,708 |
86.06% |
Disney Channel |
98,666 |
86.02% |
Spike TV |
98,623 |
85.98% |
Comedy Central |
98,607 |
85.97% |
MTV: Music Television |
98,591 |
85.96% |
FX |
98,052 |
85.49% |
SYFY |
98,006 |
85.45% |
Fox News Channel |
97,981 |
85.42% |
VH1 |
97,944 |
85.39% |
CNBC |
97,497 |
85.00% |
ABC Family |
97,451 |
84.96% |
E! Entertainment TV |
97,414 |
84.93% |
AMC |
96,700 |
84.31% |
Animal Planet |
96,625 |
84.24% |
TV Land |
96,573 |
84.20% |
MSNBC |
95,526 |
83.28% |
Travel Channel |
94,716 |
82.58% |
Bravo |
94,607 |
82.48% |
TRU TV (Formerly Court TV) |
92,315 |
80.48% |
CMT |
91,834 |
80.06% |
Black Entertainment TV |
91,516 |
79.79% |
Hallmark Channel |
87,373 |
76.18% |
Lifetime Movie Network |
84,453 |
73.63% |
Golf Channel |
84,436 |
73.61% |
National Geographic Chnl |
83,881 |
73.13% |
Speed |
81,449 |
71.01% |
TV Guide Network |
80,388 |
70.09% |
Disney XD (Formerly Toon Disney) |
79,785 |
69.56% |
MTV2 |
79,655 |
69.45% |
BBC-America |
79,548 |
69.35% |
Oxygen Media |
79,500 |
69.31% |
Investigation Discovery (Formerly Discovery Times) |
79,491 |
69.30% |
Oprah Winfrey Network (Formerly Discovery Health) |
79,092 |
68.96% |
We:womens Entertainment |
78,783 |
68.69% |
NBC Sports Network |
78,063 |
68.06% |
Style |
77,714 |
67.75% |
Science (Formerly Science Channel) |
76,257 |
66.48% |
WGN America (Formerly Superstation WGN) |
75,965 |
66.23% |
GSN |
75,049 |
65.43% |
Nick Jr (Formerly Noggin) |
75,022 |
65.41% |
ESPNEWS |
74,680 |
65.11% |
ESPNU |
73,234 |
63.85% |
Teennick (Formerly The N) |
71,767 |
62.57% |
The Inspirational Network |
70,922 |
61.83% |
MLB Network |
69,861 |
60.91% |
Biography Channel |
69,426 |
60.53% |
Soapnet |
68,961 |
60.12% |
H2 (Formerly History International) |
68,432 |
59.66% |
Fox Business Network |
68,407 |
59.64% |
Independent Film Channel |
67,060 |
58.47% |
Galavision |
65,469 |
57.08% |
The Hub (Formerly Discovery Kids) |
64,200 |
55.97% |
Reelzchannel |
63,893 |
55.70% |
Great American Country |
62,550 |
54.53% |
G4 |
61,628 |
53.73% |
Nicktoons |
61,426 |
53.55% |
VH1 Classic |
60,962 |
53.15% |
Military Channel |
60,656 |
52.88% |
NBA-TV |
59,833 |
52.16% |
Cooking Channel (Formerly Fine Living) |
59,613 |
51.97% |
Destination America (Formerly Planet Green) |
59,596 |
51.96% |
NFL Network |
59,499 |
51.87% |
Current TV |
59,260 |
51.67% |
DIY Network |
57,793 |
50.39% |
TV One |
57,308 |
49.96% |
National Geographic Wild |
56,809 |
49.53% |
Fuse |
56,727 |
49.46% |
Sprout |
54,413 |
47.44% |
GMC |
52,179 |
45.49% |
Ovation Network |
51,400 |
44.81% |
Logo |
50,299 |
43.85% |
Centric |
48,921 |
42.65% |
Discovery Fit & Health (Formerly Fit TV) |
48,835 |
42.58% |
Hallmark Movie Channel |
47,262 |
41.20% |
Chiller |
43,486 |
37.91% |
FX Movie Channel |
42,485 |
37.04% |
Velocity (Formerly HD Theater) |
41,793 |
36.44% |
Fox Soccer Channel |
41,442 |
36.13% |
RFD-TV |
41,206 |
35.93% |
Encore |
40,950 |
35.70% |
Encore Primary |
39,801 |
34.70% |
Mun2 Cable |
38,200 |
33.30% |
Outdoor Channel |
37,801 |
32.96% |
Fuel |
37,029 |
32.28% |
Cloo (Formerly Sleuth) |
36,528 |
31.85% |
TR3S |
33,616 |
29.31% |
ESPN Classic |
31,969 |
27.87% |
HBO - The Works |
31,014 |
27.04% |
HBO Prime |
30,562 |
26.65% |
Sportsman Channel |
30,288 |
26.41% |
Nuvo TV |
29,621 |
25.82% |
Starz |
27,828 |
24.26% |
Starz Primary |
27,040 |
23.57% |
Showtime |
25,071 |
21.86% |
Showtime Prime |
24,846 |
21.66% |
Multimax |
19,095 |
16.65% |
Maxprime |
18,864 |
16.45% |
Discovery En Espanol |
8,027 |
7.00% |
Total Cable Plus |
103,934 |
90.61% |
Total Wired Cable |
68,568 |
59.78% |
Cable Plus W/Pay |
55,245 |
48.16% |
Wired Cable W/Pay |
35,792 |
31.20% |
ADS |
36,170 |
31.53% |
| Total U.S. | 114,700 |
©2012 The Nielsen Company. All Rights Reserved.
Not only do cable networks offer the prospect of fewer “wasted” exposures, they often sell access to their audiences for less than the networks charge. Broadcast networks, perhaps because of their greater reach or the prestige associated with hit programs, often command a premium in the marketplace. In recent years, however, cable-originated programming has become more popular, often surpassing competing broadcast programs in the ratings.
Like cable, Direct Broadcast Satellite (DBS) services can sell national advertising. And, like all its media competitors, DBS needs credible audience estimates to attract advertisers. In 2003, Nielsen agreed to develop a measurement system for rating satellite-delivered programming; DirecTV became its first client for the new service. Until then, commercial time on DirecTV was sold based on viewer estimates extrapolated from similar programming and distribution channels. True satellite ratings were a significant boost to the sales effort. Like cable, however, satellite programming has limited coverage compared with the broadcast networks. As a result, “national” ratings are generally lower than those for similar programs on the broadcast networks. Satellite services have, however, been able to gain an advantage by delivering more sports programming to subscriber households.
Buying and Selling Audiences in the National Market. We have considered three ways of thinking about “markets” when it comes to buying and selling advertising: by geography (national, local, and regional), by medium (broadcast, cable, or ADS); and by daypart (prime time, daytime, etc.). A third definition of market describes when the actual buying takes place. Transactions occur in different stages throughout the year, with some advertisers purchasing time well in advance of airdate and others purchasing time just a few months or weeks before broadcast. These different rounds in the buying process are called the upfront market, the scatter market, and the opportunistic market.
The upfront market begins in the spring when each network hosts advertisers and agencies for a decades-old ritual event to showcase new and returning programs. Network executives introduce buyers to their new programming lineups for fall, and advertisers commit billions of dollars to secure time for the coming season. In 2011, for example, the broadcast networks sold an estimated $9 billion in the upfront market. Although this method of buying ties up advertisers’ budgets for months to come, the upfront gives them access to the best network programs. And because these companies make long-term commitments to the network, they generally get more favorable rates than will be available later in the year. In fact, to lessen the advertiser’s risk, networks often give audience guarantees to ensure that the total audience estimates will be delivered, even if the networks have to run additional commercials, called make-goods, without charge to the advertiser. The process is complicated by uncertainty—no one knows exactly which audiences will watch new programs in the fall lineup. Even with guarantees, the upfront market is the occasion for much high-stakes gamesmanship.
The scatter market operates within a shorter time frame. Each television season is divided into quarters. In advance of each quarter, advertisers may wish to buy time for specific purposes such as advertising seasonal products or running some limited campaign, not envisioned during the upfront buying. Because advertisers are usually less flexible in the scatter market, and network buyers are generally at a disadvantage, prices in the scatter market are usually higher than they were in the upfront. At times, however, market conditions could favor the buyer. Programs that were high risks in the upfront market will have track records when scatter buying occurs—this means a less risky investment for the advertiser. Additionally, if the networks have a slow season, rates could actually be lower in scatter than in the upfront.
The opportunistic market occurs as the television season progresses. Although most of the networks’ inventory is purchased during the upfront and scatter markets, some time might become available closer to airdate. Perhaps deals negotiated early in the season fell through as a result of cuts in an advertiser’s budget or the implementation of new marketing strategies. Or perhaps changes in network lineups, such as the cancellation or rescheduling of a program or the addition of a special event, resulted in extra inventory. These changes would relieve advertisers of their commitments, and create opportunities for the last-minute purchase of airtime. The circumstances might favor the network, or they might give the advantage to an advertiser. Buyers and sellers often use such opportunities to settle debts from past business deals. For example, a salesperson with extra inventory might offer a low-cost spot to a particular buyer who has been an excellent customer. Or a buyer may purchase a spot to help the seller out because the salesperson has given him preferential treatment in the past.
The competitive landscape for national advertising continues to evolve as technology makes new forms of distribution possible. Broadcast and cable networks now compete with alternate delivery systems (ADS) like DirecTV and DISH Network, and with the Internet. More television households dropped cable subscriptions than signed up for new cable service in 2011. Some of this drop is due to ADS, and some is undoubtedly brought about by an increase in online viewing. Nationally, cable penetration is at 60.2 percent; ADS penetration is now at 31.2 percent. The near-universal coverage of broadcast networks still gives them an edge over cable and ADS in building the largest television audiences. Cable networks have, however, developed other strategies for selling their audiences.
Stations are in constant need of programming. Even network affiliates must fill large blocks of time not programmed by the networks. To do this, broadcasters rely on a variety of program sources, including one that is particularly relevant to a discussion of advertising—barter syndication.
Barter syndication has fairly straightforward origins. Basically, advertisers found they could use a station’s need for programming to get their message across to an audience. They could produce a program, place their advertisements in it, and offer it to stations without charging a license fee. Stations found this attractive because they acquired new programs without having to pay cash for them; they could even sell spots in the programs if the original sponsor did not use them. With the growth of satellite program distribution in the 1980s, this simple idea gave rise to a rapidly growing new advertising marketplace.
In general, the barter syndication market works like this. A distributor produces programs, owns the rights to existing shows, or works on behalf of another producer to sell programs to local stations. The sales arrangement could be “all barter,” meaning that a station gives the syndicator all available commercial time to sell in the national market. Sometimes the agreement is a hybrid, called “cash-plus-barter,” which, as the name suggests, requires stations to pay a fee for the program as well as accepting advertisements placed by the syndicator. Depending on the specific terms of the deal, stations might also sell some local spots in a cash-plus arrangement.
Syndicators determine the terms of a deal before they place a program in the marketplace. Trade publications print lists of these arrangements at the beginning of each calendar year, just before the National Association of Television Programming Executives (NATPE) conference. At NATPE syndicated programs are marketed intensely to potential buyers, especially those from medium and small markets. Table 7.3 reproduces part of this list of available programs for January 2012. Although barter terms may change to meet market demand, this list gives a good indication of the type of deals syndicators are seeking. Individual barter contracts may require stations to broadcast programs in a specific daypart, such as early fringe. Requirements like this are typical of popular programs that are especially desired by stations. Some of the programs listed in Table 7.3 are not scheduled to be available until a year or two after they are sold.
In addition to the terms of sale, program buyers are interested in the number of markets that have already purchased (or “cleared”) the programs. The more stations that acquire a program, the larger is the potential audience. If one station in every market agrees to air a program, the distributor would, hypothetically, have the same reach as a major television network. As a practical matter, once a program is carried on enough stations to reach 70 percent of U.S. households, it is sold to advertisers in much the same way as network time.
Just like their network counterparts, the barter syndication firms approach national advertisers and their ad agencies to sell commercial time. They sell in the upfront, scatter, and opportunistic markets, and may even guarantee audiences like the networks. In fact, advertisers may use barter syndication as a supplement to their purchases of network time or as a substitute for it. Sometimes program environments are available through barter that are not offered by traditional broadcast networks. For example, game shows and talk shows are more likely to be available in syndication than on broadcast networks. Still, the major benefit of advertising on a barter program is reaching an audience at a somewhat lower cost than other national or regional alternatives.
Despite some similarities, buying time in barter syndication is not quite comparable to network advertising. Many programs, especially those produced for first-run syndication, are sent to all stations in the country at the same time, and at least run on the same day. But other types of programming, off-network syndication for example, may air at different times in different markets. Weekly syndicated programs might even air on different days, which complicates the process of predicting audiences.
Barter syndication and related ways to package advertising for national or regional audiences are almost certain to grow. Satellite communications have made the rapid, cost-efficient delivery of programs feasible. Stations pick up these syndicated program feeds if they perceive this to be in their best interests, perhaps even preempting more traditional networks. Assuming an effective way to buy and evaluate audiences, advertisers are likely to use these alternative routes for reaching the public. Such ever-changing syndicated networks are also likely to pose some of the most interesting challenges for audience analysts.
Broadcast networks reach national markets by combining the audiences of local affiliated stations. Similarly, national cable networks aggregate the viewers of local cable systems. But an individual station or cable system can sell its own audiences to advertisers who want to reach their local customers. These audiences are attractive to businesses that trade in a concentrated geographical area and to national or regional marketers who want to advertise in specific markets. The former create a market for local sales; the latter take part in the national spot market.
The physics of broadcasting are such that a station’s signal has geographic limits. In light of this, the federal government decided to license radio and television stations to specific cities and towns across the country. Larger population centers have more stations. Naturally enough, people spend most of their time listening to nearby stations because the signal is clearest and the programs are of local interest. In television, the major ratings service uses this geographically determined audience behavior to define the boundaries of a local media market area. Nielsen calls these markets Designated Market Areas (DMAs).
Appendix A lists the 210 U.S. television markets designated by Nielsen. There are even more radio markets. In both cases, market size varies considerably. New York, for instance, has over 7 million television households, whereas Glendive barely has 4,000. Indeed, buying time on a major station in New York might deliver more viewers to an advertiser than a buy on national cable network. Conversely, many small-market radio stations might have audiences too small for a ratings company to measure economically. This point is best illustrated by the fact that regular radio ratings are available to fewer than half the stations in the country. Of course, measured stations account for the overwhelming majority of all radio listening.
TABLE 7.3
Syndicated Programming: Sample of Programs Available in 2012


Note: Data are from Daily Variety, January 23 and 24, 2012.
These vast differences in audience size have a marked effect on the rates that local broadcasters can charge for a commercial spot. The price of a 30-second spot in prime time might be $400 in Des Moines and $4,000 in Detroit. Other factors can affect the cost of time, too. Is the market growing, or has it fallen on hard times? Is the population relatively affluent or poor? How competitive are other local media, like newspapers? Even factors like a market’s time zone can affect the rates of local electronic media.
Other characteristics that vary with market size are the volume and sophistication of the ratings users who analyze audience information. Many radio markets are measured just twice each year. Audiences in major television markets, on the other hand, are measured continuously. Because of this, and the greater number of advertising dollars available in major markets, the buyers and sellers of media in those markets tend to be more experienced with and adept at analyzing ratings information.
In most markets, the largest buyers of local advertising include fast food restaurants, supermarkets, department stores, banks, and car dealers. Like network advertisers, these companies often employ an advertising agency to represent them. The agency can perform a number of functions for its client, from developing a creative strategy, to writing copy and producing the advertisements. Most important in this context, the agency’s media department projects the audience for various programs, plans when the advertisements are to run, buys the time, and evaluates whether the desired audience was delivered. Smaller advertisers, or those in smaller markets, may deal directly with local stations.
Because of the different types of people and organizations involved, local time-buying decisions vary from intuitive judgments made by a merchant who thinks a certain number of advertisements on a local station will generate extra business, to choices based on complex analyses of ratings information. Indeed, many small radio stations and cable systems sell without using any ratings information at all. Increasingly, though, the process of buying and selling time depends on the use of ratings.
Although specific terminology may differ from organization to organization, the purchase of local time generally works like this. The advertiser or its agency issues a request for avails. In effect, the buyer is asking what spots are available for sale on the local stations. Avail requests typically specify the buyer’s target audience, preferred dayparts, and estimated budget. Station salespeople respond by proposing a schedule of spots to deliver some or all of the requested audience. At this point, the buyer and seller negotiate differences over the projected rating and the cost of a spot. Assuming the parties reach an agreement, buyers place an order and the spots air. After the campaign, the next available ratings information is analyzed to determine whether the expected audience was actually delivered. As in network buying, this last stage in the process is called post-buy analysis.
As noted earlier, national and regional advertisers participate in the national spot market when they buy spots on local stations. For example, a snow tire manufacturer might want to advertise only in northern markets. Similarly, a maker of agricultural products might wish to buy time in markets with large farm populations. In fact, such national spot buys constitute the largest single source of revenues for many television stations. The question is, how can so many local stations deal effectively with all these potential time buyers? It would be impractical for thousands of stations to have their own personnel trying to contact each and every national advertiser.
To solve this problem, an intermediary called a station representative (or rep firm) serves as the link between local stations and national advertisers. Rep firms for both television and radio stations are located in major media markets like New York and Chicago. Television reps usually represent only one client per market, in order to avoid any conflict of interest. Radio reps may serve more than one station in a market, as long as their formats do not compete for the same audience. Rep firms vary according to the number of stations they represent, and the types of services they offer to clients. Some firms provide stations with research services or advice on programming. Most importantly, though, rep firms monitor the media buys that national advertisers are planning, and they try to secure some portion of that business for their stations.
The station sales force and the salespeople at the rep firm under contract with the station are essentially selling the same commercial time. This can cause some conflicts. Local advertisers could be shut out of a daypart because national advertisers secure the inventory, or vice versa. In Las Vegas, for example, local businesses pay a premium to advertise in early news programs in order to reach visitors who are deciding where to go for the evening. This means that national advertisers cannot purchase time in local broadcast news without paying very high rates. Instead, they may turn to cable television to reach those audiences.
Cable systems also offer local advertising opportunities. Usually, this involves inserting a local ad in a cable network, but it could also mean sponsorship of locally produced programs. There are two limitations to this process. First, just like cable networks, cable systems simply cannot reach every member of the available television audience. Second, as is the case with small market radio stations, the audience for most local cable systems is too small to measure economically. In this case, advertisers must guess at audience size and composition. However, Nielsen has been installing peoplemeters in the largest television markets, which could improve cable measurement by expanding sample sizes. Further, as more cable systems begin to provide programming via digital set-top boxes, they can access aggregate information about household viewing. While these improvements will help level the playing field in the local ad market, local cable is likely to be at a disadvantage for some time.
Eventually though, cable systems might enjoy an advertising advantage because they are not just local, they are “ultra-local.” In many television markets, programming is fed to different neighborhoods by different headends. Each headend is capable of inserting advertisements for its own coverage area, so an advertiser can create a patchwork of small coverage areas to suit its needs. A local merchant could run a spot across a group of interconnected headends, reaching only those viewers who live in a certain part of town. Or a chain restaurant might run one commercial across the entire market but vary the address of the closest local outlet. Similarly, since cable franchise areas, almost by definition, conform to governmental boundaries within the market, cable seems a likely venue for political advertising. These potentials are being exploited more and more by cable rep firms.
Like the electronic media themselves, the advertising marketplace is constantly evolving. Two major developments that deserve comment are the growth of advertising worldwide and the challenges and opportunities posed by advertising through newer communication technologies. Table 7.4 provides total advertising expenditures by region through 2011, with projections to 2014. In most regions advertisers continue to spend more money each year; the exception is the Middle East and North Africa.
Advertising in the United States is a relatively large and stable marketplace with a dollar volume of activity closely tied to the overall health of the economy. The same is true of other mature industrialized nations, especially those of Western Europe. One significant difference, however, is the way commercial media evolved. In the United States, radio and television systems began as commercial ventures; in many other countries media were largely or completely government supported for years. Different models of commercial support are still evolving and the precise configurations vary by country. This evolution does not mean, however, that governments are uninvolved in steering the development of media. As Straubhaar (2007) observes, television systems are often “stubbornly national,” which means advertisers must tailor “global” media plans to the regulatory policies and cultural expectations of individual countries.
TABLE 7.4
Global Advertising Expenditures and Projections Through 2014: Advertising Expenditure by Region
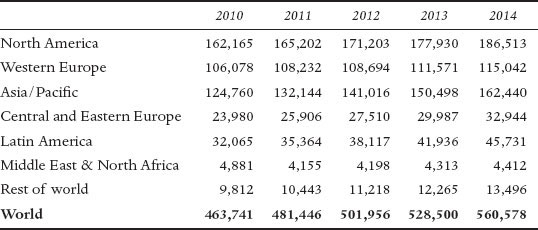
Source: ZenithOptimedia
Note: Major media (newspapers, magazines, television, radio, cinema, outdoor, Internet).
$Us million current prices. Currency conversion at 2011 rates. Used by permission.
One need is consistent, however, no matter which country we consider. In order for commercial television to expand, media and advertisers need credible audience data to assign value to airtime. Each country has its own unique challenges when it comes to developing an audience information system that can provide these data. For many, a completely independent third-party ratings provider is neither familiar nor desirable. Legacy research services, such as BARB in the United Kingdom, BBM in Canada, and GfK in Germany, are either formed by, or hired by, a consortium of representatives from media, advertisers, and advertising agencies. Joint Industry Committees (JICs), Media Owner Committees (MOCs), or Tri-partite Research Company Contracts (TRCCs) determine the official audience ratings provider(s) for the country. They not only control the measurement of audiences, but the distribution of audience information as well.
Although antitrust regulations prevent these types of organizations from forming in the United States, there are four reasons that they have become institutionalized worldwide. The first has to do with history—if a media system has been totally or mostly controlled by government, the transition to commercial broadcasting is fraught with uncertainty. Not only are the public interest responsibilities of media owners at stake, but the perceived responsibility of government to ensure quality programming could also be compromised. Second, in countries with a culture of consensus, joint decision-making in such an important business sector is a desirable process. Third, the advanced technologies of larger countries could give foreign suppliers an advantage over indigenous companies when competitive forces determine the outcome; joint committees can factor localism into their decisions. And fourth, when one entity is making decisions for an entire industry, it has the power to unseat one company in favor of another every time contracts expire. This means that research companies have the motivation to provide their best services year after year because there is no presumption of contract renewal.
Evolving Communication Technologies
At a time when more people seek access to media audiences, a range of evolving communication technologies present new challenges. As we noted previously, the average U.S. television household receives over 100 channels of programming. With remote control devices, viewers can skip commercials by changing channels, perhaps even choosing noncommercial pay services. More disconcerting from the advertiser’s perspective are digital video recorder (DVRs), like TiVo, that allow viewers to prerecord programs with advertising, then skip the commercials altogether. Of course, some segments of the audience may avoid the clutter of advertisements on radio and television by opting for interactive media like video games. Taken together, these technologies empower viewers in a way that seems to threaten the entire system of advertiser-supported media. In response to changes in technology, Nielsen has adjusted its method for calculating and reporting audience data. As we explained earlier, audiences are now calculated on the basis of “live-plus” viewing, which can include playback same day, 3 days, or 7 days.
As a result, advertisers are using alternate strategies to bring their messages to the public’s attention. One tried-and-true technique that has received renewed interest is product placement, a strategy that has been used for some time in the film industry. If people won’t watch a commercial for some product, then place the product in the program itself. You may remember the movie E.T.: The Extraterrestrial, in which E.T. was lured by Reese’s Pieces. On television we have seen judges for American Idol sipping cups of Coca-Cola, Don Draper pitching Kodak on Mad Men, and characters on Seinfeld enjoying Junior Mints. Hundreds of millions of dollars are now spent on product placement in television, and it is expected the practice will soon exceed $1 billion in the United States alone. Planners use audience ratings as well as storylines to identify the best placements for their client’s products; agencies have even developed models to estimate the monetary value of these placements. In some countries this practice has been slowed by Joint Industry Commissions that fear the overcommercialization of television and radio content. For example, paid product placement in U.K. programming was banned on broadcast stations until 2010 when Ofcom decided to allow it. Broadcasters still, however, have to adhere to a set of rules that limit the practice.
In a similar vein, advertisers are being more deliberate about placing logos and slogans in sporting events. Billboards in a baseball outfield, or surrounding a soccer pitch, can produce valuable exposures. In fact, chroma-key technology can create “virtual billboards” that only exist in the televised images of a game. NASCAR seems to have sold every available square inch on drivers’ cars and uniforms. Messages woven into the fabric of a program or event are difficult for viewers to miss. And ratings companies, like Nielsen Media Research, now offer services that estimate the size and composition of the audience that is actually exposed to those images.
Marketers are also exploring less-traditional advertising options. Although European movie theaters have shown advertisements for some time, this practice has met resistance in the United States. But the captive movie audience is proving hard for advertisers to resist, and cinema advertising is one of the most rapidly growing ad venues in North America. Advertisers can buy spots in the short program before a feature film, and show either the same commercials they use for television, or new ones produced specifically for the film-going audience. A trade association, the Cinema Advertising Council (CAC), performs the same kind of promotion and lobbying tasks as its electronic media counterparts: the Television Bureau of Advertising (TVB), the Cable Advertising Bureau (CAB), the Radio Advertising Bureau (RAB), the Interactive Advertising Bureau (IAB), the Syndicated Network Television Association (SNTA), and the Open Mobile Video Coalition (OMVC). Nielsen Media Research, partnering with cinema advertising sales organizations, launched a service to measure and quantify theater audiences. Nielsen’s “gross cinema points,” roughly analogous to television’s “gross rating points,” allow cinema sales reps to compete with broadcasting and the Internet for a share of the advertising market.
Advertisers are also testing the effectiveness of commercials in video games. This gives them better access to young men, who are a desirable, and often hard to reach, segment of the market. Initial research indicates that gamers actually like the presence of advertisements and identifiable products in their games, because they enhance the realism of the gaming environment. As you might expect, Nielsen is measuring audiences/users for this new advertising venue.
Although the Internet does not conform to the “local versus national” distinction that has defined traditional media markets, advertisers are able to target Internet users by demographic group and by location. In the latter half of the 1990s, advertising dollars started pouring into the Web; the momentum slowed in the early 2000s but reached nearly $32 billion in 2011 (IAB Internet Advertising Revenue Report, 2011). Just like radio and television, however, the viability of Internet advertising requires that there be independent audience measurement firms verifying the number and characteristics of Web users.
The Internet audience research business has developed along the same lines as broadcast audience measurement. Concepts like “impressions,” “reach,” “frequency,” and “audience duplication” are used to summarize and evaluate Internet users. Just as their broadcast counterparts, Web sites are represented in the advertising market by rep firms, which provide a variety of services for the sites they represent. Foremost among them, though, is soliciting advertising revenue for their clients.
There are some major differences between broadcasting and the Internet that affect the ways audiences can be tracked. The most important difference is that everyone who visits a website is being sent content directly from a server. This computer can keep track of everyone who accesses a website. The server can, in principle, produce a census of all users, eliminating the need for sampling altogether. In fact, one of the first ways to measure Internet audiences was to count the number of hits that the server received. But, as we discussed in chapter 5, hits are very imprecise measurements. For the Internet to become a viable advertising medium, marketers needed audience/user data comparable to the estimates they had for broadcasting and cable.
Advertisers are increasingly interested in reaching audiences via digital technologies. Two major audience measurement companies vie for supremacy in the field of Internet measurement: Nielsen Online and comScore Media Metrix. Both maintain very large samples of Internet users, at home and at work, who have agreed to report information about themselves and to have their Web surfing behavior recorded. These data are aggregated into various reports, which are available to clients willing to pay for independent estimates of the size and composition of website audiences.
An interesting, and dramatic, change in the way advertisers reach audiences came with the introduction of Internet-connected tablets and mobile phones. Ad placement is no longer about a single distribution technology and content type matched to a single screen (i.e., broadcast or cable television viewed on stationary television sets, Internet accessed on desktop or laptop computers). If they can connect to the Web, viewers can watch television or browse websites on different types of screens, from the home-bound television set to the smallest of mobile phones. The challenge for the audience research industry is to discover ways to capture content consumption across all screens so producers and distributors can sell their audiences to advertisers.
Another powerful, but not yet fully realized, potential of the Internet is addressable advertising. Because Internet advertisements can be served independently of Web page content, advertisers can target individual users with specific advertising appeals, regardless of which content they choose. At present, most targeting occurs by linking the content of Web pages to a complementary ad (e.g., a travel website carries an ad for an airline). But more precise targeting is, in theory, possible. At some point in the future, advertisements are likely to reach the right consumer at the right time, no matter what content the consumer has chosen to view. When this scenario becomes a reality, the rules for programming advertiser-supported media will have to be rewritten.
Obviously, the buying and selling of audiences happens in a number of different places and involves people with different motivations and levels of sophistication. There are, nonetheless, a handful of recurring research questions that transcend these differences. By distilling these from the previous discussion we can see more clearly how ratings data are used in the context of advertising. The four basic questions users ask of the ratings data concern the size and composition of the audience and the cost to reach potential customers.
How Many People Are in the Audience?
More than any single factor, the size of the media audience determines its value to advertisers and, in turn, its value to the media. Local radio audiences are usually counted in the hundreds of people. Television audiences are numbered in the thousands at the local level, and in the tens of thousands or millions at the national level. In the day-to-day buying and selling of advertising, these audiences are expressed as ratings—in fact the term is so widely recognized that we chose to use it in the title of this book.
In the national market, ratings estimates can be directly compared within each distribution channel. A 5 rating among persons aged 18 and older on NBC represents the same number of viewers as a 5 rating among persons aged 18 and older on CBS or AMC or FX—as long as the rating is based on the same population. This is also true of radio networks. However, ratings are not the best measure for inter-market comparisons between DMAs. The reason, of course, is that each market has a different total population—a 25 rating in Denver does not represent the same number of people as a 25 rating in Los Angeles. In this context, projected audiences are more useful.
Advertisers typically run a series of advertisements over a period of days or weeks. In some ways, then, the audience for a single commercial is less important than total audience exposure over the entire campaign. To provide some assessment of total exposure, ratings for each individual commercial can be summed across a campaign to generate the GRPs we discussed in chapter 5. The term is used quite commonly in advertising, and almost nowhere else.
Audiences are consuming television content on a number of different platforms, which makes tracking viewership more complicated. Figure 7.1 illustrates the range of viewing options used by audiences in 2012 during the U.S. collegiate basketball tournament, commonly known as “March Madness.” As you can see, basketball fans watched across a number of different screens from television sets to tablets to computers to mobile phones. This graphic shows that 74 percent watched on television sets, 28 percent on computers, and 11 percent on mobile phones. These numbers add up to more than 100% because some viewers used different platforms at the same time—10 percent watched more than one screen simultaneously. On average, fans spent 2.5 hours per day, across all media, watching the tournament, and they viewed at work, at home, and in bars. The media would like to “monetize” this content by credibly measuring these audiences, assigning monetary value to them, and selling their attention to advertisers.

FIGURE 7.1. Viewing Options Used by Audiences During March Madness
Used by permission of the Media Behavior Institute.
How Often Do the Same People Show Up in the Audience?
Advertisers are, understandably, interested in how many different people see their message and how often they see it. These concerns are addressed by measures of reach and frequency, respectively. Certain media are better at achieving large cumulative audiences than others. Prime time broadcast television, for example, produces considerable reach for a commercial message, since its audiences tend to be quite large. Further, many people only watch television during prime time and, therefore, are reachable only in that daypart. As a result, advertisers are often willing to pay a premium for prime time spots. Cable networks, on the other hand, are limited by the penetration of cable systems, and so cannot hope to achieve penetration levels as high as their broadcast counterparts.
The second factor of interest is the frequency of exposure. The question here is how many times on average did an audience actually see or hear the message? Some programs and dayparts tend to attract relatively small audiences, which means a GRP goal would be achieved through low reach and high frequency (remember, GRPs = reach × frequency). If, for example, you wanted to market a product to Spanish-speaking audiences, buying time on a Spanish language station might produce a low cume but a high frequency of exposure. Similarly, radio can be an effective medium for achieving high frequency, since the audiences for many stations and satellite networks tend to be loyal to station formats. The optimum balance between reach and frequency depends on the goals of the advertiser.
Table 7.5 summarizes reach estimates for different GRP levels on broadcast television and cable. Reading across the row for each daypart, it is clear that reach does not increase proportionally as the GRP levels go up; this means that the combination of reach and frequency differs across dayparts. For example, doubling the number of GRPs from 50 to 100 in prime time on a broadcast network does not double the reach—it adds 15 points (an increase of about 42 percent). The same GRP change in daytime will add 7 reach points (an increase of 33 percent). Note that each daypart builds reach differently. At 100 GRPs, prime time broadcast networks will deliver a reach of about 51 percent of all adults. During the early news broadcast, these networks will deliver a reach of 39 percent at the same GRP level. Note also that to reach half of all adults via cable, the advertiser would have to buy 300 GRPs in a 5-channel schedule and 150 GRPs with a schedule of 10 cable channels.
TABLE 7.5
Estimated 4-Week Reach Attained by Various Forms of Television at Differing GRP Levels

Source: Media Dynamics, TV Dimensions 2012, p. 150, Used by permission.
a Women targets only.
b It should be noted that cable’s “wired” penetration is only 61% of U.S. TV homes; however, another 27% to 28% of U.S. TV homes view via direct TV (satellite).
c All dayparts.
Throughout this book we have referenced the need for different advertisers to reach different kinds of audiences. If the size of the audience is the most important determinant of its value, the composition of the audience is not far behind. In fact, advertisers are increasingly interested in presenting their messages to specific subsets of the mass audience, a strategy called market segmentation. This strategy plays a very important role in advertising and, in turn, has a major impact on the form that ratings data take. Audiences are segmented according to the traits of viewers or listeners. Almost any attribute can become a segmentation variable, as long as it is reasonably well defined. In practice, viewer or listener attributes are usually grouped into one of four categories.
Demographic variables are the most commonly reported in ratings data. By convention, we include in this category such attributes as race, age, gender, income, education, marital status, and occupation. Of these, age and gender are the most frequently reported audience characteristics, and the standard reporting categories featured in ratings books. So, for example, advertisers and broadcasters will often buy and sell “women 18 to 49,” “men 18 to 34,” and so on. Most buying and selling of audiences is done on the basis of demographic variables.
Demographics have much to recommend them as segmentation variables. For one thing, everyone in the industry is used to working with them. When you talk about an audience of women or 18- to 34-year-olds, everybody knows exactly what you are talking about. On the other hand, there may be important differences between two women of the same age, differences that are potentially important to an advertiser. Therefore, additional methods of segmentation are used.
Geographic variables offer another common way to describe the audience. We have already encountered one of the most important, designated market areas or DMAs. Just as people differ from one another with respect to their age and gender, so, too, they differ in terms of where they live. Every television viewer or radio listener in the country can be assigned to one particular market area. Obviously, such distinctions would be important to an advertiser whose goods or services have distinct regional appeal.
Other geographic variables that are commonly used in ratings research are county and state of residence (including breakouts by county size) and region of the country. Political advertisers rely heavily on this kind of information. Because areas like congressional districts do not conform exactly to the DMAs for which ratings are readily available, media planners analyze audiences by county. A television station that earns the highest DMA ratings might not be the one that gets the advertising from a particular campaign. Instead, planners will suggest whichever station(s) have the highest ratings in the counties of interest. Table 7.6 shows a comparison of county-level ratings by daypart for broadcast stations in the New York DMA. The index compares county ratings to DMA ratings. An index of 100 means the ratings in the counties of interest were the same as the rating for the entire market; an index of 50 means the county ratings were half as large as the market rating. As you can see, of the three broadcast-network-owned stations, WABC consistently gets higher daytime viewership in Orange and Putnam counties.
Tracking a person’s zip code is another popular tool of geographic segmentation. With such finely drawn areas, it is often possible to make inferences about a person’s income, lifestyle, and station in life. These zip-code–based techniques of segmentation are commonly referred to as geodemographics.
Behavioral variables draw distinctions among people on the basis of their behaviors. The most obvious kind of behavior to track is media use. We need to know who watched a particular program before we can estimate the size of its audience. With this kind of information, it is possible to describe an audience not only in terms of age and gender, but also in terms of what else they watched or listened to. Such audience breakouts, however, are only occasionally provided by the ratings service.
The other behavioral variables that weigh heavily in an advertiser’s mind are product purchase variables. Because most advertisers want to reach the audience that is most likely to buy their product, what better way to describe an audience than by purchase behaviors? For example, we could characterize an audience by percentage of heavy beer drinkers, or the average amount of laundry soap purchased. One ratings company has called such segmentation variables buyer-graphics. As you might imagine, advertisers like this approach to audience segmentation.
Combining media usage data with other types of variables is particularly useful to marketers targeting potential customers who fit narrower definitions than specific age and gender. However, this information can be very expensive to obtain. Only those organizations that pay subscription fees can use this data in their sales or buying efforts.
TABLE 7.6
Comparison of County-Level Ratings by Daypart for Broadcast Stations in the New York DMA
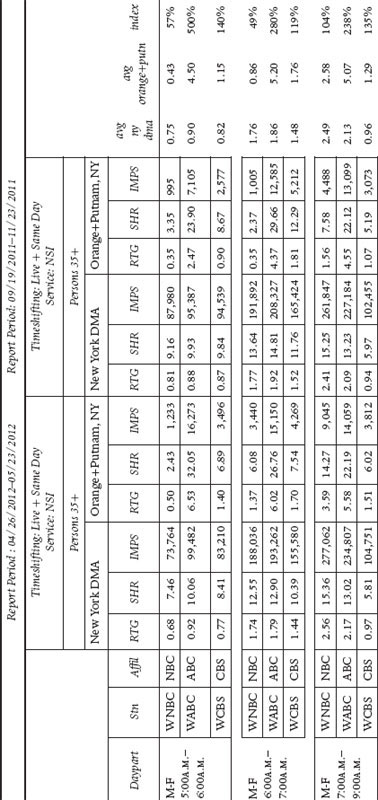

Copyright © 2012 The Nielsen Company. Used by permission, Nielsen Media Research and LUC Media.
Psychographics draw distinctions among people on the basis of their psychological characteristics. While definitions of what belongs in this broad and amorphous category vary, they typically include things like people’s values, attitudes, opinions, motivations, and preferences. One type of psychographic variable that has attracted attention recently is variously labeled viewer loyalty, involvement, and/or engagement. The idea here is that, as new technologies empower audience members with ever more choices, it is increasingly important for advertisers to know which people are particularly committed to which media products. Some evidence suggests that those who are very engaged with a program (e.g., its fans) are more attentive to the advertisements contained within. Although such traits can, in principle, be very valuable in describing an audience, psychographic variables are often difficult to define and measure precisely.
How Much Does It Cost to Reach the Audience?
Advertisers and the media, as well as middlemen like ad agencies and station reps, all have an interest in what it costs to reach the audience. Those on the selling side of the business try to maximize their revenues, whereas buyers try to minimize their expenses.
Although it is true that broadcasters and other forms of electronic media sell audiences, it would be an oversimplification to suggest that audience factors alone determine the cost of a commercial spot. Certainly, audience size and composition are the principal determinants, but several factors have an impact. Advertisers pay a premium, for example, to have their message placed first in a set of advertisements (a commercial pod). We have already pointed out that advertisers who buy network time early in the upfront market can get a better price. Similarly, advertisers who agree to buy large blocks of time can usually get some sort of quantity discount. Remember that these transactions happen in a marketplace environment. The relative strengths and weaknesses of each party, their negotiating skills, and, ultimately, the laws of supply and demand all affect the final cost of time.
These factors are represented in the rates that the media charge for commercial spots. It is common practice for an individual station to summarize these in a rate card, which is usually a table or chart that states the price of spots in different dayparts or programs. The rate card is a planning guide, but the actual rates are subject to negotiation. Although the estimated cost of a commercial spot is important to know, from the buyer’s perspective, it is largely uninterpretable without associated audience information. The question the buyer must answer is, “What am I getting for the money?” This cannot be answered without comparing audience ratings to the rates that are being charged. Advertisers use either cost-per-thousand or cost-per-point calculations to analyze the value of advertising time.
Ratings are the currency that drives the economics of commercial electronic media audiences. But the media are complex organizations that can and do use audience information in a variety of ways. Similarly, those who want to study or regulate mass communication have found that the data gathered for the benefit of advertisers can offer many insights into the power and potential of the electronic media. In the chapters that follow, we discuss many of these applications. First we turn to the use of audience data in programming.
Albarran, A. (2012). Management of electronic and digital media (5th ed.). Belmont, CA: Wadsworth.
Albarran, A. (2010). The media economy. New York: Routledge.
Alexander, A., Owers, J., Carveth, R., Hollifield, C. A., & Greco, A. (Eds.). (2004). Media economics: Theory and practice (3rd ed.). Mahwah, NJ: Lawrence Erlbaum Associates.
Baron, R. B., & Sissors, J. Z., (2010). Advertising media planning (7th ed.). Chicago: McGraw-Hill.
Bogart, L. (1996). Strategy in advertising: Matching media and messages to markets and motivations (3rd ed.). Lincolnwood, IL: NTC Business Books.
Poltrack, D. F. (1983). Television marketing: Network, local, cable. New York: McGraw-Hill.
Turow, J. (1997). Breaking up America: Advertisers and the new media world. Chicago: University of Chicago Press.
Warner, C. (2009). Media selling: Television, print, Internet, radio (4th ed.). Malden, MA: Wiley-Blackwell.