
3. Something Is Missing
I’m going to start this chapter by saying that a toilet has a better control system built in to it than our networks do. We understand how toilets work, what happens when they don’t, and most important, why they fail. I know it sounds strange, but there is a similarity here that can be exploited—we just need to understand the science behind it.
So, from the preceding two chapters, we know that something is clearly missing. We’re spending like mad, have no way to predict success (much less failure), and we still have the day-to-day problem of being attacked constantly.
I think part of the problem has to do with the fact that many people honestly believe that the network is too complex to understand and that “security” is the purview of hackers and vendors. I’ve actually had security people tell me in meetings that their network is too large, too distributed, and too complex to identify all the endpoints on it! On another note, I’ve actually had a hacker sit across from me in meetings, pound the table, and scream—yes, scream at me—“I can own your network!” I told him, “Great, I’ll need a weekly status report.” He didn’t seem to be a bit amused with my sarcasm, but using fear, uncertainty, and doubt to sell a service has never been a big hit with me.
I touched on the idea that we should use science to help solve our problems, and I really think that’s where the answer lies. We need to understand not just how, but why our networks operate the way they do. We’re being driven by the fire of the day, and we’re letting it drive our solution space. This is not how engineers do things, and for all practical purposes, no matter how we got here, we are engineers.
In this chapter, we explore the notion that the network and the endpoints that populate it is a problem that can be expressed as a closed-loop process control problem. Like the system that controls the heat and power in your building, a closed-loop process control system establishes a “set-point,” such as the temperature, and works the system’s compressors, coolers, and heating elements to maintain the temperature within a few degrees of the set-point. I submit that our networks have no such control and that’s why we’re having the problems we have now.
The network folks have known about this kind of a solution for years. All critical systems, such as switches, routers, Uninterruptible Power Supplies (UPSs), file servers, and even things like network-enabled power strips, all talk to a central system called a network management system (NMS). Properly instrumented systems talk with the NMS using a standard protocol called the Simple Network Management Protocol (SNMP). Using SNMP, systems report on their status, throughput, and general health. Details such as the number of packets passed, packets dropped, types of packets, temperature of the system, voltage level, battery life, routing protocols in use ... well, you get the idea. All that information at their fingertips enables the good folks in the network operations center (NOC) to keep the network up and functional.
As things change, the information is reported to the NOC, where decisions can be made to set things right. Using the capability of an NMS-equipped network, administrators can make tactical decisions to address acute situations, or they can use the trending information for strategic purposes.
It wasn’t all that easy, but after many years of development, the network management people have successfully closed the loop, and our networks have become a commodity resource because of it.
We have no such solution in the security world.
Précis
I start our journey through this chapter by discussing a new way to look at our network and the security systems that inhabit it. As discussed in the previous chapters, our present methods aren’t working, so I discuss a new process that will help us understand how our network technology interacts with our security technology. Each system has a distinct role and a unique mode of operation. When we understand these control modes, we can begin to understand how they talk and who they talk to. Like the NMS systems, we need a way to leverage communications protocols in a way that gets us information quickly and reliably.
Now the hard part: We’re going to have to map our business processes to our security model. I say “hard” because when I’ve seen security fail, a good many times the reason it happened was because the security process didn’t mesh properly with the goals and objectives of the business. We already know that if it’s a choice between better security and higher profits, security gets the axe.
At the end of the chapter, I cover one other issue: nomenclature and iconology. Every engineering discipline has its own language and way of expressing things pictorially. Security people have resorted to drawing pictures of walls to represent firewalls, and I think that it’s time we begin to standardize on some schematic representations that enable us to convey the complexity of our environments in a concise manner.
When these really easy things are complete, we can begin to understand what is missing in our present network, build a better model of our network, and understand how we can use the endpoints to control the amount of risk introduced into the enterprise.
Special Points of Interest
Any time you use a toilet to explain something, especially something as serious as the flaws in network security, you should expect the occasional snicker or guffaw. Many people have used “toilet humor” through the years to highlight elements of our society that we don’t like to discuss in public forums. From Frank Zappa to South Park, toilet humor has been used as a way of getting a message out. So it is with this chapter. So, I ask you to open your mind up a bit as you read this chapter, because I’m going to apply process control as a method to understand our present security problem, and I’m going to use a toilet to explain why it works.
As you might suspect, this isn’t a traditional application, and some people will question the notion that the network can be controlled in such a way. However, I believe that I make a good case for it and provide a solid foundation for my claims.
So, this chapter is about looking at things in a different way. By deconstructing why we’re failing, we can gain some insight into a method of understanding that will enable us to apply some “new to us” technology to our solution. I say that it’s “new to us” because lots of other folks have been successfully using control processes for quite a few years. As a matter of fact, we will examine one group of dedicated control computers in Chapter 12, “Embedded Devices.” (Remember when you read Chapter 12 that I said “successfully” here, not “securely.”)
I also suggest that you pay special attention to the section that maps process control modes to existing security; that section reveals some interesting traits regarding our security technology selections to date.
At the end of this chapter, you’ll find some proposed icons and symbology that allow us to reduce a large and complex network environment to a simple drawing. I believe that this type of schematic representation of the network and its security functions is crucial to helping us understand how to build better security systems.
Present Attempts Have Failed (Present Modeling)
Many security-modeling tools are on the market, and it would be easy to spend a week listening to salespeople tell you how well their products work. These tools talk about “risk” and measure it as a product of endpoint vulnerability and the availability of a suitable exploit. If you have a vulnerability, and you have a way to exploit it, you have a risk that someone will use the exploit on your system. The message here is that if you eliminate the vulnerabilities on your network, you will be secure.
If you think about it, that’s not a bad way of attacking the problem if all you’re interested in is removing the known vulnerabilities from your network. Many networks can operate this way because they’re essentially “open” in the sense that no private data is being loaded on them and anyone can use their resources. The main concern is to keep them up and functional. Public libraries and universities operate in this mode, with the main difference being that a library owns the endpoints and a university hosts its students’ endpoints.
In the library, the users browse the Internet or do research. Some systems allow the use of office tools such as word processors and spreadsheets, but you use them at your own risk (because you’ll be leaving a copy of your data somewhere on the system). I wouldn’t be comfortable working on my diary at the local public library. To ensure that they’re as available as possible, libraries lock down their systems to the point where the user is unable to make any changes to the system at all. Users are not allowed to install software, remove software, and in some jurisdictions, browse to some sites on the Internet. I see this same type of installation at airports that have made computers available to pilots for flight planning.
At the other end of the spectrum, universities are not concerned with the security of the endpoint per se. Their concern comes from their charter regarding the network and their service level agreement with the students. The university’s mission is to provide a reliable network service to their users, and because the university doesn’t control the endpoint, they need a different way of managing the connections. They register users and the machine address that they’re working from. When they detect that a specific machine address is abusing the system, they cut it off.
The problem with this kind of an approach in a corporate environment is that it’s not practical to rely solely on vulnerability management. There are other threats to your network, such as trusted systems doing untrustworthy things.
We Don’t Understand Why
I say that “we”1 don’t understand why security continues to fail because there are so many people saying that they have the answer. To me this means that
• We have many things wrong with our networks.
• We don’t understand what’s really wrong.
• Both.
I’m one of those people who believe that the answer is really closer to the last bullet than either of the first two. The fact is that there are so many things that are broken we haven’t taken the time to figure out what the real problem is. We spend our days trying to keep the barbarians from the gates, so we don’t have the time to really craft a reliable model of our security.
Various enclaves of thought bring up good reasons for our failure, such as we don’t measure enough things, but it boils down to the fact that there are lots of broken bits and no way to replicate a successful model.
In many ways, our world is like the world of the theoretical physicist—they’re trying to make sense out of a science that they can’t see. There are many theories, but little empirical evidence to back them up. The most fleeting of these is the unification of the three forces into a grand definition of the universe. They keep hammering away at it by devising experiments to prove some minute aspect of their theories. Each time, they get one more tiny piece of evidence that brings them closer to the truth. I’m sure that one day they will succeed in completing the grand model of the universe, but we don’t have that kind of time to wait for a security solution.
We Continue to Use Old Thinking
Present systems use vulnerability management models to understand what will happen when the network is attacked. You take your vulnerability information and pop it into the model, and out comes a result that tells you how much “risk” you have of suffering an attack.
Consider a simple model where all you want to do is control the temperature in your house. Using vulnerability management as the basis for your design philosophy, you would start by getting an idea of how much heat your house leaks. The simple way to do this is to have somebody point an infrared sensor at your house and take a picture of the hot spots. This is analogous to having your network scanned for vulnerabilities.
Now that you have an idea of where the heat is leaking out, you can plug the holes using better insulation, or, if you’re cheap like me, clear plastic and duct tape.
According to the vulnerability management dogma, all you have to do to keep your temperature constant is to take periodic infrared snapshots of your house and fix the discovered leaks that might have popped up. The thinking is that there could have been a storm that tore the plastic over the windows, or worse, somebody could have opened a window and left it open. Therefore, this recurring analysis of your house is needed.
Before we move on, this is in no way intended to be a complete dissertation on the many ways one can model a network, but I believe that a brief description of the most popular methods will help lay the foundation for what we’re going to talk about later.
Threat modeling is a way to understand how an attacker would attempt to breach your security. You start by assessing your network and applications the way an attacker would. The first thing you do is scan your network using something like nmap to find out what endpoints are on your network and what applications are running.2 You then drill down into those applications using other tools to look for weaknesses. For example, your scan might have discovered a Web server that hosts a custom application that is supporting the HR benefits service. These types of applications are typically Web-based user interfaces with a database back end. The next step is to use a Web scanning tool such as nikto3 to find out whether the Web server and database are vulnerable to things such as cross-site scripting or Structured Query Language (SQL) attacks.
After you have a list of potential attack methods, you prioritize them based on the value of the target endpoint and the probability that an attack will succeed. Web servers buried deep in your enterprise behind firewalls and layers of networks are obviously less susceptible to external SQL hacking attempts than the systems in your DMZ.4 However, as you can see in Figure 3-1, anything in your DMZ is only one hop away from both sides of the security perimeter.
Figure 3-1. A simple pictogram that depicts how close the DMZ is to the Internet and how it can act as a bridge to the internal network.
Conversely, application servers on your DMZ would be the first systems that you fix because they are the most exposed.
Now that you have this list, you can better understand how a hacker might penetrate your network.
If you’ve been in the security business for more than a week, you’ve heard the term risk analysis mentioned more than once. Risk analysis is another way of looking at your vulnerabilities and determining how they can be leveraged against your enterprise.
The difference is that the result is expressed as a probability, or, as we say, risk. Now, you’re probably saying that risk is a pretty subjective thing, and you are right. There are those who say if you have a vulnerability, it’s only a matter of time before it’s exploited, and they are right, too.
You must protect this information in the strongest possible manner. It is a complete roadmap for an attacker; and if you lose it, you and your enterprise are in serious trouble. Think seriously about changing careers, because you’ll never get a job in technology again. On the other hand, you will be famous ... for a short time.
There are other, more esoteric modeling techniques, but they all pretty much use the same vulnerability assessment methodology as their baseline foundation.5 The problem with this approach is that it is a reactive way of addressing the problem. Now before everyone starts filling up my inbox, the reason I say that it’s reactive is because from the time that the endpoint is deployed to the time that you do the scan, you have a vulnerability on your network.
If you start with a vulnerability-based approach, you need to ensure that every single endpoint hasn’t been compromised before you’re sure you’re more secure than when you started. Who’s to say that some evil person hasn’t already used one of your vulnerabilities to make a nice nest in your network somewhere? Not all hacks are apparent or obvious. As you will recall from Chapter 1, “Defining Endpoints,” some hacks are placed on a system for later usage.
Now please don’t run off and say, “Kadrich says that threat modeling and risk analysis are useless.” Far from it. What I am saying is that although they are indeed useful tools for helping you understand the security posture of your network, they are not the models that are going to solve our endpoint security problem.
However, I am saying that there might be another, more effective way to model the network. It might be a bit unconventional, however.
Define Network as Control Problem
Security is about control. If we can’t control our environment, we can’t give any assurances that we are secure. One day it hit me: Out security problem is really a process control problem.
Allow me to digress for a moment and explain how I reached this conclusion. I had the unique experience of being an electrical engineer while I was also responsible for securing the network. It wasn’t uncommon for me to be designing a flight termination system for a missile while I was writing the security procedures for a classified network. (By the way, if you have a sleep-deprivation problem, I highly recommend either “Standard Practices and Procedures for the Classified Network Supporting the Theater High Altitude Area Defense System” or “Range Ordinance Safety Specifications for the White Sands Missile Test Range.” The last one is a little hard to get because they’re mimeographed copies,6 but if you can get it, it’s cheaper than Ambian!)
One of my other tasks was designing and installing a system that was designed to control the world’s second largest cryo-vacuum chamber. A special type of computer called a programmable logic controller (PLC) is used to interface with the valves, pumps, switches, and sensors that are needed to simulate a deep space environment in the cryovac chamber. The computer knows what the set-points are for atmospheric pressure and temperature and manages the devices to achieve that goal. Whereas the thermostat in your house is really a bimodal control (it turns the heater on and off), my cryovac system used a proportional process control methodology. The difference is that the only feedback to your home system is via the thermostat, whereas in a process control system numerous feedback paths help to achieve and maintain a specific set-point.
Why do we need these numerous feedback paths? Because there are time constants associated with each control action. For example, when your home thermostat detects that the air temperature is too low, it turns on the heater. The heater does its job of pumping hot air back into the house through the various paths provided by the air ducts. The temperature isn’t changed instantly, so the thermostat has to wait for the warm air to reach it. What that means is that by the time the thermostat reaches the correct temperature, the temperature by the heating ducts is actually higher. The rate of change, all things being equal, is fairly constant.
The net result of this bang-bang type of control is that the temperature in the house actually varies around the set-point by a couple of degrees. If you set the thermostat to 68 degrees, the temperature in the rooms typically oscillates around the set-point, as depicted in Figure 3-2. I know that this is going to sound a bit anal, but I have a recording thermometer in my bedroom that records the minimum and maximum temperatures (along with the humidity). With the temperature set in the hallway to 68 degrees, the temperature in the master bedroom, way down the hall, records a minimum of 66 and a maximum of 70 degrees, as shown in Figure 3-2.
Figure 3-2. Typical room temperature variance around the set-point as verified in the author’s master bedroom. Notice the time difference between when the heater turns on and when the room temperature begins to rise.

Now let’s look at something also close to you—your car. If you’re fortunate enough to have a car with an environmental control system, you’ll notice that the fan is running all the time. If you look closely, you’ll also notice that the air conditioner is running. The reason is that your car uses a proportional sensor that tells the computer what the temperature is and how much difference there is between it and the desired temperature or set-point. Your car actually mixes heat and cold to produce an output air temperature designed to keep the temperature inside the car where you set it. When the sun beats down on the windows, the system mixes in more cold air. When you’re scraping snow off the windshield, it mixes in more hot air.
This how they can sell cars with dual-zone environmental controls.
I brought this up at the beginning of the chapter, and I want to discuss one more device in your life that is a great example of proportional control: the toilet in your house. Yes, the toilet in your house has a proportional control mechanism in it. As you can see in Figure 3-3, the proportional control in your toilet is a combination of two valves and a float. One valve, the refill valve, allows water to refill the system at a rate based on the position of the float. The other valve, the control valve, or as it’s known at the hardware store, the flapper valve, allows the system to be “activated” and reset.
Figure 3-3. A toilet is a basic proportional control at work. The float controls the level of water in the system within a narrow band. The pressure regulator ensures that the float and valve fill the tank to the same level every time.

When the system has completed its designed task, the reset process kicks in, and this is where the proportional control takes over. This is a fairly critical process. If not enough water is put back into the system, it fails when we try to use it. If there’s too much water put into the system, we have another, arguably less desirable, failure mode to deal with. We need the same amount of water each and every time no matter how much water pressure there is. The float connected to the refill valve provides this type of proportional control. As the float rises in the tank, it gradually closes off the opening in the valve, thereby slowing down the rate at which the tank fills until the valve is shut off completely and the tank is full. The system has been successfully reset.
When you activate the system, the water rushes out cleaning the bowl, the flapper valve closes, the float drops, and the water is allowed to refill the tank. The metric for success is simple: You look into the bowl and either know success or hit the lever again. If the system fails, the failure is obvious ... on many levels.
Map Control Modes to Technology
Because we’re looking to proportional control technology to help us solve our problem, let’s look at the basic components of that solution.
As mentioned in the preceding section, the main component in this process is the proportional control, the central process that acts as the foundation for the system. In our previous examples, we found that this process was a combination of a sensor, such as the thermostat or the float, working in conjunction with an energy source, such as the heater or the water pressure. However, we know that in those systems there is always variation. Sometimes, the doors are open a bit longer, and the heater has to run longer to catch up. The result is that the temperature in the room doesn’t stay a constant 72 degrees. It varies around the set-point by a few degrees because there is nothing to tell it how fast the room is cooling down or how fast it’s heating up.
To address the basic shortcomings of a proportional-only control, two other “helper” processes make it easier for the proportional control to do its job. These control modes are derivative and integral.
The derivative process controls the rate of change. Using our toilet process in Figure 3-3, let’s say that the water pressure doubles in the system. Because the float and valve are designed to work within a fairly narrow band of water pressure, doubling the pressure causes the tank to fill up much faster and to a slightly higher level. This is because the float and valve can’t work fast enough to prevent the overflow. So, to control the pressure, we add a pressure regulator to the system to keep the water pressure that the intake valve sees at a normal level or slightly below it. What this means is that it will take a little bit more time to fill the bowl. What this also means is derivative controls lower the response frequency of the system. Instead of 60 flushes per minute, we might only get 50 flushes.
Unfortunately, using proportional and derivative controls means that it’s possible to have a stable system that still doesn’t hit the set-point, because the resolution on the sensors is not capable of seeing the potential error. Enter integration. The integral process adds the small errors over time to create an accumulated error that forces the system to once again correct itself.
Although a toilet is a great example of a proportional control, being a simple mechanical device it’s not a great example of either a derivative or integral control. (After all, I don’t know of anyone with a regulator on his or her incoming toilet water.) So, we’ll have to go back to our climate control example to explain integration.
Our system can sample the air temperature once every 20 seconds and in doing so discovers that the temperature is 71 degrees rather than 72 degrees. Because our thermostat has only a 2-degree resolution, we need a way to tell the system that we’re not really at our set-point if we want to exactly hit 72 degrees. Integration enables us to do this by accumulating our error each time we collect a sample. We add the 1-degree difference to our feedback signal each time we take a sample. Eventually, our feedback signal exceeds our 2-degree threshold, the heater is forced back on, and the process starts all over again.
We can see that it takes all three control modes—proportional, integral, and derivative—to make a functioning PID control system. Derivative and integral functions are there to ensure that the set-point the proportional control works around is accurately achieved and maintained.
Identify Feedback Paths
The reason closed-loop control processes work is because they have identified what kind of feedback they need to close the loop. In the heating example, it’s the thermometer in the various rooms. In the toilet example, the feedback path is the float. As the water rises, it pushes the float and slowly closes off the valve.
The lesson here is that feedback can be either electronic or mechanical. We just need to identify what kind of feedback we need in our system. The good news is that an examination of our network reveals that it’s just one big potential feedback loop!
Each system that lives on the network produces logs and alerts, and most can exchange management messages. Authentication protocols are designed to provide a feedback loop such that failed attempts are reported as alerts and accounts can be locked out. This is a great example of an integration function because it takes a number of them over time to generate a change in the system.
Another good example of a basic feedback loop can be observed in 802.1x,7 an authentication protocol designed initially for wireless networks. 802.1x works in conjunction with a Remote Authentication Dial In User Service (RADIUS) server and can act as the backbone in a proportional control process because it can act as the valve that meters the amount of risk introduced onto the network.
An 802.1x-enabled network could query each endpoint that makes an attempt to join the network based on the following:
• Endpoint security state
• User authentication
• Resources accessed
A decision can be made to allow privileged access, decline all access, initiate a remediation plan, or allow restricted access. This is a bit more than present 802.1x authentication does, so we discuss how this works a bit later.
Identify Metrics That Influence Other Metrics
You can find some good books on metrics,8 but by using our process control model, we can more accurately identify metrics that have a greater impact on our security. As you might recall from the previous discussion, time constants are associated with the control process. By adding controls, we’re essentially adding delay lines. These delay lines can help us by slowing down the spread of fast-moving worms, or they can hurt us by slowing down the remediation process. Without understanding where and what these metrics are, we have no way of planning for their usage or implementation.
If we make the assumption that no endpoint is going to join our network unless it meets a minimum level of trust, and part of that trust is based on the security posture of the endpoint, it stands to reason that one element that we must consider is patch level.
A good metric to examine at this point is as follows:
• How many endpoints need patches?
• How many patch levels are required per endpoint?
• How long does it take to deploy new patches to the enterprise?
• How has this changed since the last time we looked at it?
An answer to these questions would look something like this:
• 546 of 785, or 70% of endpoints require patches9
• 50% require the latest patch (one level down)
• 5% require the latest two patches (two levels down)
• 2 days to approve a deployment
• 45 minutes to deploy to the enterprise
• 6% improvement over last week
Many people would measure the time it takes to load the patch file into the server and push it out to the endpoints, saying that anything else is out of their control. This would only be the tip of the iceberg, however.
Automated patch management systems do help a bit, but how many of the endpoints are truly being updated? Other, “long” time constant questions must be asked:
• How long does the approval process take for the deployment?
• How long does it take to determine just how many endpoints are on the network?
• What percentage of the endpoints meets the requirements for the patch?
• What is the difference in deployment time between desktop endpoints and critical resources?
The difference here is that these questions usually generate long-time constant-based responses because a human has to get into the loop to provide an accurate answer.
Map Business and Technology Paths
This might sound like a no-brainer, but it’s a bit more complicated when you dig into it. We’ve learned to think of technology as complex mechanisms and sophisticated software. However, if you talk to an archeologist, the stone axe is also an example of technology. Ancient technology, yes, but technology nonetheless.
I think this opinion of what “technology” is, is the reason that we ignore a major type of technology that glues our present solutions together: people. When an organization engages in process reengineering, the first thing that they do is look at the relationship of people and how efficiently they exchange information in the quest to accomplish their mission. They ask how well they use the tools that have been afforded them and how many workarounds are in place to “fix” poorly engineered processes. All too often, we’re given new technology, but instead of reexamining how we can put this new technology to good use, we just use it to take the place of an older process without understanding how it can make the overall process better.
We do this with our security technology by trying to make it completely transparent. We overlay it on top of our existing processes in the hope that we can get some level of increased protection without disturbing the user community. The problem with that is that it obscures the human element of the security problem to both the practitioners and the users.
To counter this, we must examine our business processes with respect to security so that we can understand where the human paths are with respect to the technology paths. We must also be willing to push for change where needed. Our technology paths, both human and technological, need to be understood if we’re going to create a closed-loop process.
We need to be able to identify them and measure them to understand how much of an impact any delay is going to have on our security process. For example, your organization might have an automated patch management system that pushes patches and updates out to thousands of endpoints in a few minutes. Because of this technology, you can stand up in front of the board of directors and tell them that your solution pushes updates to vulnerabilities in minutes! The problem is that in many organizations there’s a manual process of evaluating the patch, called regression testing, that can take as long as three months!
I’m not saying that you should eliminate regression testing. What I am saying is that for a process control solution to work, you must embrace the idea that you do have human feedback paths that can dramatically degrade your ability to respond to an attack. Regression testing is a business process that has a huge effect on security.
Another example of business and security intersecting is during the incident response cycle. Many people think of incident response as responding to an intrusion detection system (IDS) alert. What if I call the help desk and claim that I’m the CFO and I want my password changed? This is clearly an indicator that my network may be under attack and that something should be done, but how long will it take for this information to move through the business process of the help desk?
This means that we, as security people, need to understand our company’s business processes and instead of saying “no,” we need to find ways to say “yes” that encourage the business plan to grow and adapt to the changing business objectives. When new technologies appear, we need to understand how those technologies will impact our security and our ability to compete effectively in the marketplace. How many organizations, because the security group is afraid of it, haven’t deployed wireless technology regardless of its demonstrated ability to simplify deployment and reduce associated costs?
Who do you think is going to win in the marketplace when the market gets tough and margins get small? The organization afraid to use technology because their security process can’t handle it, or the agile group that understands that security and business processes can work together?
Can We Build a Better Model?
I believe the answer to this question is a resounding yes. I think that most of what we need is already here; we just need to connect it a little better than we have in the past.
The answer lies in identifying how we allow risk to be introduced into our networks and setting a low limit that prevents endpoints that don’t meet our criteria from joining. That instantly begs the question of how to define risk. Well, I think that’s the wrong question to ask. I think we need to ask this: What is an acceptable risk? When I go car shopping, I know what I don’t want. I don’t want a car that’s so old that it doesn’t have air bags and antilock brakes. I don’t want a car that has broken windows and bald tires. I don’t want a car that has a torn-up interior or rusty fenders.
I know that I can have a mechanic go over the car with a fine-tooth comb, but that won’t eliminate the possibility of a flat tire or an exploding engine later on. I’ve reduced my risk by examining the car prior to buying it, but I still run the risk that something could happen later.
What I have done by taking the effort to examine the car is begin the process of engendering trust. By setting a minimum level of capability, I have enabled myself to trust the system—in this case, my car—to behave in a manner acceptable to me. I believe that this is also possible on our networks. By setting a minimum level of capability, we can set a minimum level of trust in the systems that join our network.
Identifying Control Nodes
Now that we have a new way of approaching the problem using closed-loop process control, all we have to do is identify those parts of our network that can assist with the basic control modes associated with proportional, integral, and derivative controls.
Map Technology to Control Nodes
A control node is a place where we can enforce a condition or extract data for the purposes of managing the process. In our networks, we have multiple devices that we can easily consider control nodes, including the following:
• Switches
• Routers
• VPN gateways
• DHCP servers
These are great examples of control nodes because they all have the capability to decide what happens to the traffic that passes through them. In addition, they all can report data that enables us to make other decisions in support of either derivative or integral control functions.
From a basic security perspective, we also have the following:
• Firewalls
• IDSs (intrusion detection systems)
• IPSs (intrusion prevention systems)
• AV systems (antivirus systems)
Map Control Nodes to Control Modes
When we consider their roles in our PID-based solution, we can see that most of these systems, with a few exceptions, fall under the category of derivative controls. Their purpose is to help us understand just how fast things are changing and to give us notice that we might have to deal with an overshoot of our expected status quo. I say “overshoot” because it’s not often that our systems notify us that nothing is happening.
As mentioned previously, we can use some log information to provide an integration function. Three failed login attempts and the endpoint is locked out for a period of ten minutes is a good example of this function.
The exceptions I was referring to earlier are firewalls and VPN concentrators. Firewalls and VPN concentrators can also function as proportional controls if their operation is tied to some action such as limiting traffic loads rather than the simple bimodal yes or no. However, some people are not comfortable with the idea that an automated system can change the configuration of the network. Failures have occurred, and money has been lost, so now there is usually a human in the loop.
In Table 3-1, you can see how the different types of technology map to the four control modes. Devices can be classified as proportional, derivative, or integral. Some devices are simple bimodal on or off and are called bang-bang controls.
Table 3-1. Devices Mapped to Control Modes
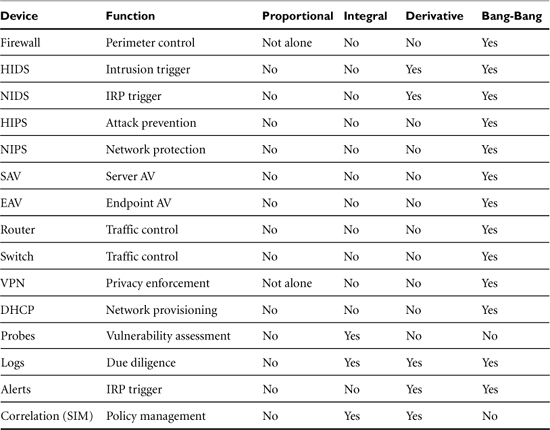
Now, just to confuse things a little, all these systems also function as bang-bang controls, because they make binary decisions about what to do with traffic. Either it passes traffic or it doesn’t. I think it’s this dual-mode operation has masked their possible contribution as control systems.
Quantify Time Constants
A time constant is just the amount of time it takes to complete any specific part of the process. If it takes one minute to fill the toilet bowl prior to a reflush, the time constant for that process is one minute. If you try to recycle the process before the time constant completes, you wind up with less than satisfactory results. To have an effective process control system, you must understand these time constants; otherwise, you risk creating a system that oscillates wildly around the set-point.
The hard part is identifying them in your process and accurately measuring them. This is part of what the metrics people are trying to do. The problem is that each enterprise has a different set of requirements and dependencies, and therefore the same process in a different environment has different time constants associated with it.
Let’s look at the incident response cycle again. Every enterprise that has a decent security program has an incident response plan. It’s triggered when something evil happens and an alert is sent “somewhere.” Maybe the IDS has seen a suspicious packet stream and has sent out an alert, or perhaps the help desk has too many trouble tickets complaining of slow systems. In many cases, this alert is sent to the security group. Someone with a pager gets the alert and either runs to a computer or, if that person is off-site, makes a phone call. That call can be to someone close to the system or it can be to the data center. After the call has been made, the process of evaluating the event kicks into gear, and the decision process takes over:
• Is it a truly evil event?
• Is it internal or external?
• Are we hemorrhaging data?
• Can we recover?
• Do we need to call law enforcement?
• How much time has elapsed since the initial alert?
For most organizations, this time constant will probably be on the order of minutes.
By deconstructing the processes, you can discover how long each individual part of it takes, and thus identify where you should put your effort to improve it. Each breakpoint in the process is an opportunity to gather some information about the state of the process.
We can move from the alerting entity to the notification channel, through the analysis process, and into the resolution process, tracking the time it takes for each. For example, we examine our analysis portion of our hypothetical process and discover that the notification process takes more than 15 minutes. Clearly, 15 minutes is not a reasonable time to be notified that a critical condition exists on your network.
Another benefit of this effort is to identify exactly where the various control nodes in your network are, be they technological or human based. You now have a list that you can use or pass on to someone else. What you’ve done is move from a talent-based response to a role-based response that doesn’t pigeonhole you as a resource. You’ll also discover that the human-based process components are the ones with the long time constants and, by the way, the ones with the lowest level of repeatability and reliability.
Control Paths and the Business Processes
You might be wondering what exactly a control path is. A control path is the path that the control and feedback signals take to change the set-point of the system. I believe that you need to map your control paths to the business processes to understand where the cracks in the security process are. Understanding how control signals are generated and understanding where they go, and possibly don’t go, can prove critical to your success. This can also help you understand where a little bit of automation can make your life a lot easier (and identify some important metrics).
Let’s start by looking at some of the information that passes through a control path. We’ll call this our control signal. Perhaps that will help us understand how the business process affects our control process. Because we’re talking about security, let’s define a control signal as anything that is security relevant, such as the following:
• Failed login attempts
• Firewall rule violations
• IDS alerts
• New user requests
• User termination
• New software requests
• New protocol requests
• Software decommissioning
• Network access requests
Next, we have to ask ourselves how much of this information is made available to us by our control nodes as they were defined in the previous section, and how much is made available to us by the business process. As you can see, things such as firewall rule violations and IDS alerts are more like spam, because they’re “made available” to us all the time in large numbers. However, the rest of them are made available to us through a business process that may or may not include the security group in the notification path.
The other sad part of this story is that all these processes are open loop—that is, there is no notification that they were completed, denied, or simply disregarded. How do you manage network access requests? Does a verification process occur prior to the decision to allow access? In most cases, the answer is yes, but only for that particular moment. After access has been granted, there is little follow-up to ensure that the system remains compliant with policy, so our control process breaks at the point where we hand the user his or her system.
Another good example starts with a question: Where do login errors go, and how are they processed? A large number of failed logins can indicate that someone is trying to break into your network. If that’s the case, the behavior of the network should change in a way that attempts to eliminate those login attempts. In many cases, low-frequency failures are not noticed because they don’t trigger the “three failed attempts per hour” rule. This kind of low and slow attack can easily be automated, but is difficult to detect. An interesting metric that you can use as a control signal is the number of failed login attempts compared to the number of successful attempts per user over a longer period of time (for example, a day). You can then compare that number to the preceding day and look for trends.
Completing the Picture
I’m starting this section with some questions: How do we capture the configuration information of our network and processes and do it in a way that enables us to share that information with other professionals? How do we gather all this process control information and represent it in a meaningful way? I suppose we have to start by asking this: What does our network look like?
Some people subscribe to an organic analogy and say that the network is a living organism. Others think that the network is better envisioned as a biosphere. I suppose people are comfortable with organic analogies because it’s easier to identify with something that you’re familiar with. We’re organic, so why shouldn’t our view of all things be an organic one? The short answer: because the random nature and boundless complexity of life simply doesn’t exist in our networks. Our networks are designed by humans, built by humans, used by humans, and abused by humans. It stands to reason that humans should be able to understand and document them in a reasonable fashion.
Because I’m an engineer, I approach this from an engineer’s perspective. Simply put, our networks are really just bits of electronic technology connected by electronic technology into larger and larger islands of electronic technology. The problem is that the islands have gotten so large that it’s difficult, if not impossible, for the biological humans who manage them to visualize them.
Another problem is that to properly describe our problem, we need to be able to visualize it so that we can discuss it and share our thoughts with others. Therein lies another problem: Security people have no common nomenclature or iconology to describe our problem. Sure, we have firewalls and IDSs, but how do you draw a picture of it? Even the networking folks resort to drawing pictures of switches. Each vendor has their own clip art libraries that work with programs such as Visio that allow engineers to render network diagrams in great detail. However, no standard set of schematic representations exists.
In our world, if you put 5 people in front of a white board and tell them to draw a picture of a 22-user network that has a firewall, a DMZ, and 25 endpoints of which 20 are user systems, 3 are servers, and 2 are the firewall and switch, you’ll get 5 different drawings! We’ve all been there, in a meeting, and someone draws a firewall as a box with some cross-hatching in it to represent the bricks. Or, they draw a wall and draw flames over it to signify a firewall. Then come the boxes and the notes that are supposed to add clarity to it. When you come back to the white board the next day, you have to spend some time reinterpreting the drawing. What if you get it wrong? “Was that 25 users and 22 endpoints, or was it 25 endpoints and 22 user systems?”
What I’m proposing is that we begin by defining some basic terms and icons so that we can talk about the process from a high level and drill down into more detail as needed. I’ll start by saying that there are two basic kinds of endpoints: sources of data and sinks for data. This isn’t an uncommon notion. If you have DSL, you probably have aDSL, which is Asynchronous Digital Subscriber Line. The aDSL protocol provides for faster download speed than upload speed because the assumption is that you’re going to be sending things such as URLs and requests for email while receiving lots of data in Web pages and your now-abundant email.
Now that we have a basic endpoint definition, we need to add some control. Routers and switches essentially provide data routing services, whether that service occurs at Layer 2 or Layer 3. We also need a security gateway, a device that compartmentalizes the network into two or more trust domains. A firewall is a good example of this type of device. Let’s add some networking icons. Figure 3-4 shows how we can start.
Figure 3-4. Basic security and networking diagram icons. Note that a source of data points toward the network; a sink of data points away. Sources and sinks of data can combine as gateways or peer connections.

Occam’s razor principle states that simple is better, that the simple answer is probably the correct one. In our security world, things start to fail when they get overly complex, so the goal is to keep our nomenclature and iconology simple. But, having a workable set of icons is only half the problem. We need a way to connect them that helps us differentiate between the different paths of information and control. Looking at Figure 3-5, we see that we need three basic types of traffic: network, infrastructure, and process. So, now we have the basic elements that we need to be able to draw a network. Putting it all together, our 22-user network would look like our drawing in Figure 3-6. You can see that we added one additional icon: a diamond that represents the number of users on the network. (Some people have suggested to me that users should be represented by a rock, but I think a diamond is more appropriate because it signifies the creative potential that many users truly represent.)
Figure 3-5. Path designations allow us to tell the difference between our network data, the infrastructure management data, and our control path data.
![]()
Figure 3-6. A complete schematic drawing of our 22 users, 23 endpoints, firewall, switch, and the Internet. Note that the DMZ network is empty.
Now that we have the basic network elements, we need to add the process control modes to our lexicon. I selected the icons in Figure 3-7 because I believe that they quickly and easily represent their function. The up arrow in the integration function shows the accumulation of error; the horizontal arrow depicts a stable set-point. Just to confuse things a bit, the device that performs the derivative function is also referred to as a differentiator (and thus the downward arrow as depicted in Figure 3-7). A bang-bang control is pretty much on or off, so I thought a simple switch would do nicely.
Figure 3-7. Icons for the four basic control modes. A differentiator provides the derivative data, and the integrator provides integral data for the summation function.

We have some good schematic icons, but we still haven’t identified the summation or correlation points. I think that the icons in Figure 3-8 will work well because they visually represent their function. Okay, maybe the bull’s eye is a reach for the correlation function, but I think it still works.
Figure 3-8. Summation and correlation functions. Summation adds the PID signals to produce an output, whereas correlation provides either integral or derivative signal outputs.

Note that correlation and summation are not the same process. Correlation examines data looking for trends; summation adds control inputs in an attempt to provide a master control.
Now that we have some basic tools, let’s look at a couple of drawings that pull it all together.
Examining our climate control problem and using the schematic icons outlined in this section, a drawing of our climate control system looks like Figure 3-9. Notice that the room is depicted as a sink and that it’s between the thermostat and the control process.
Figure 3-9. A graphic depiction of our climate control system using process control icons P, D, I, and S.

We need to discuss one more process control element: gain. Gain is the multiplier that acts to increase or decrease the impact of our control inputs. Think of it as leverage in the system. In this case, the gain of the system is fixed by the size of the room. If the heater capacity remains the same, and we increase the size of the room, it will take longer for the heater to move the temperature to the desired set-point. The implication here is that the gain of the system has been reduced.
So, now that we have a method and some nomenclature for depicting our control process, let’s apply it to our network. Adding to the 25-user network we defined in the early paragraphs of this chapter, we can make some basic assumptions about our network:
• We have a system for probing our network for vulnerabilities.
• We have some way of identifying intrusion attempts.
• Gain is going to be controlled by how many systems we have.
Looking at Figure 3-10, we can see that our network has the following:
• 25 registered users
• 28 endpoints in total
• 22 user endpoints
• 1 firewall
• 1 probe system
• 1 security information manager
• 1 IDS
• 1 switch (infrastructure)
• 1 connection to the Internet
Figure 3-10. A process control depiction of our fictitious network. Note that the control outputs terminate at a summation point that has no input back into the system.
Looking at this in light of our control nomenclature, we have the following:
• 24 sinks (user endpoints, IDS, SIM)
• 4 sources (servers and probe)
• 1 integrator (IDS)
• 1 differentiator (probe)
• 1 correlator (SIM)
• 1 bang-bang (firewall)
• 1 control device
It becomes pretty obvious that we’re missing a few critical components. The control outputs from the probe, the IDS, and the SIM go to a summation function, which isn’t defined! We need to understand what this missing mystery function is. It’s clearly not the SIM, because the SIM is yet another provider of feedback into the system. The SIM doesn’t affect the security set-point of the system, and the purpose of the summation process is to provide a control input. However, a great deal of valuable endpoint-related information gets sent to the SIM. Perhaps some of this information, in conjunction with something new, can help us identify this missing summation process.
Key Points
The old way of modeling networks—that networks are living organisms that can’t be controlled—is based on thinking that doesn’t take into account basic science and engineering principles. Unfortunately for us, this kind of thinking has controlled our network designs and management techniques for too long.
We Need a Better Idea
The fact that we’re not gaining any ground in the security world tells us that we need a better idea. We need to understand how our systems interact and how the information that they produce can be used to our advantage. We need to apply basic engineering control principles to our network to control how risk is introduced so that we can predict how our networks are going to react when they are attacked.
Trust vs. Risk
Although risk is an important factor in determining the overall state of security for a network, perhaps a better way of looking at individual endpoints should be based on trust. By setting a minimum level of configuration for each endpoint, you begin to build the element of trust into each system. You trust that a system will behave in a predescribed manner when faced with security stress.
Process Control Helps Build a Model
The basic engineering principle that can help us is based on process control technology. Process control technology uses the PID algorithm to ensure that a predetermined set-point is achieved and maintained within identified limits.
All the devices on the network have a role, and that role can be associated with some form of control. By using this new model, we can more accurately set an acceptable limit of risk, build trust, and thus protect our networks more effectively. In addition, we can identify those elements of technology that are wasting our time and budget, because we will more easily understand their role and contribution in the solution.
Business Processes Cannot Be Ignored
As you map control processes to control modes and feedback paths, you must remember to look at the business process that they affect (and vice versa). The human element plays a large role in those processes and in many cases is the most unreliable or variable element within it.
We Need a Common Language
Like all other engineering disciplines, the information security discipline needs a universal set of icons and nomenclature that allows security professionals to exchange information effectively and reliably. Our present system of scratching out bricks with fire on them and clouds representing networks and the associated endpoints isn’t working.
The set of icons presented in this chapter form the foundation for a schematic representation of our security elements and their associated control processes.