
4. Case Study: FCAPS System
We now present a case study of using ADD 3.0 for a greenfield system in a mature domain. This case study details an initial design round composed of three iterations and is based on a real-world example. We first present the business context, and then we summarize the requirements for the system. This is followed by a step-by-step summary of the activities that are performed during the ADD iterations.
4.1 Business Case
In 2006, a large telecommunications company wanted to expand its Internet Protocol (IP) network to support “carrier-class services”, and more specifically high-quality voice over IP (VOIP) systems. One important aspect to achieve this goal was synchronization of the VOIP servers and other equipment. Poor synchronization results in low quality of service (QoS), degraded performance, and unhappy customers. To achieve the required level of synchronization, the company wanted to deploy a network of time servers that support the Network Time Protocol (NTP). Time servers are formed into groups that typically correspond to geographical regions. Within these regions, time servers are organized hierarchically in levels or strata, where time servers placed in the upper level of the hierarchy (stratum 1) are equipped with hardware (e.g., Cesium Oscillator, GPS signal) that provides precise time. Time servers that are lower in the hierarchy use NTP to request time from servers in the upper levels or from their peers.
Many pieces of equipment depend on the time provided by time servers in the network, so one priority for the company was to correct any problems that occur on the time servers. Such problems may require dispatching a technician to perform physical maintenance on the time servers, such as rebooting. Another priority for the company was to collect data from the time servers to monitor the performance of the synchronization framework.
In the initial deployment plans, the company wanted to field 100 time servers of a particular model. Besides NTP, time servers support the Simple Network Management Protocol (SNMP), which provides three basic operations:
![]()
set() operations: change configuration variables (e.g., connected peers)
![]()
get() operations: retrieve configuration variables or performance data
![]()
trap() operations: notifications of exceptional events such as the loss or restoration of the GPS signal or changes in the time reference
To achieve the company’s goals, a management system for the time servers needed to be developed. This system needed to conform to the FCAPS model, which is a standard model for network management. The letters in the acronym stand for:
![]() Fault management. The goal of fault management is to recognize, isolate, correct, and log faults that occur in the network. In this case, these faults correspond to traps generated by time servers or other problems such as loss of communication between the management system and the time servers.
Fault management. The goal of fault management is to recognize, isolate, correct, and log faults that occur in the network. In this case, these faults correspond to traps generated by time servers or other problems such as loss of communication between the management system and the time servers.
![]() Configuration management. This includes gathering and storing configurations from network devices, thereby simplifying the configuration of devices and tracking changes that are made to device configurations. In this system, besides changing individual configuration variables, it is necessary to be able to deploy a specific configuration to several time servers.
Configuration management. This includes gathering and storing configurations from network devices, thereby simplifying the configuration of devices and tracking changes that are made to device configurations. In this system, besides changing individual configuration variables, it is necessary to be able to deploy a specific configuration to several time servers.
![]() Accounting. The goal here is to gather device information. In this context, this includes tracking device hardware and firmware versions, hardware equipment, and other components of the system.
Accounting. The goal here is to gather device information. In this context, this includes tracking device hardware and firmware versions, hardware equipment, and other components of the system.
![]() Performance management. This category focuses on determining the efficiency of the current network. By collecting and analyzing performance data, the network health can be monitored. In this case, delay, offset, and jitter measures are collected from the time servers.
Performance management. This category focuses on determining the efficiency of the current network. By collecting and analyzing performance data, the network health can be monitored. In this case, delay, offset, and jitter measures are collected from the time servers.
![]() Security management. This is the process of controlling access to assets in the network. In this case, there are two important types of users: technicians and administrators. Technicians can visualize trap information and configurations but cannot make changes; administrators are technicians who can visualize the same information but can also make changes to configurations, including adding and removing time servers from the network.
Security management. This is the process of controlling access to assets in the network. In this case, there are two important types of users: technicians and administrators. Technicians can visualize trap information and configurations but cannot make changes; administrators are technicians who can visualize the same information but can also make changes to configurations, including adding and removing time servers from the network.
Once the initial network was deployed, the company planned to extend it by adding time servers from newer models that might potentially support management protocols other than SNMP.
The remainder of this chapter describes a design for this system, created using ADD 3.0.
4.2 System Requirements
Requirement elicitation activities had been previously performed, and the following is a summary of the most relevant requirements collected.
4.2.1 Use Case Model
The use case model in Figure 4.1 presents the most relevant use cases that support the FCAPS model in the system. Other use cases are not shown.

Each of these use cases is described in the following table:


4.2.2 Quality Attribute Scenarios
In addition to these use cases, a number of quality attribute scenarios were elicited and documented. The six most relevant ones are presented in the following table. For each scenario, we also identify the use case that it is associated with.

4.2.3 Constraints
Finally, a set of constraints on the system and its implementation were collected. These are presented in the following table.

4.2.4 Architectural Concerns
Given that this is greenfield development, only a few general architectural concerns are identified initially, as shown in the following table.

Given these sets of inputs, we are now ready to proceed to describe the design process, as described in Section 3.2. In this chapter, we present only the final results of the requirements collection process. The job of collecting these requirements is nontrivial, but is beyond the scope of this chapter.
4.3 The Design Process
We now ready to make the leap from the world of requirements and business concerns to the world of design. This is perhaps the most important job for an architect—translating requirements into design decisions. Of course, many other decisions and duties are important, but this is the core of what it means to be an architect: making design decisions with far-reaching consequences.
4.3.1 ADD Step 1: Review Inputs
The first step of the ADD method involves reviewing the inputs and identifying which requirements will be considered as drivers (i.e., which will be included in the design backlog). The inputs are summarized in the following table.

4.3.2 Iteration 1: Establishing an Overall System Structure
This section presents the results of the activities that are performed in each of the steps of ADD in the first iteration of the design process.
4.3.2.1 Step 2: Establish Iteration Goal by Selecting Drivers
This is the first iteration in the design of a greenfield system, so the iteration goal is to achieve the architectural concern CNR-1 of establishing an overall system structure (see Section 3.3.1).
Although this iteration is driven by a general architectural concern, the architect must keep in mind all of the drivers that may influence the general structure of the system. In particular, the architect must be mindful of the following:
![]() QA-1: Performance
QA-1: Performance
![]() QA-2: Modifiability
QA-2: Modifiability
![]() QA-3: Availability
QA-3: Availability
![]() QA-4: Performance
QA-4: Performance
![]() CON-2: System must be accessed through a web browser in different platforms—Windows, OSX, and Linux
CON-2: System must be accessed through a web browser in different platforms—Windows, OSX, and Linux
![]() CON-3: A relational database server must be used
CON-3: A relational database server must be used
![]() CON-4: Network connection to users workstations can have low bandwidth and be unreliable
CON-4: Network connection to users workstations can have low bandwidth and be unreliable
![]() CRN-2: Leverage team’s knowledge about Java technologies
CRN-2: Leverage team’s knowledge about Java technologies
4.3.2.2 Step 3: Choose One or More Elements of the System to Refine
This is a greenfield development effort, so in this case the element to refine is the entire FCAPS system, which is shown in Figure 4.2. In this case, refinement is performed through decomposition.

4.3.2.3 Step 4: Choose One or More Design Concepts That Satisfy the Selected Drivers
In this initial iteration, given the goal of structuring the entire system, design concepts are selected according to the roadmap presented in Section 3.3.1. The following table summarizes the selection of design decisions. Note that all of the design concepts used in this case study are also described in Appendix A.


4.3.2.4 Step 5: Instantiate Architectural Elements, Allocate Responsibilities, and Define Interfaces
The instantiation design decisions considered and made are summarized in the following table:

The results of these instantiation decisions are recorded in the next step. In this initial iteration, it is typically too early to precisely define functionality and interfaces. In the next iteration, which is dedicated to defining functionality in more detail, interfaces will begin to be defined.
4.3.2.5 Step 6: Sketch Views and Record Design Decisions
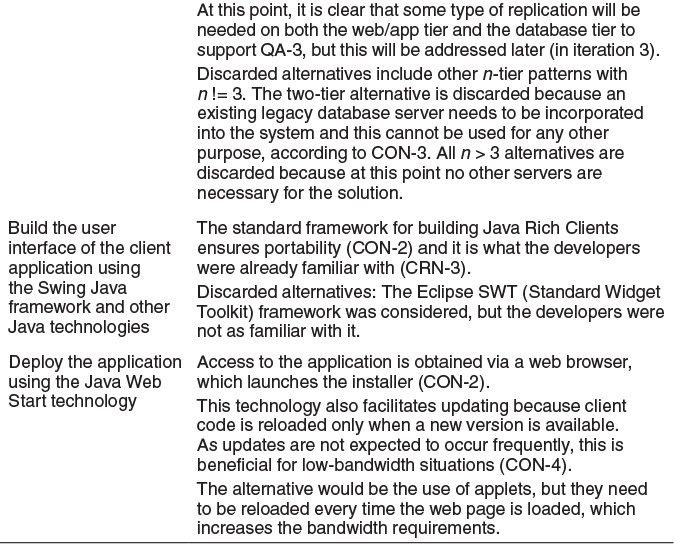
The diagram in Figure 4.3 shows the sketch of a module view of the two reference architectures that were selected for the client and server applications. These have now been adapted according to the design decisions we have made.

This sketch was created using a CASE tool. In the tool, each element is selected and a short description of its responsibilities is captured. Note that the descriptions at this point are quite crude, just indicating major functional responsibilities, with no details. The following table summarizes the information that is captured:


The deployment diagram in Figure 4.4 sketches an allocation view that illustrates where the components associated with the modules in the previous diagram will be deployed.

The responsibilities of the elements are summarized here:

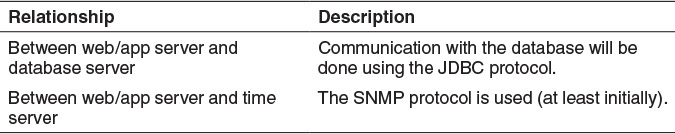
Also, information about relationships between some elements in the diagram that is worth recording is summarized in the following table:
4.3.2.6 Step 7: Perform Analysis of Current Design and Review Iteration Goal and Achievement of Design Purpose
The following table summarizes the design progress using the Kanban board technique discussed in Section 3.8.2.


4.3.3 Iteration 2: Identifying Structures to Support Primary Functionality
This section presents the results of the activities that are performed in each of the steps of ADD in the second iteration of the design process for the FCAPS system. In this iteration, we move from the generic and coarse-grained descriptions of functionality used in iteration 1 to more detailed decisions that will drive implementation and hence the formation of development teams.
This movement from the generic to the specific is intentional, and built into the ADD method. We cannot design everything up front, so we need to be disciplined about which decisions we make, and when, to ensure that the design is done in a systematic way, addressing the biggest risks first and moving from there to ever finer details. Our goal for the first iteration was to establish an overall system structure. Now that this goal has been met, our new goal for this second iteration is to reason about the units of implementation, which affect team formation, interfaces, and the means by which development tasks may be distributed, outsourced, and implemented in sprints.
4.3.3.1 Step 2: Establish Iteration Goal by Selecting Drivers
The goal of this iteration is to address the general architectural concern of identifying structures to support primary functionality. Identifying these elements is useful not only for understanding how functionality is supported, but also for addressing CRN-3—that is, the allocation of work to members of the development team.
In this second iteration, besides CRN-3, the architect considers the system’s primary use cases:
![]() UC-1
UC-1
![]() UC-2
UC-2
![]() UC-7
UC-7
4.3.3.2 Step 3: Choose One or More Elements of the System to Refine
The elements that will be refined in this iteration are the modules located in the different layers defined by the two reference architectures from the previous iteration. In general, the support of functionality in this system requires the collaboration of components associated with modules that are located in the different layers.
4.3.3.3 Step 4: Choose One or More Design Concepts That Satisfy the Selected Drivers
In this iteration, several design concepts—in this case, architectural design patterns—are selected from the book Pattern Oriented Software Architecture, Volume 4. The following table summarizes the design decisions. The words in bold in the following table refer to architectural patterns from this book, and can be found in Appendix A.

4.3.3.4 Step 5: Instantiate Architectural Elements, Allocate Responsibilities, and Define Interfaces
The instantiation design decisions made in this iteration are summarized in the following table:

While the structures and interfaces are identified in this step of the method, they are captured in the next step.
4.3.3.5 Step 6: Sketch Views and Record Design Decisions
As a result of the decisions made in step 5, several diagrams are created.
![]() Figure 4.5 shows an initial domain model for the system.
Figure 4.5 shows an initial domain model for the system.

![]() Figure 4.6 shows the domain objects that are instantiated for the use case model in Section 4.2.1.
Figure 4.6 shows the domain objects that are instantiated for the use case model in Section 4.2.1.

![]() Figure 4.7 shows a sketch of a module view with modules that are derived from the business objects and associated with the primary use cases. Note that explicit interfaces are not shown but their existence is assumed.
Figure 4.7 shows a sketch of a module view with modules that are derived from the business objects and associated with the primary use cases. Note that explicit interfaces are not shown but their existence is assumed.

The responsibilities for the elements identified in Figure 4.7 are summarized in the table that begins on page 95.

The following sequence diagrams for UC-1 and UC-2 were created in the previous step of the method to define interfaces (as discussed in Section 3.6). A similar diagram was also created for UC-7 but is not shown here due to space limitations.
UC-1: Monitor Network Status
Figure 4.8 shows an initial sequence diagram for UC-1 (monitor network status). It shows how the user representation of the topology is displayed on startup (after the user has successfully logged into the system). Upon launch, the topology is requested from the TopologyController on the server. This element retrieves the root region through the RegionDataMapper and returns it to the client. The client can then populate the view by traversing the relationships within the Region class.

From the interactions identified in the sequence diagram, initial methods for the interfaces of the interacting elements can be identified:
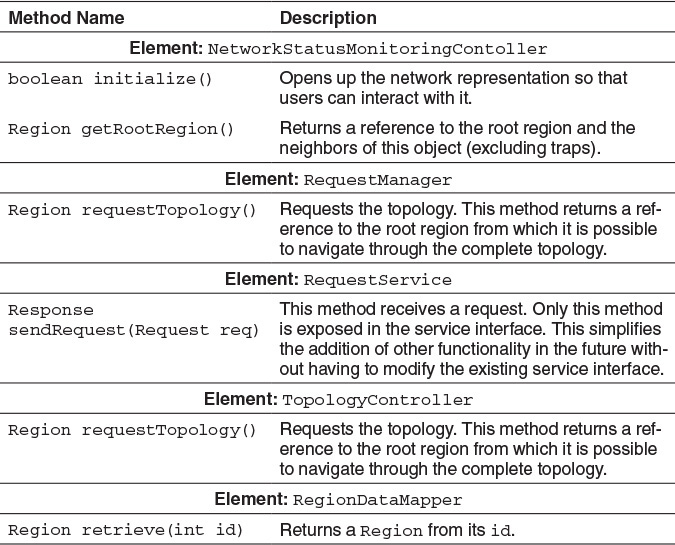
UC-2: Detect Fault
Figure 4.9 shows an initial sequence diagram for UC-2 (detect fault) shows only the components on the server side. The interaction starts with a TimeServer sending a trap, which is received by the TimeServerConnector. The trap is transformed into an Event and sent to the TimeServerConfigurationController. The Event is sent asynchronously to the TopologyController for publication to the clients and is then persisted.

From this interaction, initial methods for the interfaces of the interacting elements can be identified:

4.3.3.6 Step 7: Perform Analysis of Current Design and Review Iteration Goal and Achievement of Design Purpose
The decisions made in this iteration provided an initial understanding of how functionality is supported in the system. The modules associated with the primary use cases were identified by the architect, and the modules associated with the rest of the functionality were identified by another team member. From the complete list of modules, a work assignment table was created (not shown here) to address CRN-3.
Also, as part of module identification, a new architectural concern was identified and added to the Kanban board. Drivers that were completely addressed in the previous iteration are removed from the table.


4.3.4 Iteration 3: Addressing Quality Attribute Scenario Driver (QA-3)
This section presents the results of the activities that are performed in each of the steps of ADD in the third iteration of the design process. Building on the fundamental structural decisions made in iterations 1 and 2, we can now start to reason about the fulfillment of some of the more important quality attributes. This iteration focuses on just one of these quality attribute scenarios.
4.3.4.1 Step 2: Establish Iteration Goal by Selecting Drivers
For this iteration, the architect focuses on the QA-3 quality attribute scenario: A failure occurs in the management system during operation. The management system resumes operation in less than 30 seconds.
4.3.4.2 Step 3: Choose One or More Elements of the System to Refine
For this availability scenario, the elements that will be refined are the physical nodes that were identified during the first iteration:
![]() Application server
Application server
![]() Database server
Database server
4.3.4.3 Step 4: Choose One or More Design Concepts That Satisfy the Selected Drivers
The design concepts used in this iteration are the following:

4.3.4.4 Step 5: Instantiate Architectural Elements, Allocate Responsibilities, and Define Interfaces
The instantiation design decisions are summarized in the following table:

The results of these instantiation decisions are recorded in the next step.
4.3.4.5 Step 6: Sketch Views and Record Design Decisions
Figure 4.10 shows a refined deployment diagram that includes the introduction of redundancy in the system.

The following table describes responsibilities for elements that have not been listed previously (in iteration 1):

The UML sequence diagram shown in figure 4.11 illustrates how the TrapReceiver that was introduced in this iteration exchanges messages with other elements shown in the deployment diagram to support UC-2 (detect fault), which is associated with both QA-3 (availability) and QA-1 (performance).

FIGURE 4.11 Sequence diagram illustrating the messages exchanged between the physical nodes to support UC-2 (Key: UML)
As the purpose of this diagram is to illustrate the communication that occurs between the physical nodes, the names of the methods are only preliminary; they will be refined in further iterations.
4.3.4.6 Step 7: Perform Analysis of Current Design and Review Iteration Goal and Achievement of Design Purpose
In this iteration, important design decisions have been made to address QA-3, which also impacted QA-1. The following table summarizes the status of the different drivers and the decisions that were made during the iteration. Drivers that were completely addressed in the previous iteration have been removed from the table.


4.4 Summary
In this chapter, we presented an example of using ADD to design a greenfield system in a mature domain. We illustrated three iterations with different foci: addressing a general concern, addressing functionality, and addressing one key quality attribute scenario.
The example followed the roadmap discussed in Section 3.3.1. It is interesting to observe that in the first iteration, two different reference architectures were used to structure the system. Also, the selection of externally developed components—in this case, frameworks—was carried out across the different iterations. Finally, the example illustrates how new architectural concerns appear as the design progresses.
This example demonstrates how architectural concerns, primary use cases, and quality attribute scenarios can be addressed as part of architectural design. In a real system, more iterations would be necessary to create a complete architecture design by addressing other scenarios with high priority.
In this example, we assumed that the architect is using a CASE tool during design, so diagrams were produced using UML. This is certainly not mandatory, as we will see in the case study presented in Chapter 5. Also, note that it is relatively simple to generate preliminary view sketches by using the information that is generated as part of the design process.
4.5 Further Reading
Appendix A provides descriptions and bibliographical references of all the design concepts used in this case study.