
6. Case Study: Banking System
Chapters 4 and 5 were both instances of greenfield development. In truth, that kind of development is relatively rare. Most of the time you, as an architect, will be working on evolving an existing system rather than creating one from scratch. In this chapter, we present an example of using ADD 3.0 for a brownfield system in a mature domain (as discussed in Section 3.3.3). We first present the business context and then examine the project’s existing architectural documentation. This is followed by a step-by-step summary of the activities that are performed during the ADD iterations to evolve the system. While this is a real system, some of the details have been changed to protect the identities of the actors.
6.1 Business Case
In 2010, the government of a Latin American country issued a regulation that required banking institutions to digitally sign bank statements. To comply with the regulation, “ACME Bank” decided to commission the development of a software system, which we will call BankStat, whose main purpose was the generation of digitally signed bank statements.
Figure 6.1 presents a context diagram that illustrates how the BankStat system works. At its core, the system executes a batch process, which retrieves raw bank statement information from a data source (an external database) and then performs a series of validations on this data to generate the bank statements and prepare them for digital signature by an external provider. The statements are sent to the provider, which returns the signed bank statements. These statements are then stored by BankStat for further processing, including sending the statements to customers. This batch process is triggered automatically once a month and, during its execution, approximately 2 million bank statements are processed.

The following quality attributes scenarios are primary for this system:
![]() Reliability: Under normal operating conditions, the batch process is executed in its entirety 100% of the time.
Reliability: Under normal operating conditions, the batch process is executed in its entirety 100% of the time.
![]() Performance: Under normal operating conditions, when the batch process starts, 2 million bank statements are read, processed, and sent to the signing provider in at most one hour.
Performance: Under normal operating conditions, when the batch process starts, 2 million bank statements are read, processed, and sent to the signing provider in at most one hour.
![]() Availability: During normal processing, a failure may occur when reading information from the data source or when sending information for digital signature. A notification is then sent to the administrator, who manually restarts the process. When it is restarted, only the information that had not already been processed is treated.
Availability: During normal processing, a failure may occur when reading information from the data source or when sending information for digital signature. A notification is then sent to the administrator, who manually restarts the process. When it is restarted, only the information that had not already been processed is treated.
Due to time constraints imposed by the government, only the core batch process for the system was developed and put into production. This initial release, however, did not provide a friendly interface with the system, which is necessary to monitor the state of the bank statement processing, to request the reprocessing of incorrect statements. and to generate reports. In the first release, the process could only be started or stopped manually from a console. For a second release of the system, the ACME Bank requested an extension of the BankStat system to better address these shortcomings.
The following subsections present the drivers for this second release of the system.
6.1.1 Use Case Model
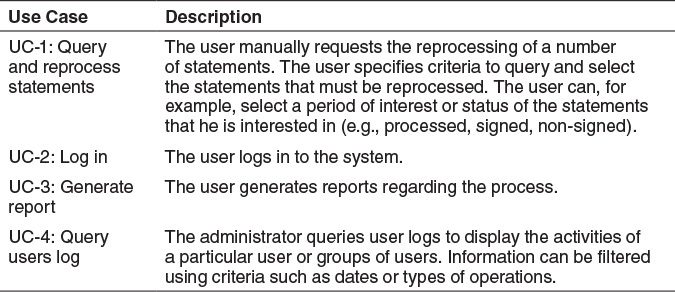
Figure 6.2 presents the use case model for the second release of BankStat.

These use cases are described in more detail here:
6.1.2 Quality Attribute Scenarios
The following table presents the new quality attribute scenario that is considered for this extension of the system.

6.1.3 Constraints
The following table presents the constraints that are considered for this extension of the system.

6.1.4 Architectural Concerns
The following table presents the concerns that are initially considered for this extension of the system.

6.2 Existing Architectural Documentation
This section presents a simplified version of the system’s views, which provide relevant information for the changes in the architecture.
6.2.1 Module View
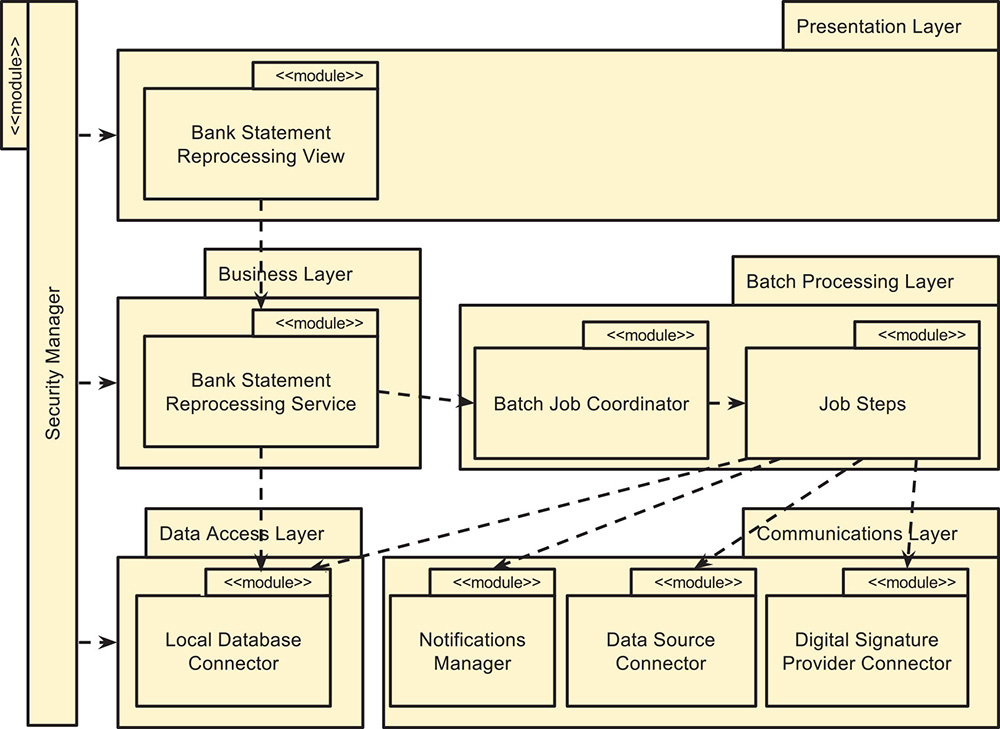
The package diagram shown in Figure 6.3 depicts the system layers and the modules that they contain.

The responsibilities of the elements depicted in the diagram are described in the following table.

6.2.2 Allocation View
The deployment diagram shown in Figure 6.4 presents an allocation view consisting of nodes and their relationships.
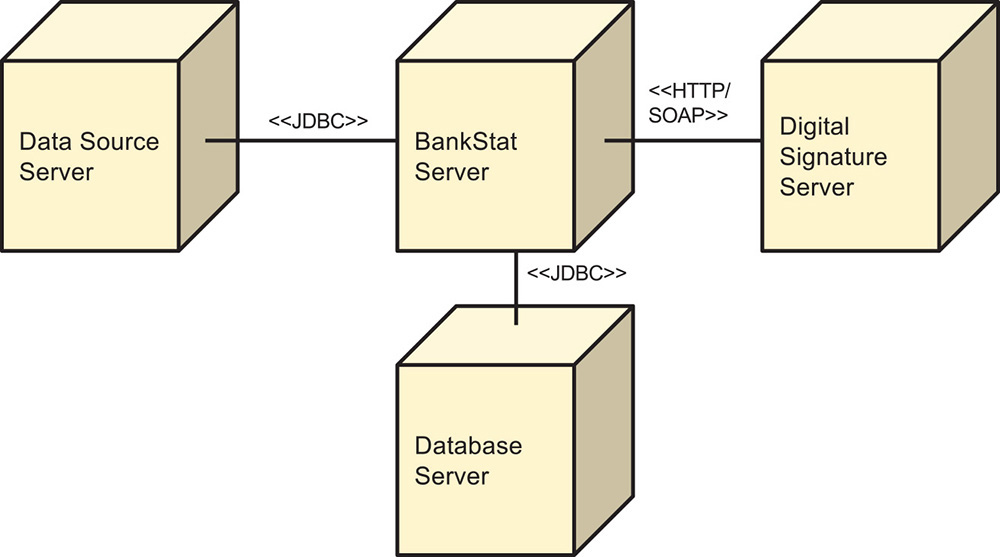
The responsibilities of the elements depicted in the diagram are described in the following table.

6.3 The Design Process
We now describe the design process through the different steps of ADD (as discussed in Section 3.2). As this is not a huge change to the existing system, the architect expects that the design activities will require only a single iteration of ADD.
6.3.1 ADD Step 1: Review Inputs
The first step of the ADD method involves reviewing the inputs. They are summarized in the following table.

6.3.2 Iteration 1: Supporting the New Drivers
This section presents the results of the activities that are performed in each of the steps of ADD in the single iteration performed in this example.
6.3.2.1 Step 2: Establish Iteration Goal by Selecting Drivers
Only a limited number of drivers need to be addressed, so the architect has decided that a single iteration is sufficient. The goal of this iteration is to modify the existing design to support all of the new drivers listed in Section 6.1
6.3.2.2 Step 3: Choose One or More Elements of the System to Refine
The elements to refine include the main modules from BankStat and the node where the system is deployed (BankStat Server). In addition to refining these modules, the physical node where the application is hosted is a candidate for refinement.
6.3.2.3 Step 4: Choose One or More Design Concepts That Satisfy the Selected Drivers
The following table summarizes the design decisions made with respect to the selection of design concepts.


6.3.2.4 Step 5: Instantiate Architectural Elements, Allocate Responsibilities, and Define Interfaces
The instantiated design decisions considered and made are summarized in the following table.

The results of these instantiation decisions are recorded in the next step.
6.3.2.5 Step 6: Sketch Views and Record Design Decisions
The deployment diagram shown in Figure 6.5 depicts the new server that will host the application and the external user directory server, along with their connections to the existing nodes.

The responsibilities of the newly introduced elements are described in the following table.

The package diagram shown in Figure 6.6 illustrates how the reference architecture is instantiated and identifies the modules that are introduced to support the primary use case (UC-1). It also shows how these newly introduced elements are integrated with the existing layers and modules from the previous system release.
The responsibilities of the newly introduced elements are described in the following table.

The sequence diagram shown in Figure 6.7 illustrates how UC-1 is performed. The user requests the state of bank statements to be displayed. This information is retrieved from the local database by the Local Database Connector. Once displayed, the user selects the statements to reprocess. These bank statements are marked for reprocessing (by changing a flag) and the information is updated on the local database. Finally, the batch job is restarted. Note that the interactions with the system are recorded by Spring Security in the view. In addition, the invocation of the Batch Job Coordinator is asynchronous, which avoids the problem of blocking the user interface.

From the interactions identified in the sequence diagram, initial methods for the interfaces of the interacting elements can be identified.
BankStatementReprocessingService

6.3.2.6 Step 7: Perform Analysis of Current Design and Review Iteration Goal and Achievement of Design Purpose
The following Kanban table summarizes the status of the various architectural drivers and the decisions that were made during the iteration to address them. As all the drivers were completely addressed, just a single iteration of ADD was required.

6.4 Summary
In this chapter, we presented a simple (but real-world) example of the use of ADD in the context of a brownfield system. As this example illustrates, the steps of ADD are followed in exactly the same manner as in the context of the design of greenfield systems. The main difference is that one of the inputs of the design process is the existing architecture. This highlights the importance of documenting the architecture: If this information was not present, a great deal of time would need to be spent in understanding and reverse-engineering the code to create an appropriate model of the architecture before proceeding with the design and eventual implementation process.
Design in the context of brownfield systems usually involves more extensive changes than the ones illustrated by this example. Such changes often require refactoring and modification of the existing architecture to support the introduction of new elements and new relationships that result from the design activity. Modifying an existing architecture is oftentimes the most challenging aspect of designing in the context of brownfield systems. In brownfield systems, it is all too common that detailed knowledge of some parts of the system has been lost. Because this process can be complex and some uncertainty exists regarding the consequences of changes, we recommend that you perform an analysis of the proposed design changes before committing them to code.
6.5 Further Reading
The Shared Database Integration pattern is discussed in G. Hohpe and B. Woolf, Enterprise Integration Patterns: Designing, Building and Deploying Messaging Solutions, Addison Wesley Professional, 2003.
In-depth discussions of software maintenance and evolution can be found in the classic book by F. Brooks, The Mythical Man Month, Addison-Wesley, 1995, and also in M. M. Lehman, “On Understanding Laws, Evolution, and Conservation in the Large-Program Life Cycle”, Journal of Systems and Software, 1:213–221, 2010.