Models for Phase B
Business Architecture
Abstract
Enterprise architecture puts very strong emphasis on business architecture, which will then shape the entire ADM cycle. Goals, objectives, organization, business processes, functions and capacities, and business entities are some of the most important aspects modeled during the business architecture phase.
Enterprise architecture puts very strong emphasis on business architecture, which will then shape the entire ADM cycle. Goals, objectives, organization, business processes, functions and capacities, and business entities are some of the most important aspects modeled during the business architecture phase.
8.1 Phase B artifacts
8.1.1 Nature of Phase B artifacts: Business architecture
Phase B is dedicated to defining business architecture (see the definition in Section 2.2.3). TOGAF defines a very rich set of artifacts related to phase B (Table 8.1). In particular, it focuses on the following elements:
Table 8.1
TOGAF Artifacts and Artifacts Presented in This Chapter
| TOGAF Artifacts | Models Presented | Comments |
| Organization/Actor catalog | Actor organization diagram | This diagram is an extension to TOGAF. It is used to produce the TOGAF catalog. The benefit of this diagram is that it represents the organization of actors through several types of link. |
| Driver/Goal/Objectives catalog | Goal diagram and catalog | Seen in phase A; phase B consolidates them. |
| Role catalog | Organization decomposition diagram—role allocation | The diagram can produce the catalog; it represents the links of the roles played by the actors. |
| Service/Function catalog | Deduced from the model. | |
| Location catalog | Location diagram | |
| Contract/Measure catalog | Deduced from the model; contracts are associated with business services. | |
| Business interaction matrix | Information is provided by “Organization decomposition diagram—role allocation” diagrams and by flow diagrams. | |
| Actor/Role matrix | Organization decomposition diagram—role allocation | The diagram can produce the catalog; it represents the links of the roles played by the actors. |
| Business footprint diagram | Business footprint diagram | |
| Service/Information diagram | Business service information diagram | |
| Functional decomposition diagram | Functional decomposition diagram | |
| Product lifecycle diagram | Product lifecycle diagram | |
| Goal/Objective/Service diagram | Goal/Objective/Service diagram | |
| Business use case diagram | Business use case diagram | |
| Organization decomposition diagram | Location organization diagram | |
| Flow diagram | Very general view of the organization as a system; an extension of TOGAF. | |
| Process flow diagram | Process flow diagram | |
| Business dictionary | Extension to TOGAF; a useful addition for defining business terminology. | |
| Conceptual data diagram | Conceptual data diagram | Pertains to data architecture; conceptual data diagrams are defined here in phase B. |
| Data dissemination diagram | Data dissemination diagram | Pertains to data architecture. |
| Data security diagram | Data security diagram | Pertains to data architecture. |
| Data migration diagram | Data migration diagram |
• The organization of the enterprise, which will be described through its organization units, actors, and roles. Its geographical distribution (sites, location) will also be presented.
• The enterprise’s capabilities, which are described in greater detail through its functions and business services.
• The enterprise’s activities, represented by its business processes.
• The essential concepts of the business, through a business dictionary and conceptual models of business entities (Table 8.2).
Table 8.2
Extract from the Dictionary of the Discount Travel Travel Agency
| Name | Definition |
| Trip | Corresponds to a formula defined by the agency and includes a destination and an accommodation service. |
| Destination | Identified by the continent (North Africa, Africa [except North Africa], Europe, Asia, North America) and the country. |
| Marketing department | The relationship with travel agencies is handled by the Marketing department. The Marketing department defines priority offers to look for among the trips proposed by travel agencies. The aim of the Marketing department is to draw up the most attractive range of trips for Discount Travel's clients. |
| Agency | Designates partner travel agencies. |
| Participant | The person taking the trip. |
| Client | The person who has ordered a trip, or the person taking a trip. |
| Accompanying person | A participant who is not the person who placed the order. |
| Accounting department | Keeps the companies accounts up to date and establishes the annual balance sheet and results. It also checks client solvency. |
| Flight | Also incorrectly called “plane"; identifies the airline, flight number, date and time of the flight, departure, and arrival of the client's air transportation. |
| Holiday | Trip service provided for one or several participants, corresponding to the trip offer, with allocated accommodation and transportation. |
• Business architecture will be optimally defined to satisfy the goals of the enterprise. Phase B participates in the definition and consolidation of goals, already presented in Section 7.3.
8.1.2 Essential concepts used in business architecture models
•  Function: Produces one of the enterprise’s capabilities. For example, “marketing,” “client contract management,” and “telemarketing” are functions.
•  Business service: Represents a service provided by the business. A business service can be realized by one or several IT services, or by other constituents of the enterprise.
• ![]() Role
Role
•  Location: Enterprise site.
•  Headquarters: A specific location, the company headquarters.
•  Organization units: Units that group the functions and capacities of the enterprise. They have resources (personnel, material), missions, and a certain degree of autonomy (for example, the sales department, the administration department).
•  Products, such as the trip or the order.
•  Business events.
•  Business process (for example, “Reserve Trip”).
•  Use case: Represents an interaction between actors and the system in order to meet a functional need.
•  Business entity: Describes the semantics of business entities, independently of any organizational or IS-related considerations (storage, technology, etc.).
• 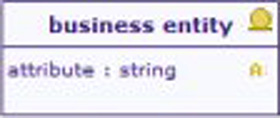 Business entity (expanded form): Enables an entity’s attributes and operations (specific services operated by this entity) to be presented.
• ![]() Association between classes: An association has a name, and provides each end with a role name and cardinality (number interval indicating the number of possible linked entity occurrences).
Association between classes: An association has a name, and provides each end with a role name and cardinality (number interval indicating the number of possible linked entity occurrences).
•  Information domain: Unit that structures business entities into coherent subdomains.
•  State: Represents one of the stable situations of a business entity or product.
8.2 The “business dictionary” artifact
8.2.1 Description of the artifact
| Name | Business dictionary |
| Experts | Business experts |
| Designers | Business analysts or business experts |
| Recipients | Business analysts, business experts, application architects |
| Aim | To stabilize and specify business terminology in order to obtain a reference for all participants |
| Useful preliminary information | Business terms |
Table 8.2 is a simplified example of a dictionary. According to different enterprise preferences, several attributes can be used to complete terms (lines in the table), such as an attribute indicating the origin of the term. Several types of links can also be used, such as synonym or homonym links. In this example, the dictionary clarifies what a “Trip” is; in this context, it is used as the definition of a trip such as those managed in the product range. However, the trip that a client actually takes is called a “holiday” here, and corresponds to an instance of a trip defined in the product range.
The terms of a dictionary can appear in different diagrams (Figure 8.1) in order to link model elements to the definitions to which they refer. In this figure, we can see class links to terms, as well as association and role links (UML) to terms.
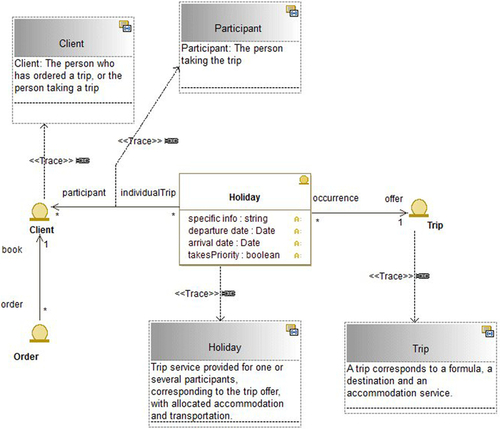
• Business entity (developed form)
• ![]() Traceability link
Traceability link
•  Dictionary term
8.2.2 Terminology: The cornerstone of business knowledge
Business knowledge requires clearly defined terminology. There is a normative need for the same meaning to be assigned to a given term by all participants, as well as a need to share knowledge by establishing a dictionary. A dictionary also aims to clarify synonyms, while limiting their number. Homonyms should be avoided in order to assign a single definition to each work, thereby avoiding confusion.
Businesses very often use norms linked to their domain, which provide an extremely useful initial dictionary. This dictionary then has to be completed by terms used within the enterprise itself. The difficulty of this task consists in finding consensus where the terms are not used in the same way by all participants. Terminological ambiguity is omnipresent within enterprises. Enterprise architecture models are then clouded by these ambiguities and unclear terminologies. Communication between participants and the quality of the results produced can be compromised. This confusion must therefore be resolved by defining a dictionary.
The existence of a dictionary is a significant asset when building an enterprise model; in particular, business entity and business process definition will make massive use of the information contained in the dictionary. For example, the dictionary contains concepts that are essential to the business, and which we also find in business entities.
The dictionary will essentially take the form of a catalog (name, definition). It can be structured into several domains, according to the range of the enterprise’s business. It is then up to analysts to decide if and how terms will subsequently be represented as more formal model elements, such as business entities. Terms can be formalized by one or several business entities, attributes, states, events, actors, and so on.
The integration of the dictionary into the model is used to manage traceability to the rest of the model. For example, the definition of a business entity can be linked to a dictionary term, thereby indicating its semantic and terminological reference.
8.3 Artifacts linked to enterprise organization
8.3.1 Concepts that support enterprise organization
Diagrams supporting enterprise organization modeling are used to establish the mapping of the organization. Roles within the enterprise are determined and positioned with regard to the organization and the different enterprise locations. Organization units, actors, roles, and locations are the key concepts used to represent the organization.
8.3.2 Actors and roles
TOGAF clearly distinguishes the two concepts of actor and role in an enterprise.
An actor is an active enterprise participant (person, system, organization) who takes part in the activities of the enterprise. For example, an “account manager” who carries out sales operations with clients is an enterprise actor. A “board of directors,” which makes decisions regarding the orientation of the enterprise is also an enterprise actor. An actor is never a physical person. It designates a category of function that participants can carry out, as well as a type of skill required. A physical person can represent several actors. This is typically the case in small to medium-sized companies, where the same person can, for example, be the “receptionist” and the “executive secretary,” or where the “sales director” can also assume the role of “marketing director.” An actor can designate a group of people (such as a “decision-making committee”) or any active entity participating in the functioning of the enterprise. In this way, it can also designate external organizations (a “partner”), or information or technical systems that play a particular role within the organization. An actor frequently designates several people who perform similar functions, such as the “account manager,” the “accountant,” and the “client.”
Identifying actors outside the enterprise helps clarify how these actors are positioned with regard to the organization: who interacts with them. They enable the enterprise to be represented as it is seen from the outside. The “client” or the “partner” are examples of typical external actors.
The role represents one of an actor’s usual or expected functions. Roles are often described as responsibilities. They establish accountability and are the foundation for enterprise governance. The role is the function that an actor performs in a particular situation. It corresponds to a certain skill domain of the actor and to the contribution the actor makes within the enterprise through the implementation of his or her skills, knowledge, experience, and capabilities. For example, a sales director performs the function of managing sales, as well as managing commercial resources. Several different actors can play identical roles. For example, the sales director, marketing director, and administrative director all play the role of managing the human resources for which they are responsible.
8.3.3 The “actor organization diagram” artifact
Description of the artifact
| Name | Actor organization diagram, actor catalog |
| Experts | Management, organization unit managers |
| Designers | Business analysts, business experts |
| Recipients | Business architects, management, organization unit managers, business process analysts |
| Aim | To define the types of positions with the enterprise, to describe their responsibilities and prerogatives. To identify participants outside the enterprise |
| Useful preliminary information | Knowledge of the enterprise, organization charts |
• ![]() Internal actor
Internal actor
• Organization unit
• Dictionary term; definition of a concept
• ![]() Responsibility links between actors, which describe the hierarchy.
Responsibility links between actors, which describe the hierarchy.
• ![]() Responsibility links from actors to organization units, which indicate who is responsible for which organization unit.
Responsibility links from actors to organization units, which indicate who is responsible for which organization unit.
•  Communication links, which indicate who communicates with whom.
• ![]() Composition links, which define the constitution of composite actors.
Composition links, which define the constitution of composite actors.
Figure 8.2 indicates that the client communicates with the account manager. The account manager reports to the sales director, who is responsible for the entire sales department and who is a member of the enterprise’s board of directors.

The actor model clarifies enterprise functioning
The definition of actors and their prerogatives, hierarchical links, and responsibilities provides valuable information on the functioning of the enterprise. Clarifying current responsibilities and roles and determining how these will evolve in the changes to come has a significant impact on enterprise architecture stakeholders, and is a key element in change management. Changes to actors, roles, responsibilities, and the nature of participants’ work are thus determined.
Defining and positioning the enterprise’s actors constitutes a good basis for defining the organization of the enterprise by providing an overview of the organization. We will also see that these models provide a very useful foundation upon which to define not only the enterprise’s business processes and use cases but also models linked to the security of and access rights to enterprise data. We know who communicates with whom, who manages what, and who is responsible for what.
Actor-centric view: Definition of positions
This model also provides precious information used to clarify the definition of positions within the enterprise.
As is the case for all diagrams, it is possible to develop views focused on each element—here, each actor. These views are useful additions to job descriptions. Furthermore, each actor is described by providing information on the skills required of him or her within the enterprise. Here we can see that in addition to the responsibilities already described, the sales manager has two enterprise goals assigned to him, is located in Paris, and is the “owner” of the “Reserve Trip” business process. Being responsible for a process implies that the actor will have to monitor the smooth progress of the process, as well as the value of performance indicators. An actor can have participation links in a business process, which will describe the tasks for which he is responsible. He can also initiate a process. Roles assigned to the actor can also be represented (see Figure 8.3), further specifying the skills expected from this actor.
Actor catalog
The actor catalog uses the elements of this model (assigned goals, responsibilities, locations, participation in processes), as well as description elements such as required skills. Allocated roles can also be presented in organization diagrams or in organization decomposition diagrams (see Figure 8.3).
• Roles: Team management, sales forecasts, reporting
• Responsibilities: Account manager(actor), sales department
• Managed processes: Reserve Trip
• Location: Paris
• Goals: Optimize client transformation rate, improve client follow-up
• Required skills: Sales management, management, sales
8.3.4 The “organization decomposition diagram—flows” artifact
| Name | Organization decomposition diagram—flows |
| Experts | Executive managers, organization unit directors |
| Designers | Business analysts |
| Recipients | Executive managers and directors, analysts |
| Aim | To provide an overview of the enterprise and essential information exchanges |
| Useful preliminary information | Knowledge of the enterprise and its organization |
• Organization unit
•  Link showing the circulation of data between active enterprise entities (actors, organization units, etc.).
The tasks and responsibilities of actors and organization units can also be represented in terms of the information flows that circulate between them. This type of representation describes the information received, processed, or sent by each participant in the organization. Presenting the information handled by participants illustrates what they need to know to perform their responsibilities within the enterprise.
In Figure 8.4, the marketing department receives information on availability from agency partners. It sends the description of the trip portfolio to both clients and account managers. This diagram therefore presents the essential information flows that are in transition within the enterprise. These are received by or sent to actors or organization units. This example focuses on the flows sent or received by external actors and processed by the enterprise’s essential organization units. This type of diagram provides a very useful first glimpse of how the enterprise functions. Its generality means that it can be understood by everyone, while providing elements that facilitate the identification of business processes and managed business entities.

This model does not show how, when, or in what order flows are exchanged and gives no indication of the nature of the flows. Other models will have to provide this information.
The flows exchanged provide interesting information on the responsibilities of the entities involved in the exchanges. For example, the marketing department must provide the portfolio of available trips, while taking into account availability and partner product ranges. Figure 8.5 shows a diagram focused on an actor (Sales Director) that is a useful summary of the responsibilities, goals and connections of the actor. Skills can be added to get a complete actor definition.

8.3.5 The “organization decomposition diagram—role allocation” artifact
| Name | Organization decomposition diagram—role allocation |
| Experts | Management, organization unit managers |
| Designers | Business analysts, business experts |
| Recipients | Business architects, organization unit managers, business process analysts |
| Aim | To define each of the functions of the different posts in the enterprise |
| Useful preliminary information | Knowledge of the enterprise, organization charts |
 External role
•  Internal role
• ![]() External actor
External actor
• ![]() Internal actor
Internal actor
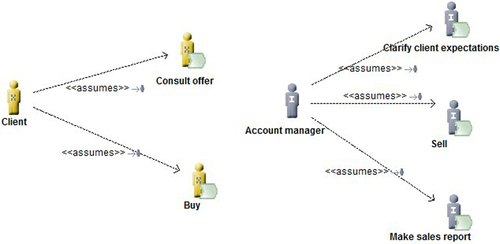
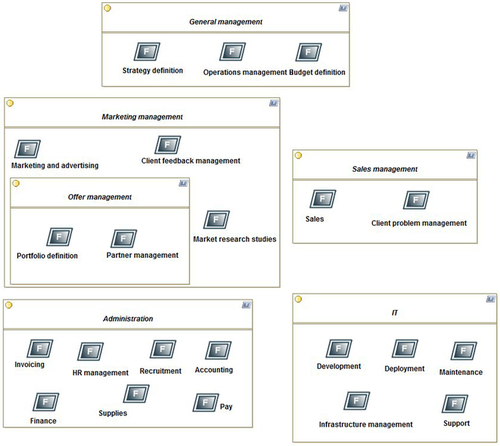
•  “Assumes” links indicating which role an actor plays.
Figure 8.3 shows which roles are played by which actors. As we can see, the account manager clarifies client expectations, sells products, and makes sales reports.
An actor plays a role in order to carry out a task in a business process. This is one of the usual or expected functions of an actor, or the part that someone or something plays in a particular situation.
Here, the “assumes” link shows which roles are played by which actors.
For example, a smaller enterprise can have the same roles as a larger enterprise in the same business, but these roles will be distributed across a smaller number of actors.
Information on which roles an actor can assume can be produced in detailed diagrams on actors (Figure 8.3) by adding “assumes” links. It can also be summarized in matrices.
8.3.6 The “location organization diagram” artifact
| Name | Location organization diagram |
| Experts | Executive managers, organization unit managers |
| Designers | Business analysts, business experts |
| Recipients | Executive managers, analysts, organization unit managers |
| Aim | To define the geographical distribution of the enterprise organization |
| Useful preliminary information | Enterprise organization |
• ![]() Internal actor
Internal actor
• Locations: enterprise headquarters
• Deployed instance of an organization unit
•  Links determining the location of actors and roles, where this is not implicit.
TOGAF defines the location organization diagram as being the description of the links that exist between actors, roles, and locations within an organizational structure. Organizational mapping procures the executive manager and decision-maker chain of command within the organization. Although this type of diagram does not focus on goal modeling, it can also link goals to associated participants.
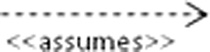
The example in Figure 8.6 represents locations and actors. The headquarters are in Paris, and there are three branches in Nantes, Toulouse, and Lyon. In this image, organization units are shown in specific locations to illustrate their deployment; the IT department is thus situated in Toulouse. These are not organization units themselves, but rather instances that appear in deployment locations. In this way, several occurrences of the same kind of organization unit can appear in different locations. Thus, the sales department is present in Toulouse, Paris, Nantes, and Lyon. We can see therefore that the majority of services are concentrated in Paris. The sales department is divided between each of the branches.
The same technique can be used to localize roles. As in Figure 8.6, we can also use the “location” dependency to represent this. However, the geographical location of roles is often implicit through their responsibility links (role to role or role to organization unit).
8.3.7 The “location diagram” artifact
| Name | Location diagram |
| Experts | Executive managers, organization unit managers |
| Designers | Business analysts, business experts |
| Recipients | Business analysts, business process analysts |
| Aim | To list the company’s sites and headquarters |
| Useful preliminary information | Organization of the enterprise |
• Location: enterprise headquarters
• Location: enterprise site
The location diagram can be used as an alternative to the TOGAF location catalog. Once established, location diagrams then enable us to represent the location of organization units and roles (phase B), and then in phase D to represent the geographical deployment of hardware and applications. Locations are used to take into account geographical constraints during the definition of enterprise architecture. Figure 8.7 shows that the headquarters of the company are in Paris, with three associated branches situated in Nantes, Toulouse, and Lyon.

8.4 Artifacts linked to enterprise functions and services
8.4.1 The “functional decomposition diagram” artifact
Description of the artifact
| Name | Functional decomposition diagram |
| Experts | Executive managers, organizational unit managers |
| Designers | Business analysts, business experts |
| Recipients | Business analysts, business process analysts |
| Aim | To determine the enterprise’s essential functions. To be able to subsequently define how these functions can best be carried out |
| Useful preliminary information | Organization of the enterprise; goals requiring evolutions or new functions |
• Function: Continually takes care of one of the enterprise’s missions.
The elements present in this diagram are functions, which can be hierarchically embedded.
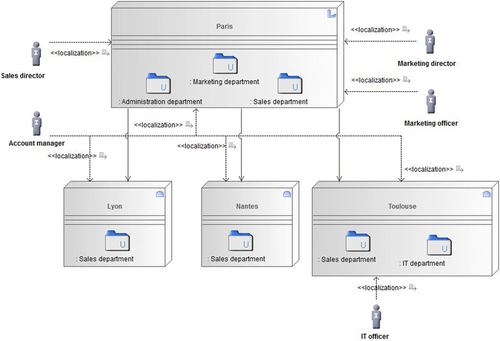
In Figure 8.8, functions are organized into layers. Enterprise management, which orients strategy, is found on the top level. Next come operational functions essentially linked to marketing and sales, and finally we have support functions, such as administration and IT.
Functional decomposition is represented here through the graphical embedding of functions. The “Marketing management” function is thus broken down into the “Offer management” function (and other functions), which itself is broken down into the “Portfolio definition” function (and other functions).
Business function
A business function takes care of carrying out one of the enterprise’s capacities. The enterprise is described through all its capacities and the services that deliver them. A business function is carried out continuously in order to guarantee one of the enterprise’s missions. Unlike a business process, a business function has no specific temporal nature—no identified start or finish, no precisely defined incoming or outgoing products, no trigger events, and so on.
Summarized representation of the enterprise’s capacities
Functions are graphically represented through a hierarchical structure. The aim of the functional decomposition diagram is thus to represent, on a single page, all the capacities of an organization that are relevant to the definition of an enterprise architecture. The functional decomposition diagram is not concerned with the “how” (in other words, with the way in which the enterprise carries out its functions). It thus provides a useful abstraction, focusing on what the enterprise must do and not on how it does it.
The construction of a functional decomposition diagram requires knowledge of the enterprise and its missions. Business functions can be demarcated by the business services participating in the function, as well as with the business processes.
Initial models indicating major directions for solutions, designed to help enterprise capacities evolve, can then be constructed to clarify the scope of enterprise architecture work and to orient decisions. For example, a plan for the progressive addition of new capacities can be defined.
The functional decomposition model can be enriched by adding specific links to orient future choices and decisions. For example, these links can indicate which application component supports which function, or which role participates in which function, and so on (see business footprint diagram in Figure 8.9).

8.4.2 The “Goal/Objective/Service diagram” artifact
Description of the artifact
| Name | Goal/Objective/Service diagram |
| Experts | Business experts |
| Designers | Business analysts |
| Recipients | Business analysts, application architects |
| Aim | To present the services that contribute to the realization of goals |
| Useful preliminary information | Functional decomposition of the enterprise, identified services, goals |
•  Goal
Goal
•  Allocation of a goal to a business service.
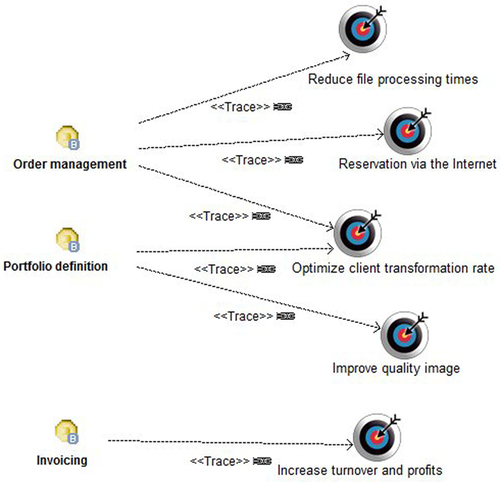
The aim of Goal/Objective/Service diagrams is to define the way in which a business service contributes to achieving a business vision or one of the enterprise’s strategies.
Services are associated with strategic or operational goals, as well as with associated measures, in order to enable enterprises to understand which services contribute to which aspects of business performance. The Goal/Objective/Service diagram also provides a strong indication of performance indicators for a given service.
“Assigned” links between services and goals are used to associate them. In the example shown in Figure 8.10, the “Order management” service is thus associated with the “Reduce file processing times,” “Reservation via the Internet,” and “Optimize client transformation rate” goals.
Business service
A business service is a service that the enterprise or one of its business units provides to its internal or external clients. Business services are linked to business functions, with clearly defined boundaries and explicit governance. For example, a “pay” function, which describes the ability of an enterprise to manage and pay its employees’ salaries, can be associated with more precise services, such as calculate pay, calculate bonuses, transfer salaries, or modify salary. Business services have a service interface and a service contract interface that determines their usage conditions. A business service will be associated with the incoming and outgoing business entities that it handles.
A business service can be carried out through manual or automated operations. It can also be subcontracted outside the enterprise.
8.5 Artifacts linked to business processes
8.5.1 Key business processes of the enterprise
Business architecture endeavors to identify the key business processes linked to the ADM cycle. It goes back to the process mapping initiated in phase A in order to complete it, notably by qualifying processes (see Section 12.2.2).
Based on business process maps, business managers and analysts can define priorities related to the processes that are to be revamped or optimized. They identify critical zones, consider processes impacted by new enterprise goals, and launch more detailed studies of certain processes, which involve additional business process analysis and modeling tasks.
Phase B updates and produces event diagrams (presented in Chapter 7 in phase A), which present an overview of processes by mapping them and by identifying contextual information (trigger events, participants, incoming and outgoing products) that will be used in process flow diagrams.
8.5.2 The “process flow diagram” artifact
Description of the artifact
| Name | Process flow diagram |
| Experts | Business experts, functional managers |
| Designers | Business process analysts |
| Recipients | Analysts, application architects, business managers, business experts |
| Aim | To detail how business processes work (evolution, optimization, automation, etc.) |
| Useful preliminary information | Actors, event diagrams, products, and business entities |
BPMN notation is very rich and only essential elements are presented here.
• ![]() Pool and lane: Determine who carries out the tasks they contain. Pools are autonomous and are not constrained by ordering sequence (such as here, the client and the organization).
Pool and lane: Determine who carries out the tasks they contain. Pools are autonomous and are not constrained by ordering sequence (such as here, the client and the organization).
• ![]() Activities carried out within a process. BPMN defines two types of activity: the task and the subprocess. A task is an atomic activity, while a subprocess is an activity that can be further broken down.
Activities carried out within a process. BPMN defines two types of activity: the task and the subprocess. A task is an atomic activity, while a subprocess is an activity that can be further broken down.
• ![]() Data object: Describes the data exchanged between different activities.
Data object: Describes the data exchanged between different activities.
• ![]() Event: Describes the occurrence of an event (for example, the arrival of a message or signal) sent or received by the process.
Event: Describes the occurrence of an event (for example, the arrival of a message or signal) sent or received by the process.
• ![]() Gate: Control structure used to define choices or synchronizations within the process. Where a cross appears in the diamond (as in Figure 8.11), this is a “parallel gateway” indicating that parallel branches are executed and synchronized.
Gate: Control structure used to define choices or synchronizations within the process. Where a cross appears in the diamond (as in Figure 8.11), this is a “parallel gateway” indicating that parallel branches are executed and synchronized.

• ![]() Messages and message flows: Elements sent and received between different pools.
Messages and message flows: Elements sent and received between different pools.
The example shown in Figure 8.11 presents two level-one BPMN pools representing client actions and actions carried out within the Discount Travel company (the organization). For each of these autonomous areas of responsibility, which should be considered as independent processes, different activities are represented (“Select trip,” “Initiate file,” etc.) and linked through sequencing links. The “Order” element, called “data object” in BPMN, represents a piece of TOGAF information handled by the process. Here, these are occurrences of business entities within a process.
In this example, the process we are interested in is the one described by the “Organization” pool (we do not control the ordering of client actions). The “lanes” (“Administration department,” “Sales department”) indicate who or what is responsible for different activities, even if the activities are automated by the information system.
Modeling the behavior of business processes
Process diagrams, called “flow diagrams” by TOGAF, are used to model the sequence of activities within a process. Process modeling formalizes practices and describes the manner in which they should take place.
Flow diagrams represent process participants, activity sequences, information exchanged during a process, and trigger events. Processes can also detail the different checks, choices, and coordinations that exist within a sequence of activities.
Processes can be modeled to different degrees of detail according to the goal of the model in question. In the example shown in Figure 8.11, the model is extremely general. Chapter 12 goes into more detail on the techniques used to model business processes.
8.5.3 The “business use case diagram” artifact
Business use cases and application use cases
TOGAF distinguishes business use cases (phase B) and system use cases (phase C). Business use cases present the relationships between the producers and consumers of business services. They provide additional depth when describing the enterprise’s capabilities by illustrating how and when they are implemented. They help clarify actors and roles with regard to processes and functions. They can be reused to define system use cases. System use cases describe the relationships between the consumers and providers of application services. Application services are consumed by actors or application components. System use cases help describe and clarify the requirements for the interactions between actors and their roles with applications.
Description of the artifact
| Name | Business use case diagram |
| Experts | Business process experts, functional managers |
| Designers | Business analysts, business process analysts |
| Recipients | Analysts, business process experts, application architects |
| Aim | To describe the different use cases of the main actors, with regard to the enterprise’s services |
| Useful preliminary information | Actors, business processes, functions |
• ![]() External actor
External actor
• ![]() Internal actor
Internal actor
• ![]() Communication link between an actor and a use case.
Communication link between an actor and a use case.
In the example shown in Figure 8.12, the use cases focus on three actors: the “Account manager,” the “Invoicing officer,” and the “Client.” Communication links link the actors to the use cases and detail who participates in which use cases.

Implementing business use case diagrams
A business use case diagram will detail the actions carried out by an actor or a role to complete a particular task. It will enable the interactions between the enterprise’s actors or with the enterprise’s business services to be described and validated.
Business use case diagrams are used in conjunction with business processes. For example, Figure 8.12 presents the use cases linked to the activities of the business process presented in Figure 8.11. The use cases focus on the main actors (for example, the “Account manager”) and their essential activities (“Initiate file,” “Reserve Trip,” etc.).
A use case represents a requirement for an interaction between actors and the rest of the enterprise (IS, business services), in the aim of meeting a fundamental need. Each of these use cases can then be detailed to describe the typical sequence of tasks that the main actor must carry out in order to accomplish the use case (scenario). This level of detail is rarely used during phase B.
The use case can be completed in order to provide information on application conditions and exceptional cases.
In practice, use cases will be used to provide more details on parts of process models or to summarize the essential attributions of certain actors or roles.
8.5.4 The “service/information diagram” artifact
| Name | Service/Information diagram |
| Experts | Business experts, business analysts |
| Designers | Business analysts |
| Recipients | Application architects |
| Aim | To describe the information necessary to business services. To prepare the data architecture and application architecture |
| Useful preliminary information | Business entities, business services, functions, and business processes |
The Service/Information diagram presents the information used to support one or several business services. This type of diagram defines which type of data is consumed or produced by a business service. It can also present the source of the information. It provides an initial representation of the information used within an architecture. In this way, it will provide a basis for detailing data architecture during phase C.
“Data flow” type links (flows) between business services and business entities represent which type of entity is used as input or produced as output by services.
• Business service
• Data flow between data (business entity, event, product) and active elements of the system (business process, service).
8.5.5 The “business footprint diagram” artifact
| Name | Business footprint diagram |
| Experts | Functional experts and business process experts, application architects |
| Designers | Business analysts |
| Recipients | General management, analysts, and application architects |
| Aim | To provide an overview that traces essential elements to be built or revised from goals through to components |
| Useful preliminary information | Goals, organization, business functions, processes, business services, initial application architecture elements |
• Goal
•  Process component
•  Entity component
• Function
• Organization unit
• Business process
• ![]() Determines that a function, service, or process is supported by finer-grain business elements.
Determines that a function, service, or process is supported by finer-grain business elements.
•  Determines that a participant participates in an enterprise activity or part of an enterprise activity.
• ![]() General traceability link: The origin of the traceability link has its foundation in the destination of the link.
General traceability link: The origin of the traceability link has its foundation in the destination of the link.
•  Realization by a component: Realizes an element identified at business level.
A business footprint diagram describes the links between business goals, organization units, business functions, and business services. These functions and services are also traced with technical components producing the required capabilities. By following these links, the business footprint diagram enables us to obtain traceability between a technical component and the business goals that it satisfies, while also revealing the owners and managers of the identified services.
A business footprint diagram is only interested in essential elements that show the connection between organization units and functions to produce services. It is used to communicate with the management of the enterprise.
Business footprint diagrams focus on the current concerns of the business. Depending on these concerns, they can concentrate on one or several application components requiring further development, as well as on one or several business functions. Thus, we select the goals that we judge to be the most important to the subject, and create or reuse application components, business functions, and business services that we trace to these goals. The diagram then defines what has to be worked on, enabling all participants to understand that a more detailed analysis for each architectural domain will develop these previously identified elements.
This type of diagram positions identified elements with regard to goals and traces them to each other using specialized dependencies.
8.6 Artifacts linked to data
8.6.1 The “conceptual data diagram” artifact
TOGAF considers data architecture to be a subphase of phase C. However, data architecture also contributes to phase B, notably where business entities are handled (Figure 8.13).

Three different views are presented here, showing specific levels of detail. At the highest level, we find the information domain diagram (Figure 8.14), which presents the structuring of entities into different domains. Next, Figure 8.15 presents the main business entities that appear in “undeveloped” form, in other words, without showing details on their attributes and properties. Finally, Figure 8.16 presents the most detailed view of entities, where these are developed and their attributes defined.

Description of the artifact
| Name | Conceptual data diagram |
| Experts | Business experts |
| Designers | Business analysts |
| Recipients | Business analysts, data architects, application architects |
| Aim | To identify and formalize business objects |
| Useful preliminary information | Existing data, dictionary, business process messages |
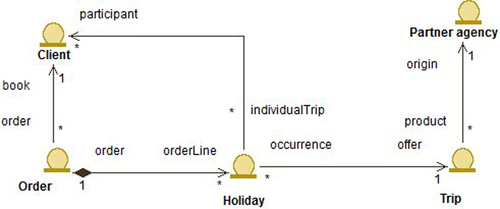
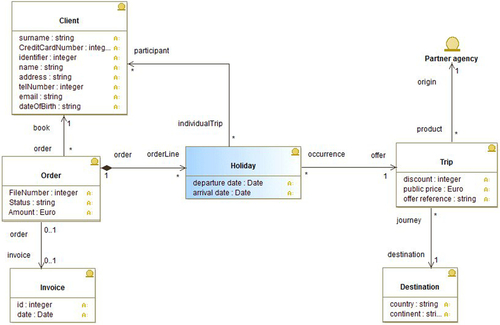
• Business entity (developed form)
• ![]() Association between classes
Association between classes
The model shown in Figure 8.15 shows the key concepts of client and trip. The separation between “Holiday” and “Trip” is clearly presented. A trip is defined at product range level. It includes its destination and the hotel providing the accommodation, and indicates who the partner agency is. A holiday is an instance of a trip for a set of participants. It includes information on the date, as well as information specific to the trip in question (room reserved, flight, insurance, etc.). This additional information is presented in more detail in Figure 8.16.
Modeling business concepts
Conceptual data diagrams represent essential business concepts together with their properties, and show their associations. Within business architecture, conceptual data diagrams represent entities at the conceptual level, without taking into account any technological location and realization issues. At this stage, we are not interested in whether or not entities are persistent, whether they are transferred via messages between services, or in any other application questions. The focus here is to define all the essential concepts that will enable the business to be described in the most general way possible in the enterprise’s application domain.
This business formalization work can be undertaken very early in the enterprise architecture cycle. As for all other models, the presence of a dictionary that establishes terminology will greatly facilitate this modeling: it helps make sure that relevant names are used and enables us to check the completeness of the concepts and properties used.
Defining this high-level conceptual model lets us define the essential concepts of the business without being distracted by organizational or historic considerations specific to the enterprise. This allows us to leave the business and to think about the best possible organization of the enterprise and the IS for the realization of the enterprise’s functions on its business according to the goals assigned.
For example, the Praxeme enterprise method1 encourages significant development of conceptual models through its concept of semantic models.
Further details brought to the model
The business data model will be used as a tool to identify and describe key entities. We see that Figure 8.16 develops certain classes in order to show the attached attributes.
The model can add useful semantic constraints and details as a complement to the class diagram. For example, we can see that the client has a “CreditCardNumber” property, which poses a set of questions. Is a client obliged to have a credit card? Does a client only ever have one credit card? Is the last credit card used the only one to be memorized? Would it not be more relevant to associate the credit card number with the order? Should we not rather create an entity linked to the means of payment, which details the different options available? Should we not retain a transaction number rather than a credit card number?
It quickly becomes apparent after this kind of critical review that knowledge of payment modes is not sufficient. This exercise shows that many business questions arise, necessitating detailed expertise.
However, as far as phase B is concerned, this level of detail is rarely used. Models that have identified the main concepts can be summarized as shown in Figures 8.15 or 8.16.
Using conceptual data diagrams
A pertinent conceptual data model is a legacy of knowledge upon which many enterprise architecture models can be based:
• Data models obviously derive from the conceptual data diagram.
• Service data diagrams will be based on this model.
• “Entity” application components2 will be derived from the most important key business entities of this model, as well as their access interfaces.
• Business processes can share the definition of their information flows or products exchanged with the business entities defined in conceptual data diagrams.
The use of a modeling tool based on a central repository provides great consistency to all diagrams, some of whose model elements are shared and others derived (Figure 8.17).
Structure in business information domains
Very often, the number of entities requires that they be structured into business information domains. A general view of domains is then presented, where each domain can present the local model of the entities that belong to it.
• ![]() Dependency link between information domains, summarizing the dependencies between the business entities of the different domains.
Dependency link between information domains, summarizing the dependencies between the business entities of the different domains.
8.6.2 The “product lifecycle diagram” artifact
| Name | Product lifecycle diagram |
| Experts | Business experts |
| Designers | Business analysts |
| Recipients | Business analysts, business process analysts |
| Aim | To define the possible states and essential transitions of business entities |
| Useful preliminary information | Class diagram, business entities |
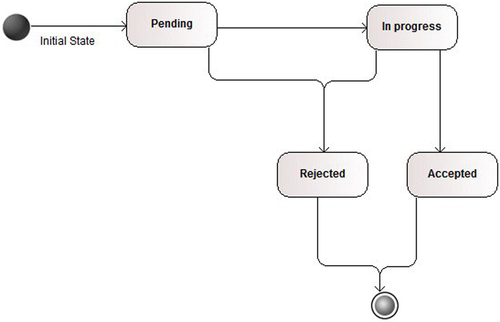
The product lifecycle diagram defines the main states of a given entity, and the possible transitions between these states. In this way, it presents the possible changes in state for an entity. This entity is considered as being an autonomous element that reacts to the operations and processing that can be applied to it, independently of the definition of the business processes and applications that can use it.
Each change in state is represented in the diagram. These can include events, conditions, or rules that provoke transitions between states. Product lifecycle diagrams then constrain the business process involving these entities, forcing them to respect defined transitions.
Several processes can act on identical entities: the definition of rules at entity level enables them to be shared at a higher level.
To identify states, we must imagine the different “stable” situations in which an entity can find itself, in other words, the situations where the entity does not undergo any transformation or processing. For example, a document can be in the following states: “created,” “under review,” “approved,” and so on. Next, the possible transitions between these states must be defined. For example, it is not possible to pass directly from the “created” state to the “approved” state, and the logical transition goes from “created” to “under review.” When an entity is not undergoing any processing, it is in a defined state.
Defining the business entity lifecycle ensures better formalization of entities and provides an indication of the stages that are essential to their management. This state model can be linked to the process model. Thus, the BPMN diagram can show that an entity is in a specific state at certain stages of the process.
• ![]() Transition: Describes the change in state from an original state to a destination state, following an operation being carried out on the entity, a particular condition being met, or an event occurring.
Transition: Describes the change in state from an original state to a destination state, following an operation being carried out on the entity, a particular condition being met, or an event occurring.
8.7 Fundamental concepts
The following fundamental concepts were introduced in this chapter:
• Business architecture: Defines the business strategy, governance, organization, and key business processes.
• Business function: Produces one of the enterprise’s capabilities. For example, “marketing,” “client contract management,” and “telemarketing” are functions.
• Business entity: Describes the semantics of business entities, independently of any organizational or IS-related considerations.
• Business dictionary: Specifies the business terminology in order to obtain a reference for the enterprise.
• Actor: Active enterprise participant (a person, system, or organization) who takes part in the activities of the enterprise.
• Role: One of an actor’s usual or expected functions.