
How do you determine if your product development is on track to satisfy its quality objectives? How do you ferret out the current and upcoming risks to your product’s quality? Will the product meet customers’ quality expectations? Development teams, project managers, and especially the quality professional(s) on the project team need to ask these questions routinely while their product is under development and timely actions can be applied.
In this chapter [1], we present a four-step process of in-process quality assessment: preparation, evaluation, summarization, and recommendations. A distinction between a quality assessment and a quality audit should be noted. A quality audit, as recognized in current industry literature (e.g., an ISO 9000 registration audit), compares actual practices to the defined process or standard. A quality assessment is concerned with what is occurring, what will be the likely results, and what needs to occur to correct discrepancies between the expected results and the desired results. A quality assessment is concerned with the quality status of the project rather than the state of process practices although there is likely correlation among the two. To achieve an effective quality assessment, the development process, the environment, and the project plan must be well understood.
A quality assessment can be conducted by an independent team or by the quality professionals who are part of the project team. In-process quality assessment should be an integral part of project management. It should be conducted several times during the development cycle for medium and large projects. Figure 15.1 shows a combination of a simplified software project schedule, a high-level view of a development process, and a set of project management checkpoint reviews. The project checkpoint reviews, denoted PR1 through PR4, are the top row in the figure. For software projects with a development cycle time of one year or longer, it is not unusual to have four or five project checkpoint reviews. For rapid development projects that involve multiple teams and have a development cycle time of six months or shorter, it is preferable to have two or three checkpoint reviews. For small-team projects, formal project checkpoint reviews may not be necessary because the normal project management activities would be adequate to evaluate the overall health of the project. Project checkpoint reviews cover all aspects of the project such as schedule, function, quality, cost, and the overall readiness of the plans to support the delivery of the product. A candid assessment of the in-process quality status of the project should be an integral part of these checkpoint reviews; the following discussions of quality assessment are based on this scenario.
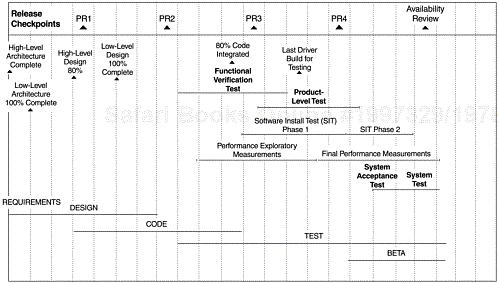
The first phase of a quality assessment is the preparation phase. One must first understand the development process and the key activities and milestones of the project schedule, then identify where the project is relative to the phase of that development process and the project schedule. Medium and large software projects normally have many components with varying schedules under the rubric of overall system schedules. The majority of them, however, should be in the same phase at a given time.
For projects with an iterative development process, the macro level of product development would contain phases such as analysis, design, code, test, and customer validation although at the micro level, selected components may still be going through the iterative cycles near the back end of the project schedule.
For each macro phase of the development process and project schedule, there is a set of data, both quantitative and qualitative, that gauges the development progress, helps to surface problems, and can provide a predictive indication of final product quality. Previous chapters contain many examples of phase-specific metrics and data. In general, fewer data and metrics are available in the early phases of the development cycle. Those very early indicators are also less representative of final product quality than those at the back end of the development cycle. For example, the frequency of system crashes and hangs during the system test phase indicates better how the product will perform in the field than the number of defects found during unit testing. This does not mean quality assessments at the early cycles of the project are less important. One needs to make sure that the project is on track at every major phase in order to achieve the desirable final outcome. For example, positive indicators from the requirements and design phases mean that the stability and predictability of the back end of the development process will be better.
Suppose we are conducting a quality assessment for Project Checkpoint Review 1 (PR1) in the project depicted by Figure 15.1. The data to be gathered and assessed would be related to requirements and design such as progress of design complete, coverage and effectiveness indicators of design reviews, and so on. If one is conducting an assessment for PR2, then indicators pertaining to the status of coding activities and code integration into the system library, and builds and releases of drivers for testing will be pertinent. It is important to plan ahead the indicators, metrics, and information you intend to rely on for your assessment at various checkpoints. If you have a metrics program in place and have been tracking the necessary data on an ongoing basis, conducting quality assessments will be much easier. However, if you are starting from scratch at this point, don’t despair. There are always data, information, and observations available that one can gather and analyze even when a metrics program is not in place. This is also a good time to start such a program and to demonstrate the value-added of the tracking system and the metrics.
The preceding discussion implies quantitative data. Qualitative data is equally important, and at times even more so. We gather much of our qualitative data through one-on-one interviews or small group discussions. Information gathered via formal meetings such as the presentations from functional development teams are useful but usually need in-depth follow-up. We first determine who we want to talk to, then we prepare a list of what questions we want to ask. To determine the “who,” think about the following:
Whose input is key at this stage?
Which people are the most knowledgeable about what’s happening at this stage?
Am I including people from a variety of areas (developers, testers, support groups) to give me a balanced view?
To develop the list of questions, use both specific and open-ended questions. Open-ended questions are often the most useful. Here are some examples:
Where are we?
What’s the outlook?
Where are the weak areas?
What are the risks?
Are there any mitigation plans? What are they?
How does this project compare to past projects in your assessment?
This last question helps to put the person’s comments into perspective. Asking people to compare the current release to a specific past release puts all qualitative data into a similar frame of reference. During the preparation phase, we determine which past release or releases would be best for such comparison. For organizations without historical data for comparison or analysis of metric levels and trends, quality assessment planning may not be easy. For quality indicators that are well practiced in the industry (e.g., defect removal efficiency), targets can be based on industry benchmarks and best practices (Jones, 2000).
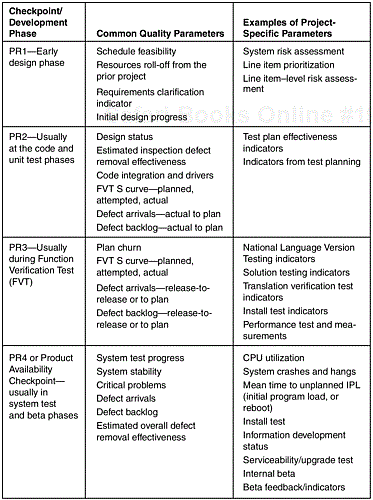
Figure 15.2 shows a list of quality indicators for quality assessment at various project checkpoints. The list includes both quantitative and qualitative indicators.
You figured out which data are important to look at and now you are ready to analyze and evaluate them. This is when one can apply all possible data analysis and statistical techniques to extract the messages within it.
For quantitative analysis tools such as control charts, trend charts, histograms, pareto diagrams, and scatter diagrams or statistical techniques ranging from simple tabulation analysis to sophisticated multivariate methods are all fair game. It is our experience that simple techniques can be very powerful and most of the time sophisticated statistical techniques are unnecessary. The key point is to garner useful information from the data. As discussed in previous chapters, we found that using the effort/outcome paradigm is particularly useful in assessing in-process metrics. Of course, the data gathered must include both effort indicators and outcome indicators in order to apply this approach, and this should be a consideration in the planning and preparation phase. At the least, from raw data to useful information, some meaningful comparisons with relevant baseline, plan, or a previous similar product need to take place.
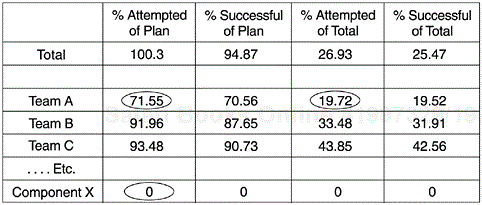
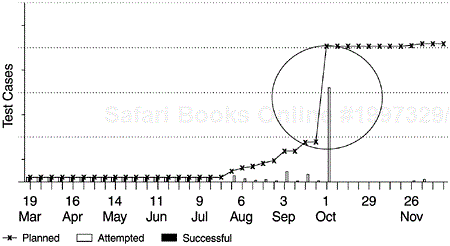
When analyzing the data, it is always good practice to pay particular attention to anything unusual. Good questions to ask in such situations are, “What more can I learn about this?” and “How can I put this into perspective?” Figures 15.3, 15.4, and 15.5 include examples of data that bear further investigation. In Figure 15.3, Team A was significantly behind plan in its functional test and Component X had not even started its testing. In Figure 15.4, the defect arrival pattern of the current project dif-fered from that for previous comparable projects. Was the higher defects volume in the early part of the defect curve due to more effective testing and better progress? Was the testing effectiveness and progress about the same as previous project at this point in the development cycle? In Figure 15.5, the test plan S-curve shows an unusual and potentially unachievable pattern.

For the qualitative evaluation, information from the interviews and open-ended probing can be classified, grouped, and correlated with existing knowledge and findings from quantitative analyses. The strongest proponents of quantitative methods argue that without metrics, an assessment is just another opinion. While quantitative data is important, our experience indicates that effective quality assessments are characteris-tically based on cross validation of findings and observations of both quantitative data and qualitative evaluation. Expert opinions also carry special weight. To that regard, the assessor should be equipped with acute observations to delineate whether the input he or she is getting is true expert opinion or opinion clouded by other factors. For example, opinions of the quality of the project may be optimistic by the development manager and pessimistic by the testing manager. It is not uncommon that at project checkpoint review meetings, the status of the project goes from excellent to poor, or vice versa, in just a few moments depending on the order of presentations by the development, support, testing, and service groups.
Evaluation of qualitative data is based on expert judgment and cross validation. For quantitative indicators, you may want to use predetermined criteria to ensure consistency. The following are sample criteria for evaluation of quantitative indicators:
Green = actual within (<=) 5% behind or better than plan (model or a comparable previous project)
Yellow = actual is between 5% and (<=) 15% behind plan (model or a comparable previous project)
Red = actual is greater than 15% behind plan (model or a comparable previous project)
For some indicators, specific considerations apply. For example, for testing defect arrivals, higher is better at earlier phases. After peaking, lower is better if testing effort is not compromised.
The following are sample criteria for a qualitative indicator (plan change):
Green = no or small amount of plan changes after the commitment checkpoint of the project. No additional risks involved.
Yellow = some amount of plan changes after the commitment checkpoint of the project, but not on critical line items of the project. Risks identified and assessed, and plans in place to mitigate and control risks.
Red = plan changes on critical line items that took place after the project commitment checkpoint put the project at high risk. Assumptions at the commitment checkpoint are no longer valid.
The following shows sample criteria for an indicator that may require both qualitative and quantitative evaluation (design status):
Green = no major design issues; design review status within (<=) 5% behind or ahead of plan.
Yellow = design issues identified and plans being put in place to resolve, or design review status between 5% and (<=) 15% behind plan.
Red = critical, project-gating design issues identified with no plans to resolve, or design reviews behind plan greater than 15%.
This is the time to pull it all together. A good beginning is to look for recurring themes in the qualitative and quantitative data. For example, if a test expert comments that the testers seem to be finding a lot of problems in a certain component, and that component shows up in a pareto analysis as well, this is a good indication of a problem area.
In summarizing the key issues and concerns, a quick analysis of the potential impacts of the identified problem areas can help rank the issues properly. For instance, the discovery of several low-severity problems in one area might not be a major concern, but a potential installation problem that customers will run into first thing when they install the product could be a very big deal. To put the information into perspective, one might compare a potential problem to a similar problem that occurred with a competitor’s product or a discovery in a past beta test. Furthermore, in summarizing data, don’t forget to identify what’s done right. This information can be every bit as useful as the problem areas. If an incremental improvement in one component’s code inspection process that resulted in nearly problem-free testing for that component during functional test, this could potentially provide a major breakthrough for the quality improvement effort of the entire team.
We found the format in Table 15.1 useful for summarizing and displaying the results. Each row shows a different quality parameter, listed in the first column. We often include key findings from the metrics or comments and information from interviews in the “observations” column. The final column shows an assessment for each parameter. At each interview, we ask for a “thumbs up” or “thumbs down” of the project compared with a previous similar project, and an overall assessment with regard to the project’s quality goals. However, it’s the assessor’s overall equalizing judgment that goes on the final assessment, as shown in the table.
Table 15.1 shows only a sample of the parameters and their assessment summary. The set of parameters for a quality assessment should include all pertinent attributes of the project’s quality objectives and development activities associated with those attributes. Some of the parameters may be phase-specific and others applicable for most of the development cycle. (See Figure 15.2 for a list of parameters.)
In each assessment we provide an overall assessment as the “bottom line.” The overall assessment should be developed with regard to the quality, function, and schedule objectives. In other words, “What is the likelihood that the product will meet quality objectives with the current content and schedule?” The overall assessment should be an integrated element in the project risk management process.
Table 15.1. Example Format for Summarizing Data
|
Indicator |
Observations |
Assessment |
|---|---|---|
|
Design reviews |
100% complete, earlier than comparison project relative to months to product ship date |
Green |
|
Code inspections |
95% complete; tracking close to plan |
Green |
|
Function integration (to system library) |
92% of function integrated by Driver Y; code integration and driver build (used for formal testing) executing to plan |
Green |
|
Function verification test |
Test progress tracking close to a comparison project, but is 6% behind plan; concern with a critical item (EY) being late; risk mitigation plans in place |
Yellow |
|
Test defect arrivals |
Tracking close to a comparison project; concern with delayed defect arrivals because of the late start of testing of item EY |
Yellow |
|
Test defect backlog |
Good early focus; expect level to grow as arrivals peak, but currently below plan |
Yellow |
|
Install testing |
98% of planned test cases attempted, and 95% successful; 60% into test cycle |
Green |
|
Late change |
Late changes for tuning and scaling and for preventing performance degradation; plans to mitigate the impact of system stability not yet in place |
Red |
|
System test |
Concern with availability of a key hardware product for the test environment to fully function |
NA (too early ) |
It is important to develop criteria for each level of the scale that you can clearly communicate along with your final assessment. It is useful to develop criteria that can be used over time and across multiple assessments. The following is an example of an overall quality assessment scale.
Red = high probability of not meeting product quality goals or customer quality expectations
Yellow = moderate risk of not meeting product quality goals or customer quality expectations
Green = likely to meet product quality goals and satisfy customer quality expectations
Figure 15.6 displays potential quality assessment ratings over the project checkpoint reviews for two scenarios. Apparently the scenario of steadily declining assessment rating (from red to green) is more favorable. This trend might occur when a company is developing a cutting-edge product. In any project, the risks and unknowns could be very high early on, resulting in an overall assessment of “Red.” Ideally, as the project progresses, the risks are addressed and problems resolved, thus improving the product’s potential for meeting quality objectives.
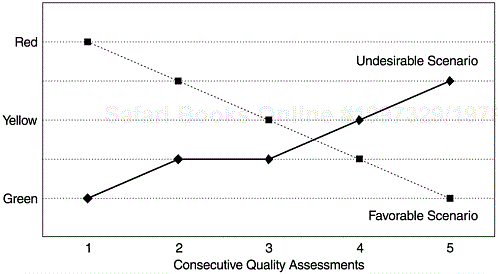
The second scenario is undesirable not only because the final rating is poor, but also because the ratings worsen over time and initial ratings suggest low risk. While it is entirely possible for a project risk to increase (loss of key personnel would be one example), one should examine early positive ratings closely. It can be difficult to identify risks early in a project, but failure to do so can result in false positive ratings. In the early phases of a project, there are few concrete indicators, much less quantitative metrics, and it is human to assume no news is good news. The challenge to the quality professionals who conduct quality assessments is to make use of all fuzzy information and murky indicators to come up with a candid assessment.
Recommendations are really part of the assessment summary, not a separate phase in the assessment process, but they are so important we put them in a separate section. Developing recommendations is probably the most challenging part of the assessment, but it can also be the most beneficial part for the project.
There is no magic formula for developing recommendations. Just as the problems you identify will probably be unique for every assessment you do, so will the solutions and recommendations. However, reviewing good project management and risk mitigation techniques is useful for developing recommendations. A good understanding of the findings of software assessments and best practices in the industry will be helpful (for example, see Jones, 2000). Can dependency management help to resolve the potential for late test completion that you identified? Is more detailed planning required to successfully implement a new beta program? Can resources be shared across component teams of the project? If you are the project manager assessing the quality status of your project, this is the time to put your project manager hat back on. If you are the quality expert on the project team who is responsible for quality assessments, at this phase you need to think like a project manager.
Identification of risks and risk management is an important aspect of any assessment. It is akin to making a recommendation on a project checkpoint and is useful in determining the impact, consequences, or probable outcome of findings. Risk mitigation techniques include containing, reducing, or eliminating the risk. Table 15.2 shows risk management strategies as defined by the Project Management Institute, along with several examples. Brainstorming ideas for each type of strategy can help you to surface a viable solution to a risk or problem.
Table 15.2. Risk Mitigation Strategies
|
Strategy |
Definition |
Example |
|---|---|---|
|
Contain |
Minimize the occurrence of effect of the risk. |
Establish and enforce a checklist for code integration (into the system library) to minimize problems during the driver build process. |
|
Contingency |
Create an action plan in case the risk occurs. |
Develop an incentive program for additional defect removal at “development complete” that involves testers, developers, and service specialists who have good customer perspectives in the event that defect arrival during the system test phase is higher than desirable (an indication of more latent defects in the product). |
|
Transfer |
Transfer all or part of the risk to another party. | |
|
Ignore/accept |
Accept the consequences if the risk occurs. | |
|
Avoid |
Avoid the risk as in
|
Identify functions that can be removed if schedule pressures occur. |
In-process quality assessments help you understand if your project is on target to meet its quality objectives. Good assessments require good planning, analysis, evaluation, summarization, and recommendations. Quality assessments should be integrated in the project risk management process. This chapter discusses a four-step process of in-process quality assessment. Here are a few final thoughts regarding quality assessments.
Be sure to retain a copy of quality assessments for your records. A thorough quality assessment package provides data that can be useful references in future assessments. It can also help to provide a frame of reference, particularly for determining overall assessment ratings. For future quality assessments of the same project (i.e., assessments at later checkpoints), it is a good idea to review prior assessments to identify if past problems were addressed and what actions were effective.
It is good practice to record lessons learned for future assessments to avoid repeating unsatisfactory actions and to streamline the process. Right after you complete an assessment is a good time to make plans to start tracking for future products, the data that you wish you would have had for this assessment. It is also a good time to consider what data you’ll need for future assessments of the current project. When a project is launched, the first document to be reviewed should be the list of lessons learned from previous projects.
Finally, the quality of a quality assessment depends on three factors: the assessment method and process; the information, integrity and quality of the data used for the assessment; and the assessor. We have discussed a simple process that is based on our experience with numerous assessments and which we believe is robust. We emphasize the importance of making use of all pertinent indicators, quantitative and qualitative, with cross-validation. The quality and integrity of the data can never be overstated. The assessor can be experienced or inexperienced. Regardless of the assessor’s experience, the worst assessment is perhaps one that is done mechanically via some kind of checklist approach without adequate support of actual data, specific information, and in-depth probing and analysis. It is the assessor’s responsibility to make sure that the undertaking of a Quality Assessment is entirely different from the practice of “passive checking of conformance to rules” (Gunter, 1998). Once findings are determined, recommendations should be made and risks assessed and managed.
[1] This chapter is a revision of the paper “A Quality Assessment Process for Products Under Development” by Diane Manlove and Stephen H. Kan, which was presented at the Ninth International Conference on Practical Software Quality Techniques (PSQT 2001 North), St. Paul, Minnesota, October 9–10, 2001.