
As easy as it is to view data captured by Sysdig using the command line and manually filtering the results, it can get more complicated as you start to string more and more commands together. To help make the data captured by Sysdig as accessible as possible, Sysdig ships with a GUI called Csysdig.
Launching the Csysdig is done with a single command:
sudo csysdig
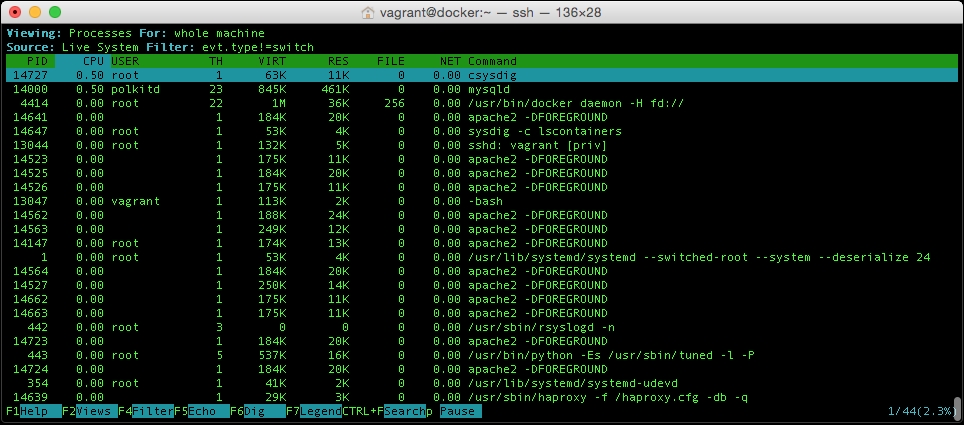
Once the process has launched, it should instantly look familiar to anyone who has used top or cAdvisor (minus the graphs); its default view will show you real-time information on the processes that are running:
To change this view, known as the Processes view, press F2 to open the Views menu; from here, you can use the up and down arrows on your keyboard to select a view. As you may have already guessed, we would like to see the Containers view:

However, before we drill down into our containers, let's quit Csysdig by pressing q and load up the file we created in the previous section. To do this, type the following command:
sudo csysdig -r ~/monitoring-docker.scap
Once Csysdig loads, you will notice that Source has changed from Live System to the file path of our data file. From here, press F2 and use the up arrow to select containers and then hit Enter. From here, you can use the up and down arrows to select one of the two web servers, these would be either wordpress_wordpress1_1 or wordpress_wordpress2_1 as shown in the following screen:

Once you have selected a server, hit Enter and you will be presented with a list of processes that the container was running. Again, you can use the arrow keys to select a process to drill down further into.
I suggested looking at one of the Apache processes that has a value listed in the File column. This time, rather than pressing Enter to select the process, let's "Echo" what the process was up to at the time we captured the data; with the process selected, press F5.
You can use the up and down arrows to scroll through the output:

To better format the data, press F2 and select Printable ASCII. As you can see from the preceding screenshot, this Apache process performed the following tasks:
- Accepted an incoming connection
- Accessed the
.htaccessfile - Read the
mod_rewriterules - Got information from the hosts file
- Made a connection to the MySQL container
- Sent the MySQL password
By scrolling through the remainder of the data in the "Echo" results for the process, you should be able to easily follow the interactions with the database all the way through to the page being sent to the browser.
To leave the "Echo" screen, press Backspace; this will always take you a level back.
If you want a more detailed breakdown on what the process was doing, then press F6 to enter the Dig view; this will list the files that the process was accessing at the time, along with the network interaction and how it is accessing the RAM.
To view a full list of commands and for more help, you can press F1 at anytime. Also, to get a breakdown on any columns that are on screen, press F7.


