
CHAPTER 4: WORK, THE AGILE WAY
|
‘Opportunity is missed by most people because it is dressed in overalls and looks like work.’ Thomas Edison, ∼1900 |
Aim of this chapter: To provide business managers with the tools and techniques needed to optimise workflow, exploit change, and manage Customer Requirements in an adaptable and flexible way. Based on proven Agile and lean processes, and aligned to the Agile philosophy, these techniques cover the full work-cycle, through planning, design, development, quality control, to completion.
At this point, after examining the role of the Customer and Team, it’s time to get to work. Work, the Agile way, is defined as the sum of Requirements made by a single Customer to a Team, or related group of Teams, and delivered in an Incremental, or Continuous, manner. Depending on the context, and Customer’s Requirements, there could be anywhere between an hour, to a decade’s work.
|
Work: The sum of Requirements made by a single Customer to a Team, or related group of Teams, and delivered in an Incremental, or Continuous, manner. |
Prior to work commencing, and as described in section Requirements and the Requirements Backlog, your Customer creates the initial vision (or business case), and ordered Requirements Backlog (a regularly updated list of Customer Requirements). This vision provides the context of the end goal, and the Backlog helps your Teams to understand what they will be delivering, in the short to medium term. Teams analyse, plan, and design their work, based on this Backlog, and, unlike traditional methods, the full Team should undertake initial analysis. As the Requirements Backlog changes regularly, to reduce wasted effort the Teams keep high-level analysis and planning to a minimum, and this should never take more than 1% of the total estimated duration (e.g. 2.5 days effort for 12 months work).
|
Remember Agile value #2: We value [completed Customer Requirements] over comprehensive documentation. |
Work is traditionally undertaken in one of two ways; business-as-usual and project based. Business-as-usual work is ongoing, continuous, and generally low risk. Whereas project-based work is temporary, with clear start and end dates, defined benefits (though benefits under Agile frameworks are not always defined), and generally utilising formal project management frameworks, such as PRINCE2®, PMBoK or Scrum.
Agile Business Management changes this, by providing two sets of processes for undertaking work, based on size and complexity; these are Continuous Delivery and Incremental Delivery. Continuous Delivery is best for small, discrete, self-contained, and generally repetitive Requirements. You should be able to deliver the majority of these in a few hours, to a few days of effort, in the order defined in the Requirements Backlog. Many traditional business-as-usual responsibilities fall under Continuous Delivery; however, you can deliver some traditional projects in this manner. Figure 14 shows a simple, continuous flowchart; where the delivery cycle takes new Customer Requirements from the Backlog, then releases the Completed Requirement to the Customer, before proceeding to the next.
|
Help desk support is generally Continuous in nature. Issues are raised as identified, and the related work can usually be resolved very quickly. |

|
Remember Agile principle #3: Deliver working software [completed Requirements] frequently, from a couple of weeks, to a couple of months, with a preference to the shorter timescale. |
Incremental Delivery is required when delivering complex groups of Requirements that require a large investment in time to complete, usually a few weeks to a few months.
Assigning Requirements into identically sized and managed Iterations for delivery, ensures that you can meet your Customer’s needs regularly and accurately. Each Iteration is between one-four weeks, at the end of which the Team delivers a functional, self-contained, tested, and usable, though incomplete, outcome.
The product itself will continue to evolve, as each Iteration builds upon the last. The product is only ‘complete’ at the end of the last Iteration. The majority of traditional project-based work should be delivered Incrementally, however, many complex business-as-usual functions could also be delivered in this way. Figure 15 shows a simple, incremental flowchart; where the delivery cycle takes a group of Customer Requirements, which forms the Iteration Backlog, then, after a predetermined time, releases the Completed Requirements in this group, before proceeding to the next group.
|
Financial Management is generally Incremental in nature. Requirements, such as preparing budgets or annual reports, are identified early, take several weeks to complete, and can be delivered in smaller Iterations. |
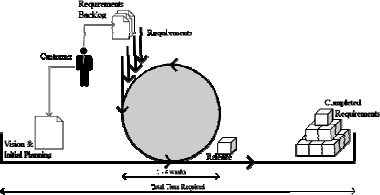
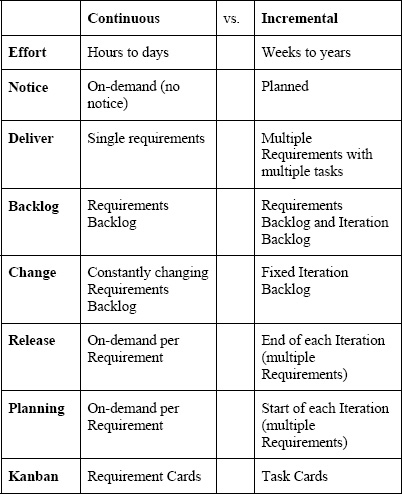
Table 3: When to use Continuous or Incremental Delivery
Benefits of the Agile Business Management work model include:
• Repeatable and generic estimation techniques that aid in workload management and Iteration Planning.
• By comparing estimates against actuals, you can build a known rate of delivery (Velocity) which improves forward planning.
• Reduced overtime through easily measurable and estimatable work, with accurate work planning. Do not mistake this for the ability to do more in the same time.
• Higher quality outcomes through embedded quality control processes.
• Simplification of overall work, by focusing on immediate, short-term Requirements.
• Greater Customer satisfaction through early, regular and targeted delivery.
To control and visualise the flow of Tasks, both delivery mechanisms use a pipeline Agile technique called Kanban, covered in section Kanbans.
The overhead of managing all these Requirements and Tasks can be quite daunting. However, there are multitudes of workload management systems available to help track and manage them. A good, workload management system will also become the de-facto knowledge base, containing all information regarding each Requirement and its delivery. This can help in the development, or resolution, of similar requests.
|
• Link the workload management system with HR and ERP systems to bill Customers and/or pay contractors. • If kept up to date, the workload management system can then be used as a reporting tool, to assess progress. • Provide direct access to Customers, so they can communicate directly with the Team, and take part in quality control processes. |
Tools are important to simplify the process, but are just a means to an end. Remember, back in the Introduction, the first point of the Agile Manifesto was ‘We value individuals and interactions over processes and tools’. A tool is effective only if the investment in using the tool, such as staff time, is less than the cost of not using the tool, or using a simpler tool. As a rule, your Team Members should spend no more than 10 minutes a day using any workflow management system.
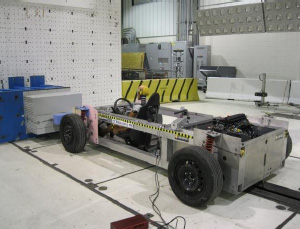
Case study: WIKISPEED – Applying Agile software principles and practices for fast automotive development!1 WIKISPEED: The WIKISPEED SGT01 car was an entrant in the Progressive Insurance Automotive X Prize contest, to produce a full-sized, road-legal car, getting 100+ mi/gal (2.25L/100 km). Agile methods were introduced, to give product cycle times measured in weeks, not years. This case study describes how a distributed, collaborative team of volunteers, spread around the world, is creating, on a shoestring budget, a model for how to design and manufacture a highly efficient automobile. WIKISPEED is doing this by borrowing, and evolving, concepts from a variety of sources, such as Agile and lean software development, and continuing to evolve them in order to fit the context of automobile research, design and production. In particular, WIKISPEED is adapting aspects of Agile software development principles and practices to the research, design and production of physical products. The solution Borrowing processes from Extreme Programming and Scrum, WIKISPEED has created a research, design and production cycle, in which changes can be made to any part of the automobile, every week. These Agile principles and practices have resulted in several innovations, including: • A highly modular automobile. • A lightweight (68kg) aluminium load bearing chassis, with high crash protection. • A low-cost process to create the car’s composite aeroshell, without metal stamping, moulds or autoclaves. • A fuel-efficient engine control unit we call WIKISPEEDlet. The implementation Good Agile design demands modules that are loosely coupled, and can be tested apart from the entire system. These principles have led to a modular automotive design. On the WIKISPEED car, major sub-assemblies, such as suspension, motor, and body, can be replaced in the time it takes to change a flat tyre. The wheels and suspension bolt to the chassis, and can be repositioned or replaced. The composite body bolts to the chassis (Figure 16), and allows exchange of external shells. The same car can be a race car today, and a pick-up truck tomorrow. This modularity supports many of our design and process principles. It allows for rapid Iterations and experimentations during development and testing. Loosely coupled components, with simple and well-defined interfaces, minimise system interdependencies, enabling more rapid and reliable software and hardware development. Modularity allows unit tests of individual systems, and supports concurrent engineering and experimentation. It leads to more innovation, which contributes to low design costs, low manufacturing cost, more long-term evolution, and more consumer post-sale options. The challenges To minimise weight, we wanted to use a structural carbon fibre body; however, the lowest bid of $36,000 over three months (with waived labour costs) was beyond our budget, especially when factoring in changes during each Iteration. To overcome this, Robert Mohrbacher (one of our team members) pioneered a composites process that takes considerably less time and money to go from a CAD drawing to a full, structural carbon fibre body. This process now only requires $800 for materials, and only takes three days; these significant savings in capital and time allow us to more quickly experiment and adapt. The outcomes Based upon over two years of WIKISPEED experience, we summarise what has been important to date, and what might be applicable to other projects. The following were critical to the WIKISPEED project: • (Joe Justice’s) persistently enthusiastic leadership. • Borrowing, and evolving, principles and practices from Agile software development, Extreme Programming, lean manufacturing, etc. • Having access to little capital. The term ‘Extreme Programming’ was coined because the authors of that process combined 13 good practices, to reap a synergistic result. The set of practices described in this paper may be the beginning of a similar set that could be called ‘Extreme Manufacturing’. WIKISPEED is pioneering a qualitatively different approach to the research, design and production of automobiles. It has long been known that the Waterfall Method does not work well with software, where requirements are unknowable and subject to rapid change. Lean product design and manufacturing both take a much more iterative approach to this work for physical products. WIKISPEED is trying to push this even further, largely by applying software design principles and practices to automotive engineering. Our experience indicates that this can dramatically speed up the automotive development time, reduce the need for expensive tooling, and potentially lead to a qualitatively different business model. - David Socha, University of Washington Bothell - Tyler C Folsom, QUEST Integrated Inc. - Joe Justice, Team WIKISPEED |

Phases of delivery
|
‘Sometimes you just have to jump out the window and grow wings on the way down.’ Ray Bradbury, 1995 |
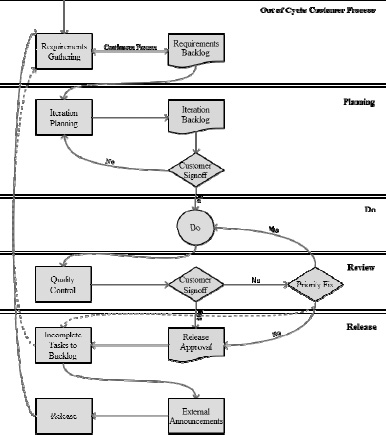
Both Continuous and Incremental Delivery have four key phases: Planning, Do, Review and Release. Continuous Delivery will cycle through these phases for each Requirement, whereas Incremental Delivery will cycle through these for each Iteration.
|
Planning: The process of determining the target scope of delivery and (if appropriate) defining the Iteration Backlog. |
|
Do: The process of actively working on the Requirements. |
|
Review: The (formal or informal) process of verifying that the completed Requirement meets the Customer’s expectations, and accepting them for Release. |
|
Release: The process of delivering completed Requirements to the Customer. |
Your business process model for the four phases may look a little like Figure 18.
Planning phase
Contrary to common opinion, it is important to have a good understanding of the expected outcomes, before starting work on any Agile Requirement. This is the goal of the Planning phase, and provides a forum for your Customer and Teams to discuss the needed Requirements. This step in the process focuses on determining the target scope of delivery, and, for Incremental Delivery, defines the Iteration Backlog. The Customer, or Customer Representative, is responsible for ensuring the Requirements Backlog is up to date, in preparation for the Planning phase. This includes clarification and reordering of the Customer Requirements, with consideration of any inherited, or incomplete, Requirements.
For Incremental Delivery, the Planning phase should take no longer than two hours per week. This can be adjusted pro-rata for longer Iterations, e.g. four hours for two weeks, and eight hours for four weeks. At the end of the Planning phase, the Team should have an estimated, ordered, and detailed Iteration Backlog, based on the Customers’ Requirements.
|
Remember Agile principle #9: Continuous attention to technical [and non-technical] excellence and good design enhances agility. |
There are two stages to the Planning phase, business and technical specifications. The business specification of the Planning phase aims to, with your Customer, select the highest priority Requirements from the Requirements Backlog, and turn them into a realistic goal. This also provides your Customer with the opportunity to communicate the required scope of delivery, provide the business context and priority, and address any questions the Team may have, to assist with performing the solution decomposition and estimation steps.
Distribute a copy of the Requirements Backlog prior to the Planning phase, to provide the Team with time to consider solution options for discussion during the workshop, and prepare clarification questions for the Customer. |
The second part of the Planning phase is technical, and, though they do not need to be physically present, the Customer must be available to the Teams, to discuss issues and answer questions. This is the solution design and estimating step in the Planning process, and aims to determine how to deliver each Requirement, by breaking it into its composite Tasks. The Team is also responsible for estimating the effort for all the Tasks in the Requirements, and (optionally) writing the Quality Control Test-Cases. This process of solution decomposition may reveal additional, or more complex, Tasks, that were not apparent during the high-level Planning. In this situation, the Customer must be available to review and approve if the agreed scope of the Iteration needs to change.
Each Task should take no longer than four-eight hours of effort to complete, and there will usually be multiple Tasks per Requirement.
Figure 19 describes the general flow of activity in this step.

As a guideline, large Tasks should be broken into Tasks preferably no longer than one day, and Tasks that involve waiting, split into separate Tasks (pre-wait and post-wait). This enables accurate tracking, and the calculation of Velocity (see section: Measuring progress). For complex Requirements, or those with a high number of interdependencies, it may be necessary to split the Task decomposition and estimating activities into two, and allow your Team Members an opportunity to consult with external parties on feasibility, and obtain input into the estimating process.
|
Always remember that only the Team can create Tasks, but only the Customer can create Requirements. |
Task elements |
Description |
Requirement |
The parent Requirement of the Task. |
Task summary |
One sentence that briefly describes, and identifies, the Task. |
Owner |
The person who selects the Task, and is accountable for delivering it. The owner may change at any point in the Iteration, especially as it changes state (e.g. from Active to Testing). However, one person can only own the Task at a time (unless using Pair Work, in which case a ‘pair’ will own it). |
Estimate |
The estimate in hours is the amount of effort the Team agrees is required to complete the specified Task. The estimate includes Planning, Do, Review, Release, and additional documentation. |
|
• Prepare beforehand. • Planning is a creative, problem-solving process. Encourage brainstorming. • Ensure the Planning room has plenty of paper, a whiteboard, and a computer with Internet access. |
Do phase
The activities within the Do phase are Team specific. In general, the Team works through each Task in a Requirement, with the aim of delivering all the completed Requirements at the end of the Iteration.
Review phase
At the stage when the Team is expected to Release to the Customer (e.g. once an Iteration is nearly Complete), the Requirements selected by the Customer and Team are either ‘Done’ or ‘Not Done’. ‘Done’ Requirements are those where all the prerequisite Tasks associated with it are also ‘Done’. Incomplete or ‘Not Done’ Tasks are reviewed in the context of the Requirements that they belong to, and if it affects whether the Requirement can be considered Done. If the Requirement can still be delivered, any remaining ‘Not Done’ Tasks may be rolled into a new Requirement for the next Iteration, or discarded if no longer required, in which case the current Requirement is considered Done.
Following Agile principles, your Customer is responsible for the Review phase, and will examine, test, and, if satisfied, accept a Requirement is Done. This can either be a formal review and User Acceptance Testing process or, an informal review and sign off. Either way, the Customer needs to engage with the Team, by providing ongoing feedback, and regularly updating the Requirements Backlog.
|
Sign off: The formal approval that a Requirement has been completed to the Customer’s satisfaction. |
In order to properly manage expectations, and ensure acceptance of the Requirement, it is critical that management, Customers, and the Teams, all have the same definition of ‘Done’. Components of a Requirement may include analysis, documentation, and/or quality control, so to be ‘Done’, the Team must complete these secondary Tasks. If, at the end of an Iteration, a Task or Requirement is functionally complete but not ‘Done’, your Customer must be made aware, and the outstanding work returned to the Requirements Backlog for reordering. As a rule, your Customer should not expect to review Requirements that are ‘Not Done’.
|
Remember Agile principle #10: Simplicity, the art of maximising the amount of work not done, is essential. |
Release phase
The Release phase is where the completed Requirements are delivered to your Customer, and depends on the context; large, complex or single Customer Requirements tend to use Incremental Delivery, and Release once at the end of the Iteration, whereas multi-Customer or standalone Requirements tend to Release as each Requirement is Done. Organisations that have a central Release process, outside the Teams control, can Release in larger blocks (e.g. quarterly). However, it is important that the Customer has access to the completed Requirements for review as early as possible, regardless of how late the Release will be.
Finally, your Teams can still Release Requirements that meet the Definition of Done, but have outstanding minor defects or features. These outstanding defects or Tasks accrue in the Requirements Backlog as ‘Technical Debt’; which, while not Customer Requirements, still need to be ordered and planned like any other Requirement. Your Teams should address Technical Debt on a regular basis, to ensure manageable, and high-quality, outcomes. The Customer also needs to be aware of the impact on their Requirements, if the Team is never given the opportunity to address the Technical Debt. I recommend that you allocate a fixed percentage of your Team’s time, negotiated with the Team and Customer, to address Technical Debt.
Kanbans
|
‘Simplicity, carried to the extreme, becomes elegance.’ Jon Franklin, 1994 |
Agile processes are designed to promote a sustainable workload, where your Teams, management, and Customers, are able to maintain a constant pace indefinitely. Teams have the authority to design, plan, and estimate, each Iteration, as well as the responsibility and accountability for delivery. This level of ownership for work, combined with integrated Customer engagement, significantly improves workload management, which in turn reduces overtime and stress. However, for this to be efficient, there needs to be a simple mechanism to manage, and level out, workflow within each Team. This is where Kanban comes in. The Kanban development method, as formulated by David Anderson2, is a Just-In-Time scheduling and workflow framework, to track Requirements and Tasks through their lifecycle.
A Kanban Board is a useful visualisation and control mechanism for both Continuous and Incremental Delivery. Starting at the Backlog, and finishing at Done, each Team will define the intervening states and workflows that make up the lifecycle of their Tasks (the Kanban), which can be as simple, or complex, as required. Teams working on several different types of Tasks may have multiple Kanban Boards, visualising the different states and workflows for each type. When there is available capacity in a state, it will ‘pull’ any ‘Ready’ Tasks from the preceding state, thus moving Tasks through the workflow.
|
Kanban Board: A tool to visualise and control the workflow of Tasks and Requirements. |
Each Team should go through different iterations of their Kanban Board, as their workflow and work processes improve and evolve. It is not unusual for a productive Team, one that has embraced continuous process improvement, to go through several Kanban Board designs a year. A Team that does not change their Kanban Board, is probably only using it to track work, not as a method for improvement.
The visualisation component, or Cards, of a Kanban, helps identify the state of each Task, when a Task is Ready, where there is spare capacity, and if there are any bottlenecks or impediments.
Tasks or Requirements that have identified defects, need rework, or have upstream or downstream dependencies external to the Team that are preventing progress, are marked as ‘blocked’, but do not change state. By leaving the Task in the current state, the Team can see where the blockage is, and identify where the process should resume once it is resolved. Similarly, by making all blocked Tasks and Requirements visible on the Kanban Board, Customers and management are aware of the issues, and this simplifies any escalation and resolution processes.
Blocked (Kanban): Tasks that have upstream or downstream dependencies external to the Team that are preventing progress. |
|
|
The definition of ‘Ready’ is context specific, and you need to define it explicitly for each state. |
The simplest workflow has four states:
1 Backlog: Tasks or Requirements that are Ready for work to start. Based on the logical sequencing of Tasks and agreed order, the Team Members select the next Task to work on, and promote this Card to the Active state.
2 Active: Tasks or Requirements that are actively being worked on, as defined by the Task or Requirement description. Once the Team Member has completed and shared the Task or Requirement, they promote this Card to the Testing Ready state.
3 Testing: Tasks or Requirements that are functionally complete, and undergoing formal validation in order to verify successful completion. Once all Quality Control Tests are Complete, the Task or Requirement is considered Done.
4 Done: Tasks or Requirements that are Complete. Different Teams, projects and organisations may have different definitions of Done.
The Assignee for a Task usually changes at each of these steps, though not always. It is important to understand that each column on the Kanban Board represents a state within the development workflow, not a handoff between Team Members. Team Members will proactively interact with their colleagues, and any internal parties, as required, to progress the assigned Task to completion, including any quality control and review.
|
It is easier to select ordered tasks with a due date. |
For both Continuous and Incremental Delivery, the Backlog column is the full Requirements Backlog, and as such, is permanent, but continuously changing as the Team completes Requirements, and the Customer modifies the Backlog. However, for Incremental Delivery, the second state of the Kanban Board, after the Backlog column, is a visualisation of the Iteration Backlog (sometimes known as the input queue), and as such, each new Iteration should clear and replenish it.
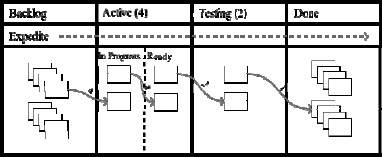
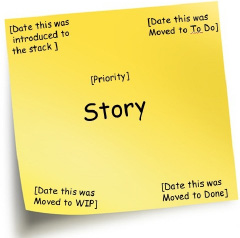
Each Task and state should be visible to your Teams, Customer, and Customer Representative; commonly achieved through a physical Kanban Board, or integrated virtual dashboard. Each Kanban Card describes a single Task or Requirement, as well as its estimate, and who is currently working on it. Keep cards simple, with additional information stored elsewhere (usually the workload management system). Divide the Kanban Board into multiple, labelled columns, each representing a single state. Then further divide each column in half, the first half being ‘In Progress’ and the second half being ‘Ready’.
|
Ready (Kanban): A sub-state within Kanban, for Tasks that are waiting to move to the next state. |
|
In Progress (Kanban): A sub-state within Kanban, for Tasks that are currently being worked on by any member of the Team. |
Some versions of Kanban also provide a single ‘Expedite’ track, at the top of the board, for urgent Requirements and Tasks. There can only ever be one Card at a time in this track, and it has the highest priority, above all other Cards. If possible, Team Members should finish their current Cards before moving onto the Expedited Card. Figure 20 shows a simple version of this flow.
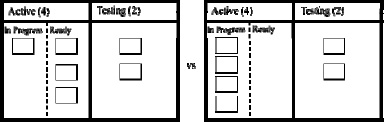
Except for the Backlog and Done states, the number of Cards allowed at any single time, in each state, is restricted. Called the Work In Progress (WIP) Limit, it includes both the ‘In Progress’ and ‘Ready’ Cards in any state, and matches the Team’s work capacity. In general, smaller WIP Limits reduce lead times, help uncover problems in the workflow, and drive continuous improvement (Kaizen), whilst higher WIP Limits help to absorb variation and exploit opportunities. Teams using Pair Work will have lower WIP Limits, as there is less simultaneous work in progress. By experimenting with various WIP Limits, you can identify, and resolve, process bottlenecks, adjust the impact of lead time, and create a predictable and efficient workflow. As a rule, your WIP Limit is too low if you hit bottlenecks every week, and too high if blockers don’t cause an issue.
When deciding to vary the WIP Limit of a column, Kanban uses the five focusing steps from the Theory of Constraints3 as the incremental process improvement model. These are:
1 Identify the system’s constraints: A bottleneck is an extreme example of a constraint. The slowest part of any process, no matter how smoothly it is working, will limit the throughput of the rest of the process.
2 Decide how to exploit the system’s constraints: Keep the constrained state focused and busy at all times, by focusing on value adding work, removing impediments, and providing high-quality tools and materials.
3 Subordinate everything else to the above decision: All other states should not produce more than the constraint can process. This means that, by definition, they have available capacity that can support the constrained state to focus on its core responsibilities.
4 Elevate the system’s constraints: Once the constrained state has been fully exploited, the Team, or organisation, needs to invest in additional capability, in order to increase its overall capacity.
5 If, in a previous step, the constraint was broken (e.g. it is no longer a constraint), go back to step one: At this point, the overall system throughput will have increased, and the system constraint will move to a new point. This encourages continuous improvement (Kaizen) within each Team’s processes.
One of the key benefits of creating Cross-Functional Teams, is that is becomes easier to subordinate to, and elevate, a constraint (steps three and four), after identifying a bottleneck. Because the WIP Limit acts as a control mechanism within the system, Team Members are forced to collaborate and change role (e.g. from Working to Testing), rather than continue completing work faster than the constraining state can process it. The Kanban Board provides real time, and clear feedback, on bottlenecks. There is a bottleneck that needs to be resolved when a state is at capacity, and the following state is starved of Cards, or all the Cards in the preceding state are ‘Ready’ to move on. This visualisation and control of workflow also acts as direct stimuli for continuous and incremental improvement to the Kanban framework, and your overall Agile Business Management process.
Let me finish this section by giving you Toyota’s six rules for Kanban4,5.
1 Do not send defective products to the subsequent process.
2 The subsequent process comes to withdraw only what is needed.
3 Produce only the exact quantity withdrawn by the subsequent process.
4 Equalise, or level, the production.
5 Kanban is a means to fine tuning.
6 Stabilise and rationalise the process.

Quality control
|
‘Failure is simply the opportunity to begin again, this time more intelligently. There is no disgrace in honest failure; there is disgrace in fearing to fail.’ Henry Ford, 1922 |
Quality control, whether formal and systematic, or informal and ad hoc, is the responsibility of every individual, Team, and Department, and should cover each stage of the work lifecycle. In project management, there is a saying, ‘Fast, Good, or Cheap; pick two’, and while it may sometimes be true, under an Agile Business Management approach, quality controls are embedded within the work lifecycle, thus taking it out of the equation.
Dedicated testers embedded within each Team undertake quality control, while still ensuring a separation between the doers and testers. Regardless of whether your Team uses Incremental or Continuous Delivery, one tester per Team (between five-nine people) should be able run complete Quality Control Tests at roughly the same rate as Requirements are completed. High-risk or high-complexity Requirements may require additional testers per Team (or smaller Teams); play with the Team numbers until you reach that perfect point where everyone is busy, but no one is being a bottleneck. A Kanban Board is a simple way of visualising bottlenecks, as per Figure 23.
In smaller organisations, and Teams without formal quality control processes, doers could take on testing responsibilities, as long as they do not test their own work.
Embedding quality control within your Teams, also simplifies internal approval and sign-off processes. Assuming a level of trust, and let’s face it, if you don’t trust your testers, you have bigger problems than quality control, senior executives should only need to undertake cursory examinations prior to approving the Deliverables for Release. This will improve overall efficiency, and reduce any tendency towards micromanagement. As an Agile Manager, you may not think the work is perfect, but as long as it fulfils the Customers’ Requirements, and meets all agreed quality standards, there should be no reason for you to send it back for re-work.
|
Remember Agile principle #1: Our highest priority is to satisfy the customer, through early and continuous delivery of valuable software [Requirements]. |
The responsibilities of the dedicated testers are to:
•Validate Deliverables against Customer Requirements.
• Ensure that Deliverables quality meets Customer expectations.
• Check that the Deliverables follows appropriate corporate standards (such as using correct document templates).
• Undertake low-level, or fine-grained, analysis of Deliverables, such as checking spelling and grammar, validating budget line items, or materials workmanship.
• Check that the new Deliverables integrate with existing Deliverables, or existing products (integration testing).
• Validate that any replacement Deliverables continue to meet the same standards as the previous version (regression testing).
• Provide ongoing testing throughout each stage of work.
• Validate that all outputs comply with relevant legislation, or industry standards.
• If relevant, or required, check that the outputs are usable by all potential consumers, including disabled people.
• If relevant, check that different versions of the same product are functionally identical (e.g. in different languages).
As a final step to ensure high-quality outcomes for the Customer, Agile Business Management draws on the ‘Test-Driven Development’ software engineering Agile method. As described earlier, Test-Driven Development requires that software developers create several tests, generally fully automated, before building a new feature. If, after the Requirement is complete, the new tests pass, then the software is displaying correct behaviour.
The core concept of writing Quality Control Tests before beginning work on any Requirement applies, just as well, to any Requirement. Let’s call this ‘Test-Driven Work’ (TDW), the art of Test First, Test Often. How should HR confirm they recruited the right person for the role? What validation will Finance and Accounting undertake to ensure that the annual report is correct? How will Media and Communications ensure that the new advertising campaign was successful? And, of course, how will your Delivery Teams verify that the product meets your Customer’s expectations?
|
Test-Driven Work: The act of writing Quality Control Tests prior to beginning any work, rather than after. |
|
Automated Quality Control Test: A Quality Control Test that can be regularly run without human interaction. |
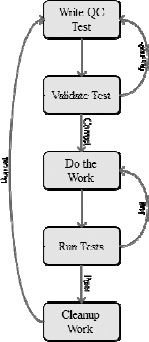
There are six main steps to Test-Driven Work, for each new Task or Requirement.
1 Create a Quality Control Test in conjunction with the Customer (and add the tests to the test catalogue).
2 Validate the Quality Control Test is correct.
3 Do the work (fulfil the Requirement).
4 Run all related tests from the test catalogue, not just the new test.
5 Clean up the work, to ensure it meets corporate standards, and can be easily integrated with related Requirements.
6 Repeat.
The first point is often overlooked; your Team and Customers, in collaboration, should create Quality Control Tests. By working together and pre-defining the tests, the Team can easily measure progress towards meeting the Customers’ agreed expectations, e.g. 15 out of 50 Story Points have passed quality control. The Customer can then make informed decisions about the Deliverable. This also means that the Team can honestly claim a Requirement is Done, even before the final Customer sign off. Your Customer can change their mind about the Requirement later, but the Team should be working efficiently, and accurately, within their current understanding.
By running all related tests from the test catalogue (Point 4), your Team can verify that the newly completed Requirement has not affected negatively on previously completed, and accepted, Requirements.
A little bit of common sense needs to be applied here; the more variables influencing the Quality Control Tests will reduce the accuracy of the check, and the effectiveness of the Requirement itself.
|
Example quality control scenarios Media and Communications have created an advertising campaign to test the market for a new product. The pre-defined Quality Control Test (10% increased sales of the new product) demonstrates that the advertising campaign was a success. However, related Quality Control Tests may show that the campaign has alienated existing consumers, resulting in reduced sales of other products. |
|
Example quality control scenarios Our advertising campaign failed to meet the 10% increased sales Quality Control Test. This does not necessarily mean that the advertising campaign was of poor quality. It may have been because: • The product itself is deficient • The economy went into depression • The new iPhone was released, so no one has any money. |
If a completed Requirement fails a Quality Control Test once or twice, it will generally be the work at fault. However, if it consistently fails the test, you need to start looking beyond the work, for other factors that may be affecting it.
For further detail, there are many excellent books written on the subject of quality control, quality assurance and Test-Driven Development6,7,8.
The Daily Stand-up and Agile meetings
|
‘There is nothing so useless as doing efficiently that which should not be done at all.’ Peter Drucker, 2003 |
The Daily Stand-up is a short Team meeting that provides a consistent focus on progress, and a forum for your Teams to discuss issues. The Daily Stand-up is not a status report; it is an informative, and interactive, discussion, that informs the Team’s understanding of what is happening, by whom, and its progress. This is the key inspection and transparency mechanism within the Team.
|
Daily Stand-up: A daily,15 minute, Team meeting, to discuss progress, plans and issues. |
This meeting consists of the Customer (or Customer Representative), Team Facilitator, and the Team, and is restricted to 15 minutes. Non-Team Members are welcome to watch the Daily Stand-up, though, they are restricted from participating, during the 15 minutes, and the Team Facilitator is responsible for enforcing this.
All participants should answer the following three questions:
1 What did you achieve yesterday (or since the last Stand-up)?
2 What will you achieve today (or before the next Stand-up)?
3 What impediments may prevent you from achieving your goal?
The Daily Stand-up is run, primarily, for the benefit of the Team, and so each Team, not management, is responsible for running their own Daily Stand-up. It is the responsibility of the Team Facilitator to ensure the Daily Stand-up runs smoothly, is restricted to 15 minutes, and record any impediments identified by the Team. Strong facilitation by the Team Facilitator is the key to a good Daily Stand-up, rather than any set agenda. The Team Facilitator watches, and directs, the flow of the conversation, to cover all topics, whilst enforcing the strict time limit. Stand-ups that exceed the allocated time can significantly affect the time available to deliver Requirements, and participants who are not directly involved in the conversation will quickly lose interest. Schedule follow-on discussions to discuss issues identified during the Stand-up. This means that only those with an interest in the issue stay, and everyone else can return to work, with minimal interruption.
Anyone familiar with Scrum will recognise this as similar to the Daily Scrum.
Departments, or projects, with multiple Teams, should hold a Summary Stand-up, also restricted to 15 minutes, after the initial Stand-up. This gathering should bring together Team Facilitators (or relevant Team Members) from multiple Teams, to answer the same three questions as before, but relating to their Teams.
|
Summary Stand-up: A Daily Stand-up consisting of representatives from each of the Teams with a |
Do not hold meetings, gatherings, or workshops, without a well-defined need. However, if they are required, they should be facilitated, and strictly timeboxed. With a good facilitator tracking time and content, the conversation can flow dynamically, as needed by the participants. Facilitation to this level is very difficult, and needs someone who can manage conflicting needs, maintain neutrality on the issues discussed, remain assertive without being overbearing, and mix in a bit of common sense. Creating, and keeping to, simple agendas, can be useful, to ensure participants are on track and meetings on time, but meetings will still require facilitation.
Effort estimation
|
‘There is only one good, knowledge, and one evil, ignorance.’ Socrates, ∼3rd Century CE |
Estimating Requirements
Without a clear understanding of the effort involved to deliver a Requirement, it is impossible for your Team to accurately plan their work; both at a macro level, defining a final delivery date, or micro level, assigning Requirements into Iterations. Taking a highly successful concept from Agile, you can use Story Points, and Story Point estimation, to provide a mechanism by which Teams can estimate effort. A Story Point is an arbitrary single number intended to represent all of the effort required for the whole Team to complete a single Requirement, and are relative to an initial, simple reference Requirement (or User Story). By selecting the simplest, best understood, Requirement possible, and defining that as one Story Point, the Team can estimate all future Requirements as a multiple of this reference Requirement9.
|
Story Point: An arbitrary number intended to represent all of the effort required for the whole Team to complete a single Requirement, relative to a reference Requirement. |
For high-level estimates, Story Points are generally better than time estimates, as they factor in non-time based complexity and uncertainties. As an estimate of complexity, they are not as affected by specific Team performance, and so tend to have less variation. There have also been numerous studies showing that, on average, Teams are better at relative estimation than absolute estimation.
To make a Story Point estimate requires representation of all the skills needed for delivery during the estimation process. Your Team is ultimately accountable for the estimate, and while management and the Customer can provide input, only the Team understands the effort required. Extending this means that only your Team can make the estimate, not you, other managers, business analysts, or the Customer.
Use Story Points for the high-level estimation of Requirements, and reference the effort involved in the delivery of similar Requirements. As the reference Requirement is Team specific, different Teams will have different definitions of a Story Point. Assuming that a Team is relatively constant, the size of a Story Point for that Team will eventually normalise over time.
|
Your Teams may need to re-baseline the reference Requirement, as the type of Requirements change, or they find too many sub-one Story Point Requirements. |
Your Teams will estimate, and re-estimate, Requirements, whenever the Customer modifies the Requirements Backlog. Updated and revised estimates take into account new information, as well as improvements in the estimation process itself.
Estimating tasks
Story Points are an excellent, long-term, average predictor, but lose definition if used for short-term estimation. If your Teams break Requirement into Tasks during the planning phase of Incremental Delivery, then an indication of how many hours effort is required for each Task, is important for good planning.
A Task effort estimate is not the same as duration (e.g. three hours efforts > three hours duration). Converting effort into duration needs to take into account staff overheads, such as breaks, meetings, illness, and assisting other Team Members. To calculate estimated duration, multiple staff overhead to the estimated effort.
|
Staff Overhead: Any time used by a staff member during working hours, not in the delivery of Tasks or Requirements. Overhead includes; breaks, meetings, illness, and assisting other Team Members. |
|
Effort: Only the specific time required to complete a Task or Requirement, excluding any overhead. |
The algorithm to calculate staff overhead (per Iteration) is as follows:
Working Hours = (hours per day * days per Iteration * staff) – planned leave
Actual Hours = sum of actual (from last Iteration)
Staff Overhead = Working Hours/Actual Hours
|
Example estimate to duration calculation: Working Hours = (8 * 10 * 5) – 0 = 400 Actual Hours = 300 Staff Overhead = (400/300) = 1.3 Effort Estimate = 5 hours Duration = 5 * 1.3 = 6.5 hours |
Working Hours: The total time a Team Member spends at work (usually between 7.5 and 8 hours per day). |
|
|
Actual Hours: The total effort to complete a Task or Requirement, as measured when complete. |
Estimation process
Though they use different measures, the estimation process for Requirements (Story Points) and Tasks (Effort) is the same10.
To simplify the estimation process, and ensure that estimates are realistic, estimates are chosen from the modified Fibonacci series; 1, 2, 3, 5, 8, 13, 20, 40, and 100. There are three benefits to using this sequence:
1 Improved design – it encourages features to be split into a reasonable size.
2 Estimate skill – people are better at estimating small Tasks, so it provides a more realistic range.
3 Meaningful estimates – though the same value, the difference in estimate between 1 and 2 is meaningful, whereas the difference between 20 and 21 is not.
There are four primary methods for estimating Requirements and Tasks:
1 Expert opinion: The Team Member with specific understanding, or who is most likely to develop the Task or Requirement, can provide a more accurate estimate of effort. For example, an accountant can better estimate effort for finance Tasks.
2 Comparison: Comparing a Task or Requirement to another, already estimated, Task. For example, ‘Hiring four Team Members is about twice the effort of hiring two Team Members’.
3 Components: If a Task or Requirement is too large to estimate accurately, break it into small Sub-Tasks. For example, designing a promotion can be broken into traditional media, social media, graphic design, printing, etc.
4 Historical statistics: If a Task or Requirement is nearly identical in outcomes, size, and complexity to a previous Task or Requirement, then use the actual effort of the previous, as the estimate of the new. For example, resetting a user’s password takes almost the same time, regardless of who it is for, or when it is requested.
Other methods can help improve the estimation process. One of the most popular is Planning Poker. Developed in 2002 by James Grenning11, Planning Poker is an estimation game, using a special set of cards (based on the modified Fibonacci series above), that promotes collaboration and consensus building during the estimation process. Figure 25 shows a sample of these cards.

The Team starts by discussing each Requirement or Task, but without mentioning any estimates, to avoid influencing other Team Members. When ready, each person lays a card face down representing their estimate of the Task, and, when all Team Members are ready, simultaneously turns their cards over. The Team Members who selected the highest and lowest estimates have the opportunity to discuss their reasoning, before the Team plays again. It is the responsibility of the Team Facilitator to build consensus, and facilitate the quick, but open, discussion.
Measuring progress
|
‘Let us labour for that larger and larger comprehension of truth, that more and more thorough repudiation of error, which shall make the history of mankind a series of ascending developments.’ |
In order to know what is Done, and to plan future Requirements, each Team must measure their rate of progress. In Agile terms this is called Velocity. Velocity is a measure that determines the capacity, and resulting output from the Team, over time. Put more simply, it is the rate at which your Teams can deliver Requirements, as measured by Story Points. Each Team will have their own Velocity, and as the Team composition and experiences change, so will the Velocity. Teams that use Continuous rather than Incremental Delivery (such as HR), will calculate their Velocity in the same way, Requirements delivered over time. However, rather than use Iterations, these teams would use a fixed reporting period, such as a week. This period would also feed into their Retrospective cycle.
Velocity should be constantly calculated, and recalculated, from previous rates of delivery. However, this assumes, a) that this Team has completed at least one previous Requirement, b) that the new Requirements are of similar composition, and c) the process for estimating the new Requirements is equivalent. If any of these are not true, then the Team should make a guess of their Velocity for planning purposes. Calculate the actual Velocity after the first Iteration is complete.
|
Example Velocity calculation: Iteration 1 Requirement 1: 5sp Requirement 3: 7sp Total: 12sp Requirement 4: 3sp Requirement 6: 5sp Requirement 2: 1sp Requirement 9: 6sp (incomplete) Total: 9sp + 6sp (incomplete) Iteration 3 Requirement 9: 6sp Requirement 10: 6sp Requirement 10: 5sp (incomplete) Total: 12sp + 5sp (incomplete) Velocity = ((5+7) + (3+5+1) + (6+6)) / 3 = (12 + 9 + 12) / 3 = 11sp / Iteration |
As each Requirement is completed, tested, and approved, it should be marked ‘Done’ in the Requirements Backlog. This tells all stakeholders that the Requirement has been finished, that it is ready for the Customer, and can be included in the Velocity calculations. Incomplete Requirements at the end of an Iteration do not count towards the Velocity, as Agile does not make the distinction between 0% complete, 50% complete or 99% complete. However, this is not an issue, as Velocity averages out over multiple Iterations, and factors in minor variations due to partially completed Requirements.
|
It is not meaningful to talk about Task Velocity. The rate at which a Team Member completes Effort Hours is directly proportional to the staff overhead. For example, based on the previous example 6 hours of work per day = 8/6 = 1.3 = staff overhead. |
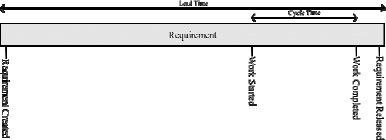
However, Velocity is only one part of the story. For many Teams (such as Support Teams), it is important to also measure the time a Requirement sits in the Backlog before being actioned, or the time a Requirement sits in each state (e.g. the time taken to move from Active to Testing, and from Testing to Done). The primary measures for this are Lead Time and Cycle Time. Unlike Velocity, Lead Time and Cycle Time do not measure effort, but the elapsed time (or duration). Figure 26 shows the relationship between Cycle Time and Lead Time.
|
Lead Time: The time taken between adding a Requirement to the Requirements Backlog, and Releasing it to the Customer. |
Cycle Time: The time taken between starting, and completing, work on a Requirement. |
When each Task is Complete, it should also be marked as Done in the Iteration Backlog. It is optional whether Team Members record an ‘actual’ time spent against each Task. However, by recording the actual effort spent (not including breaks, meetings, etc.), it is possible to validate, and improve, the Task estimation process, and easily calculate staff overhead at the end of the Iteration. However, this can put additional pressure on Teams, and, depending on how the information is used, may not result in improved outcomes.
There can be significant pushback against getting Team Members to record actual time, mostly due to fear of punishment, or performance management. It is important for the Team to understand that the goal of measurement is to empower and improve the Team, not micromanage them. It doesn’t matter if their overhead is 1.3 (6 hours’ work per day) or 10.3 (45 mins work per day), as long as your Teams are being utilised appropriately, and, as a manager, you understand why their overheads are high.
Visualising progress
|
‘However beautiful the strategy, you should occasionally look at the results. ‘ Winston Churchill, anecdotal |
Numbers alone don’t provide enough useful information to manage your Teams. Using Burndown Charts, Cumulative Flow Diagrams, and Cycle Time Run Charts, you can represent, and visualise, the scope of work, planned delivery, and actual delivery of Tasks and Requirements. To ensure full transparency between your Teams and Customers, these Charts should be available to everyone even remotely involved with the Team.
|
Burndown Chart: A visualisation of the total effort, and effort remaining, against time. |
|
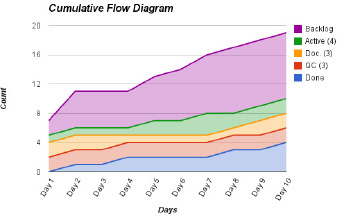
Cumulative Flow Diagram: A visualisation of the elapsed time, and number of Tasks or Requirements remaining in each state, against time. |
|
Cycle Time Run Chart: A visualisation of the Cycle Time (or Lead Time), compared with the average Cycle Time and bounded by the expected tolerances. |
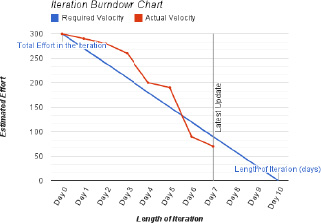
Burndown Charts
Your Customer will mostly be interested in the Release Burndown Chart, which shows the progress of the Team in delivering Requirements (by Story Points) over time. The Team can use the Iteration (Task) Burndown Chart to view progress against the Iteration, improve future estimates, and identify problem trends early.
A Burndown Chart, as shown in Figure 27, graphs the total effort estimated, and estimated effort remaining against time, either the length of an Iteration, or a reportable period. The Y-Axis is the sum of all effort within the Iteration Backlog, and the X-Axis is the number of working days in the Iteration. The diagonal line between the top left and bottom right will visualise your expected Velocity (i.e. you should be able to finish all Tasks in the Backlog within a single Iteration). To visualise and monitor progress, plot the sum of the remaining effort each day.
|
Remember Agile principle #7: Working software [completed Requirements] is the primary measure of progress. |
Similar to the Iteration Burndown Chart, the Release Burnup Chart (Figure 28) visualises the total effort estimated, and estimated effort remaining in the Requirements Backlog, against the expected release delivery dates (usually measured in Iterations). Like the Iteration Burndown Chart, the Y-Axis of the Release Burnup Chart is the sum of all effort within the Requirements Backlog (measured in Story Points), and the X-Axis is the number of Iterations, or weeks, until final Release date, or next major milestone. To chart your Customer’s changing Requirements, plot a line showing the sum of all Requirements per Iteration. Finally, the Required Velocity and Actual Velocity lines visualise progress towards completing the Requirements Backlog.

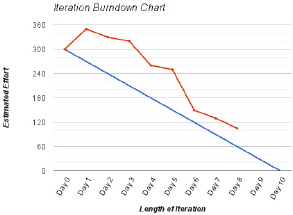
Burndown Charts can help identify problem areas and future risks. These include:
![]() Identified by: A sharp rise on the first day of the Iteration.
Identified by: A sharp rise on the first day of the Iteration.
![]() Identified issue: Immediately after the Iteration begins, issues have been identified, or estimates refined.
Identified issue: Immediately after the Iteration begins, issues have been identified, or estimates refined.
![]() Resolution: Watch the progress carefully, and if necessary, review the Tasks in the Iteration.
Resolution: Watch the progress carefully, and if necessary, review the Tasks in the Iteration.
![]() Identified by: Tracking close to the expected Velocity, followed by a sharp rise mid-way through the Iteration.
Identified by: Tracking close to the expected Velocity, followed by a sharp rise mid-way through the Iteration.
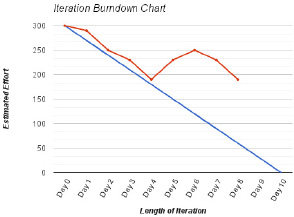
![]() Identified issue: This is caused by Tasks being added mid-Iteration, which leads to poor delivery rates, useless estimates, and wasted effort.
Identified issue: This is caused by Tasks being added mid-Iteration, which leads to poor delivery rates, useless estimates, and wasted effort.
![]() Resolution: Identify who is adding Tasks, and stop this behaviour. In addition, if the new Tasks are truly more important, then the current Iteration should be stopped, and a new Iteration planned.
Resolution: Identify who is adding Tasks, and stop this behaviour. In addition, if the new Tasks are truly more important, then the current Iteration should be stopped, and a new Iteration planned.
![]() Identified by: Tracking well, followed by no visible progress for several days.
Identified by: Tracking well, followed by no visible progress for several days.

![]() Identified issue: Progress has frozen, usually due to Requirements being more difficult than estimated, or unexpected staffing issues.
Identified issue: Progress has frozen, usually due to Requirements being more difficult than estimated, or unexpected staffing issues.
![]() Resolution: Review the Tasks in the Iteration.
Resolution: Review the Tasks in the Iteration.
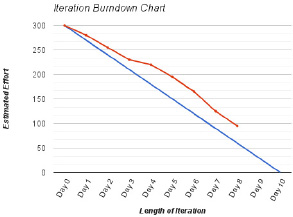
![]() Identified by: A steady burndown of work, but a growing distance between actual, and expected, Velocity.
Identified by: A steady burndown of work, but a growing distance between actual, and expected, Velocity.
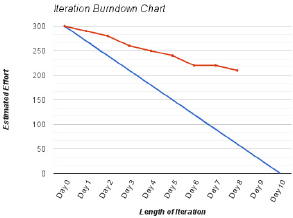
![]() Identified issue: Progress is progressing much slower than expected, generally caused by overloaded staff, or poor estimation.
Identified issue: Progress is progressing much slower than expected, generally caused by overloaded staff, or poor estimation.
![]() Resolution: Review the estimation process, and remove Tasks from the Iteration.
Resolution: Review the estimation process, and remove Tasks from the Iteration.
![]() Identified by: Starting out looking like Plateau, followed by a sharp drop.
Identified by: Starting out looking like Plateau, followed by a sharp drop.

![]() Identified issue: Individual Tasks are too large, and thus difficult to track.
Identified issue: Individual Tasks are too large, and thus difficult to track.
![]() Resolution: Keep each Task under one day of effort.
Resolution: Keep each Task under one day of effort.
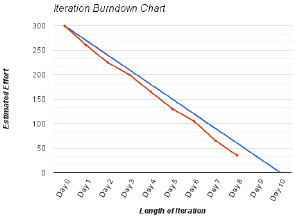
![]() Tracking close to the expected Velocity
Tracking close to the expected Velocity
Cumulative Flow Diagrams
Like the Burndown Chart, a Cumulative Flow Diagram (CFD) visualises the flow of work over time, as shown in Figure 36. However, where the Burndown Chart visualises delivery against estimates, which is useful in verifying that work is on track, the CFD visualises delivery against elapsed time, which is useful in verifying that the delivery of work is efficient.
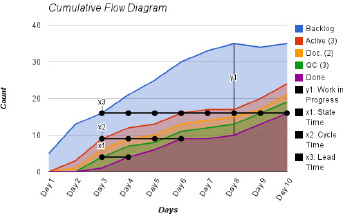
The CFD tracks each state in your workflow separately, from when a card (or Task) enters that state, to the time the card enters the subsequent state. The vertical distance (y1) in each charted line shows the number of Tasks currently in progress. This distance should never be greater than the WIP limit for the state. The horizontal distance (x1) shows the time taken for a Task to progress to the next state. The horizontal distance (x2) shows the Average Cycle Time, the time taken from when a Card leaves the Backlog state, until is it Done. The final horizontal distance (x3) shows the Average Lead Time, the time taken from when the Card enters the Backlog, until it is Done. Like the Burndown Chart, this will also help predict when all the work is Done.
|
Cumulative Flow Diagrams can also help estimate the time required (not the Effort) to deliver new Tasks or Requirements, but only if they are all of equivalent size and complexity. |
Each line on the Cumulative Flow Diagram should appear smooth; any flat vertical or horizontal generally indicates impediments, or an uneven flow of work. You can quickly, and easily, identify bottlenecks, when the area between two bands narrows or, in the worst case, reduces to zero. Keeping low WIP limits simplifies the identification of bottlenecks, when analysing Cumulative Flow Diagrams.
![]() Identified by: A band reducing to zero.
Identified by: A band reducing to zero.
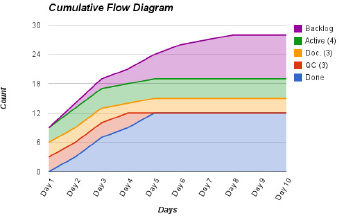
![]() Identified issue: The Documentation state is a bottleneck in the process, and has starved the Quality Control state of any work.
Identified issue: The Documentation state is a bottleneck in the process, and has starved the Quality Control state of any work.
![]() Resolution: Improve the delivery through the bottlenecked state by exploiting, subordinating, and elevating the constraint (see section: Kanbans).
Resolution: Improve the delivery through the bottlenecked state by exploiting, subordinating, and elevating the constraint (see section: Kanbans).
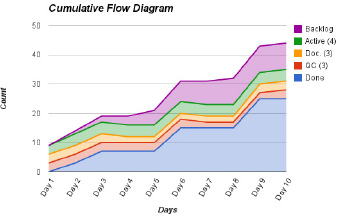
![]() Identified by: Jagged, widening, and narrowing bands, between two or more states.
Identified by: Jagged, widening, and narrowing bands, between two or more states.
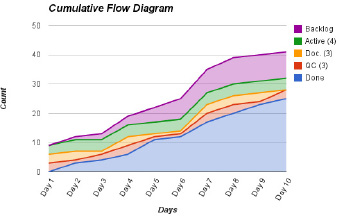
![]() Identified issue: Caused when there is not a smooth flow of work through the system. States that jump to the maximum WIP, and back down again, can also be indicative of bottlenecks, or other impediments, throughout the work processes.
Identified issue: Caused when there is not a smooth flow of work through the system. States that jump to the maximum WIP, and back down again, can also be indicative of bottlenecks, or other impediments, throughout the work processes.
![]() Resolution: Identify the cause of the impediments of bottlenecks, and remove them, to improve the flow of work.
Resolution: Identify the cause of the impediments of bottlenecks, and remove them, to improve the flow of work.
![]() Identified by: A large distance between each band, causing a false sense of smoothness.
Identified by: A large distance between each band, causing a false sense of smoothness.
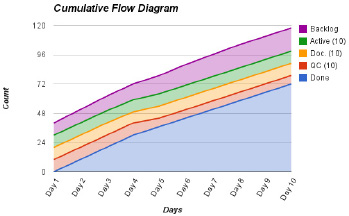
![]() Identified issue: This example actually shows the same variation as the ‘Bottleneck’ example above. However, as the WIP Limit is very large, it is difficult to identify any fluctuations in the chart.
Identified issue: This example actually shows the same variation as the ‘Bottleneck’ example above. However, as the WIP Limit is very large, it is difficult to identify any fluctuations in the chart.
![]() Resolution: Reduce the WIP Limit to an appropriate number.
Resolution: Reduce the WIP Limit to an appropriate number.
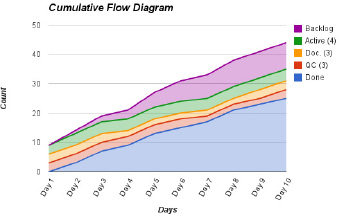
![]() Identified by: A very slow, and shallow, rise in all states.
Identified by: A very slow, and shallow, rise in all states.
![]() Identified issue: There is a long lead time (and cycle time) between raising a Requirement, and it being Delivered to the Customer.
Identified issue: There is a long lead time (and cycle time) between raising a Requirement, and it being Delivered to the Customer.
![]() Resolution: Reduce the WIP Limit, or reduce the size of the Requirements, to improve the speed of the workflow.
Resolution: Reduce the WIP Limit, or reduce the size of the Requirements, to improve the speed of the workflow.
![]() Identified by: Tracking well, followed by no visible progress for several days.
Identified by: Tracking well, followed by no visible progress for several days.
![]() Identified issue: The flow of work has stopped (or dramatically slowed), usually caused by critical production issues, large-scale staff absences (e.g. Christmas holidays), or waiting for Customer sign off.
Identified issue: The flow of work has stopped (or dramatically slowed), usually caused by critical production issues, large-scale staff absences (e.g. Christmas holidays), or waiting for Customer sign off.
![]() Resolution: Identify what is causing the halt of workflow, and (if appropriate) resolve the underlying issue.
Resolution: Identify what is causing the halt of workflow, and (if appropriate) resolve the underlying issue.
![]() Tracking well in terms of consistent rise, and no major widening or narrowing of bands.
Tracking well in terms of consistent rise, and no major widening or narrowing of bands.
Cycle Time Run Charts
Teams that measure Cycle Time and Lead Time can visualise these metrics using Cycle Time Run Charts (sometimes known as statistical process control charts). By looking for trends, cycles and outliers, Cycle Time Run Charts will help you to identify both normal, and uncontrolled, variations in process flow. Noting, of course, that all processes will show some variation.
|
As described in Chapter 1: You, the Agile Manager, it is important to understand which variations are normal (common causes), and which variations are out of control (special causes). |
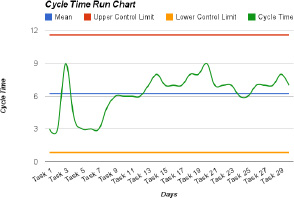
Run Charts plot the Cycle (or Lead) Time of each Requirement, against the long-term average, known as the centre line. From a continuous improvement perspective, you should aim to improve your work processes, so the centre line (and thus your average Cycle Time) meets your Customer’s needs.
If you know the expected variance within your process (usually ± three standard deviations), you can plot the Upper Control Limit (UCL) and Lower Control Limit (LCL). These limits are the primary mechanism to identify special cause events. This means you should investigate any Cycle Times outside these limits, as they can indicate a process out of control.
|
Control Limit: The bounds of expected variance within the Team’s processes. Processes that exceed these control limits can be said to be uncontrolled. |
It is simple to calculate Cycle Time Run Charts when all Customer Requirements are of approximately equal size and effort. However, they can still be effective for Requirements of varying sizes, but will have higher Control Limits, and need a larger dataset to calculate a meaningful average.
|
Teams that work on multiple types of Requirements may have multiple Run Charts, one for each type. For example, HR may have a recruitment Run Chart and a performance management Run Chart. |
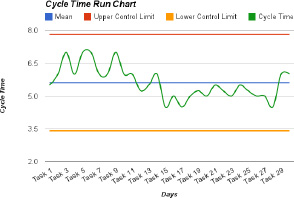
![]() Identified by: A run of points that are continuously increasing or decreasing.
Identified by: A run of points that are continuously increasing or decreasing.

Identified issue: There is a progressive trend in the Cycle Time, implying that something is gradually shifting over time.
Resolution: If the trend is in the right direction (usually down), it may be part of ongoing process improvement, and your Team should sustain the change. Otherwise, your Team needs to determine the cause of the variation, and resolve it.
![]() Identified by: A run of points on a single side of the centre line.
Identified by: A run of points on a single side of the centre line.
![]() Identified issue: There is a sustained shift in Cycle Time, and may have reached a new equilibrium.
Identified issue: There is a sustained shift in Cycle Time, and may have reached a new equilibrium.
![]() Resolution: If the shift is in the right direction (usually down), it may be part of ongoing process improvement, and your Team should sustain the change. Otherwise, your Team needs to determine the cause of the variation, and resolve it.
Resolution: If the shift is in the right direction (usually down), it may be part of ongoing process improvement, and your Team should sustain the change. Otherwise, your Team needs to determine the cause of the variation, and resolve it.
![]() Identified by: Points above the UCL, or below the LCL.
Identified by: Points above the UCL, or below the LCL.
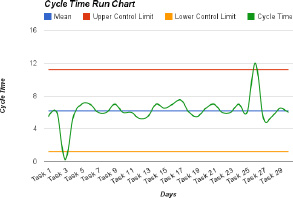
![]() Identified issue: Extreme variation (special causes) in the Team’s process that may indicate a process out of control.
Identified issue: Extreme variation (special causes) in the Team’s process that may indicate a process out of control.
![]() Resolution: Identify the cause of the outliers, and if systemic, resolve the underlying issues.
Resolution: Identify the cause of the outliers, and if systemic, resolve the underlying issues.
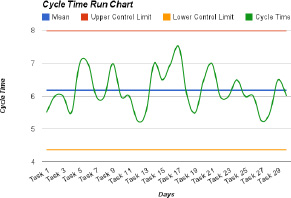
![]() No major variations in process flow.
No major variations in process flow.
1 Applying Agile Software Principles and Practices for Fast Automotive Development, Socha, Folsom and Justice (2012).
2 Kanban: Successful Evolutionary Change for Your Technology Business, Anderson, (2010).
3 The Goal: A Process of Ongoing Improvement, Goldratt and Cox (1986).
4 Kanban Just-in Time at Toyota: Management Begins at the Workplace, Lu and Noritsu Kyōkai (1986).
5 Toyota Production System: Beyond Large-Scale Production, Ohno (1988).
6 Test-Driven Development by Example, Beck (2002).
7 Refactoring: Improving the Design of Existing Code, Fowler and Beck (1999).
8 The Management and Control of Quality, Evans and Lindsay (2008).
9 Agile Estimating and Planning, Cohn (2005).
10 Agile Estimating and Planning, Cohn (2005).
11 Planning Poker or How to Avoid Analysis Paralysis while Release Planning, Grenning (2002).