Good exception handling and error reporting are critical for the serviceability of your plug-in. In addition, you might also want to instrument your plug-in with optional debugging code that can help you localize plug-in problems in the field. You will want to selectively turn on or off this debugging code. Therefore, in this chapter we will instrument our plug-in using the Eclipse trace facility.
Auto-testing is tightly integrated into the builder and is almost fully transparent to the user. How do we react to a customer problem report indicating that not all of their tests are automatically run? We would like to be able to ask the user for more information. To prepare our code for such a question, we instrument the AutoTestBuilder with debugging code that prints to the console the list of test cases found.
We will use the org.eclipse.jdt.core plug-in as our example, as it is heavily traced. The tracing options and their values are defined in a .options file that is located in the plug-in folder (see Figure 21.1).
Inside the .options file the options values are defined using a “plug-in id/option path” syntax:
Example . org.eclipse.jdt.core/.options
# Reports incremental builder activity
org.eclipse.jdt.core/debug/builder=false
# Reports compiler activity
org.eclipse.jdt.core/debug/compiler=false
You can enable or disable these option in the .options file. The debug options provided by a plug-in are presented on the PDE target run-time tab (see Figure 21.2).
In your plug-in code you can query an option setting by calling Platform.getDebugOption() with your option path.
To instrument the test-finding code, we mimic the .options file from org.eclipse.jdt.core and add a similar .options file to the org.eclipse.contribution.junit plug-in project. We support only a single option to trace the test classes found:
Example . org.eclipse.contribution.junit/.options
# Reports the found tests when in auto test mode
org.eclipse.contribution.junit/trace/testfinding=false
In the AutoTestBuilder class we want to test whether this option is set and, depending on its value, write the tests found to the console. An option's value cannot be changed at runtime. Therefore we only look up its value once. The option values are surfaced by the Platform Façade. We use a static initializer to perform the test once and store the result in a static trace variable:
Example . org.eclipse.contribution.junit/AutoTestBuilder
private static boolean trace= false;
static {
  String value= Platform.getDebugOption(
    "org.eclipse.contribution.junit/trace/testfinding");
  if (value != null && value.equalsIgnoreCase("true"))
    AutoTestBuilder.trace= true;
}
Next, we instrument the build method as follows:
Example . org.eclipse.contribution.junit/AutoTestBuilder
protected IProject[] build(int kind, Map args, IProgressMonitor pm)
     throws CoreException {
  if (hasBuildErrors())
    return null;
  IJavaProject javaProject= JavaCore.create(getProject());
  IType[] types= new TestSearcher().findAll(javaProject, pm);
  if (AutoTestBuilder.trace)
    printTestTypes(types);
  JUnitPlugin.getPlugin().run(types, javaProject);
  return null;
}
Finally, printTestTypes() prints the fully qualified type names to System.out.
Example . org.eclipse.contribution.junit/AutoTestBuilder
private static void printTestTypes(IType[] tests) {
  System.out.println("Auto Test: ");
  for (int i= 0; i < tests.length; i++) {
    System.out.println("	"+tests[i].getFullyQualifiedName());
  }
}
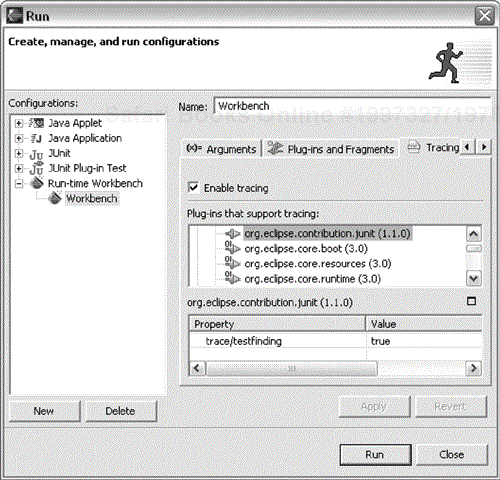
With this in place we can enable tracing in the launch configuration dialog, as shown in Figure 21.3.
With the option set to true we get the test-finding trace output in the console:
Auto Test:
  junit.samples.money.MoneyTest
  pack1.FailTest
During development you can use PDE to enable and disable tracing options as shown above. To enable tracing options for Eclipse in the field, use the -debug command line option followed by the location of the .options file. For example:
eclipse.exe -debug c:/eclipse/plugins/org.eclipse.contribution.junit/.options
Now if a user has trouble with tests not being found, we can ask them to rerun Eclipse with the tracing options set and we have a chance to understand the problem. Next we'll make our test-failure error markers more powerful by letting the user rerun failed tests from a marker. In this chapter we
Defined a tracing option in the plug-in's .options file
Retrieved the option value at runtime and emitted additional trace information


