
Chapter 12
Analyzing Indicators of Compromise
Responding to security incidents and network events is a common task for cybersecurity analysts, and to do so, you need to know how to recognize common indicators of compromise. Network problems such as excessive or suspicious bandwidth consumption, probes and scans, and rogue devices are all likely to be encountered by security professionals and can indicate problems. Host and application issues are also frequently part of response processes, including host performance problems, malware, and more focused attacks. That makes knowing what to look for, how to find it, and what your response options are an important part of cybersecurity operations.
In the first section of this chapter, you learn about common network events ranging from bandwidth use and data exfiltration to scans, probes, and denial-of-service attacks, as well as some of the tools that are frequently used to detect them and to perform that analysis. In the sections that follow, you learn about host and application problems, detection and analysis techniques to address them, and examples of handling methods for common issues related to these symptoms.
Analyzing Network Events
Many incidents start with the discovery of suspicious or unexpected network traffic. These events may take the form of bandwidth consumption, attack traffic, or unexpected devices showing up on the network. As a cybersecurity analyst, you need to be able to gather, correlate, and analyze the data from a multitude of systems and network devices to detect, or better, to prevent these incidents from becoming serious issues.
Capturing Network-Related Events
One of the first steps in gaining a high-level understanding of a network is getting visibility into how the available bandwidth for the network is being used. This is typically done through one of three common methods: router-based monitoring, active monitoring, or passive monitoring.
Router-Based Monitoring
Router-based monitoring relies on routers or switches with routing capabilities to provide information about the flow of traffic on the network and the status of the network device itself. Since routers are normally placed at network borders or other internal boundaries, router-based monitoring can provide a useful view of traffic at those points.
Most router-based monitoring relies on capturing data about the traffic that is passing through the device. This information about traffic flow is often referred to as network flows. A number of technologies exist to capture flows and other router information, including
- NetFlow, or similar technologies like sFlow, J-Flow, and others, are standards for monitoring traffic flows. They count information about traffic at network device interfaces and then send that information to flow collectors. Flows are often sampled due to the sheer quantity of data, meaning that one in a thousand or one in a hundred packets are sampled rather than every packet.
- RMON was developed to monitor local area networks and operates at layers 1–4 of the network stack. RMON typically operates in a client/server model and uses monitoring devices (probes) to gather data. It is implemented as a management information base (MIB), which provides monitoring groups with information about networks and focuses on flow-based information, including statistics, history, alarms, and events.
- In addition to flow-based reporting, the Simple Network Management Protocol (SNMP) is commonly used to collect information from routers and other network devices and provides more information about the devices themselves instead of the network traffic flow information provided by RMON or NetFlow or related flow-capture protocols.
In Figure 12.1, a simple example of a typical network shows how the central placement of routers can provide visibility into the overall traffic flow of a network. Traffic sent from the distribution switches to the other division's network, or to the Internet, will be sent through the division routers and possibly through the border router, allowing network flow information to be captured on a central flow collection system.

FIGURE 12.1 Routers provide a central view of network traffic flow by sending data to flow collectors.
Flow information can look a lot like information from a typical phone bill—you can see who you called, what number they were at, and how long you talked. With flows, you can see the source, its IP address, the destination, its IP address, how many packets were sent, how much data was sent, and the port and protocol that was used, allowing a good guess about what application was in use. Figure 12.2 shows an example of PRTG's NetFlow tool, with this data listed in a way that allows data to be sorted and searched.

FIGURE 12.2 NetFlow data example
This information can be very useful for both day-to-day monitoring and for investigations. In addition, feeding flow data to a security monitoring tool that uses behavior-based detection capabilities can identify issues like unexpected communications to remote command and control (C&C) systems. In Figure 12.2, you can see that local hosts are browsing remote sites—192.168.1.14 visits 157.240.2.35—a Facebook content delivery network host. If you saw traffic that was not expected when you reviewed traffic or if you were investigating suspicious traffic, flows can provide a useful way to quickly review what a given host is doing. Network flow data can be used both proactively, to monitor overall network health and traffic levels, and reactively, to monitor for unexpected traffic or for sudden changes in network bandwidth usage. This data is often combined with other network and system log and event data using a security information and event management (SIEM) device or log analysis tool to provide deeper analysis and response capabilities.
Active Monitoring
Active monitoring techniques reach out to remote systems and devices to gather data. Unlike flows and SNMP monitoring, where data is gathered by sending information to collectors, active monitors are typically the data gathering location (although they may then forward that information to a collector). Active monitoring typically gathers data about availability, routes, packet delay or loss, and bandwidth.
Two examples of active monitoring are
- Pings—Network data can also be acquired actively by using Internet Control Message Protocol (ICMP) to ping remote systems. This provides only basic up/down information, but for basic use, ICMP offers a simple solution.
- iPerf—A tool that measures the maximum bandwidth that an IP network can handle. Public iPerf servers allow remote testing of link bandwidth in addition to internal bandwidth testing. iPerf testing data can help establish a baseline for performance to help identify when a network will reach its useful limits.
Both active and router-based monitoring add traffic to the network, which means that the network monitoring systems may be competing with the traffic they are monitoring. When significant network bandwidth utilization issues appear, this type of network monitoring data may be lost or delayed as higher-priority traffic is likely to be prioritized over monitoring data.
Passive Monitoring
Passive monitoring relies on capturing information about the network as traffic passes a location on a network link. In Figure 12.3, a network monitor uses a network tap to send a copy of all the traffic sent between endpoints A and B. This allows the monitoring system to capture the traffic that is sent, providing a detailed view of the traffic's rate, protocol, and content, as well as details of the performance of sending and receiving packets.

FIGURE 12.3 Passive monitoring between two systems
Unlike active and router-based monitoring, passive monitoring does not add additional traffic to the network. It also performs after-the-fact analysis, since packets must be captured and analyzed, rather than being recorded in real time as they are sent. This means that the trade-offs between each monitoring method should be considered when choosing a technique.
Network Monitoring Tools
Network monitoring involves much more than a view of just the routers or the traffic passing through interfaces. Gathering information from multiple network devices and combining that data into useful views for analysis and reporting is critical to ensuring that you have a good view of what is occurring on your network. Fortunately, tools are available that are specifically designed to provide this visibility.
PRTG
One common choice for monitoring bandwidth usage is PRTG (the Paessler Router Traffic Grapher). PRTG provides a variety of network monitoring capabilities, including server monitoring, network monitoring, and bandwidth monitoring. PRTG combines four types of monitoring to provide a more accurate picture of bandwidth utilization:
- Packet sniffing, which monitors only the headers of packets to determine what type of traffic is being sent. This can identify information from packets that the sensor can read, but an encrypted session may not reveal much.
- Flows, which can send either information about all connections, or a sampled dataset.
- SNMP (Simple Network Management Protocol), a protocol that allows network devices to send information about important events as SNMP traps.
- WMI (Windows Management Instrumentation), which provides an interface that allows script and application access for automation of administrative tasks, as well as a means of accessing management data for the operating system, and can provide reports to tools like System Center Operations Manager for Windows systems. A hybrid mode allows access to Windows performance counters using the remote registry service, with WMI as a fallback. This approach can make a Windows system's native monitoring capability useful for a central view.
Figure 12.4 shows PRTG's overview window. Traffic over time as well as flow information are shown in near real time. To investigate a problem, you can simply drill down by clicking the appropriate view.
Overview and dashboard screens in tools like PRTG are often used to provide a high-level overview of network performance. A sudden drop-off or increase in network usage can be quickly seen on the overview chart, and drilling down by clicking the chart can help to isolate or identify a system or interface that is affected or that may be causing the issue. More detailed searches and filters can also be accessed in tools like this to answer specific questions if you are working from existing knowledge like an IP address or interface that needs to be investigated.
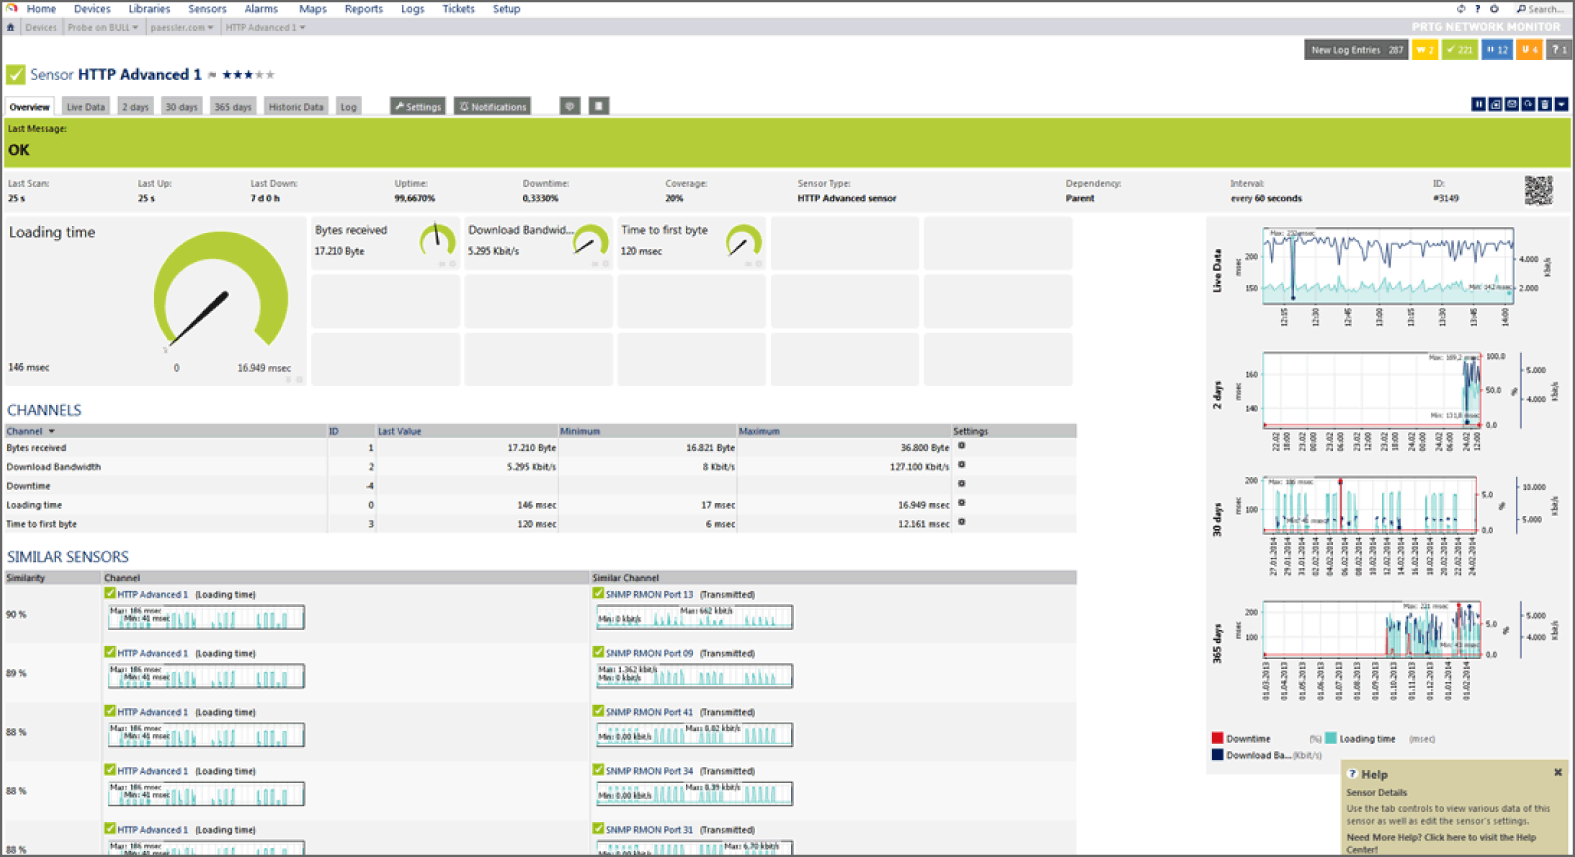
FIGURE 12.4 PRTG network overview
SolarWinds
SolarWinds sells a variety of network monitoring tools that address multiple types of data gathering. Combining the ability to identify network issues and intelligence about network bandwidth and flows can provide a better view of what is occurring on a network, making a pairing of tools like this a good solution when trying to understand complex network issues.
Nagios
Nagios is a popular network and system log monitoring tool. Nagios supports a broad range of plug-ins, including the ability to build and integrate your own plug-ins using Perl or executable applications. Nagios provides a broad range of monitoring capabilities beyond network monitoring, making it a useful tool if you want to have a central view of system and network data in one place.
Cacti
Cacti is an open source tool that uses SNMP polling to poll network devices for status information and provides graphical views of network and device status. Additional data can be included by using scripts with data stored in a database, allowing Cacti to provide visibility into a range of devices and data types. Cacti leverages RRDTool, a graphing and analysis package to provide detailed graphical views of the data it gathers.
Detecting Common Network Issues
Once you have visibility into your network's bandwidth and device status, you can use that knowledge to track common network problems. These common problems include bandwidth consumption, link and connection failures, beaconing, and unexpected traffic. Although each of these problems is common, the causes of each type of issue can be quite varied!
Bandwidth Consumption
Bandwidth consumption can cause service outages and disruptions of business functions, making it a serious concern for both security analysts and network managers. In a well-designed network, the network will be configured to use logging and monitoring methods that fit its design, security, and monitoring requirements, and that data will be sent to a central system that can provide bandwidth usage alarms. Techniques we have already discussed in this chapter can provide the information needed to detect bandwidth consumption issues:
- Tools like PRTG that use flow data can show trend and status information indicating that network bandwidth utilization has peaked.
- Monitoring tools can be used to check for high usage levels and can send alarms based on thresholds.
- Real-time or near-real-time graphs can be used to monitor bandwidth as usage occurs.
- SNMP data can be used to monitor for high load and other signs of bandwidth utilization at the router or network device level.
Beaconing
Beaconing activity (sometimes a heartbeat) is activity sent to a C&C system as part of a botnet or malware remote control system and is typically sent as either HTTP or HTTPS traffic. Beaconing can request commands, provide status, download additional malware, or perform other actions. Since beaconing is often encrypted and blends in with other web traffic, it can be difficult to identify, but detecting beaconing behavior is a critical part of detecting malware infections.
Detection of beaconing behavior is often handled by using an IDS or IPS with detection rules that identify known botnet controllers or botnet-specific behavior. In addition, using flow analysis or other traffic-monitoring tools to ensure that systems are not sending unexpected traffic that could be beaconing is also possible. This means that inspecting outbound traffic to ensure that infected systems are not resident in your network is as important as controls that handle inbound traffic.
Figure 12.5 shows simulated beaconing behavior, with a host reaching out to a remote site via HTTP every 10 seconds. This type of repeated behavior can be difficult to find when it is slow, but automated analysis can help to identify it. Using a tool like Wireshark to directly capture the traffic, as shown in the figure, can be useful for detailed analysis, but flows and IDSs and IPSs are more useful for a broader view of network traffic.
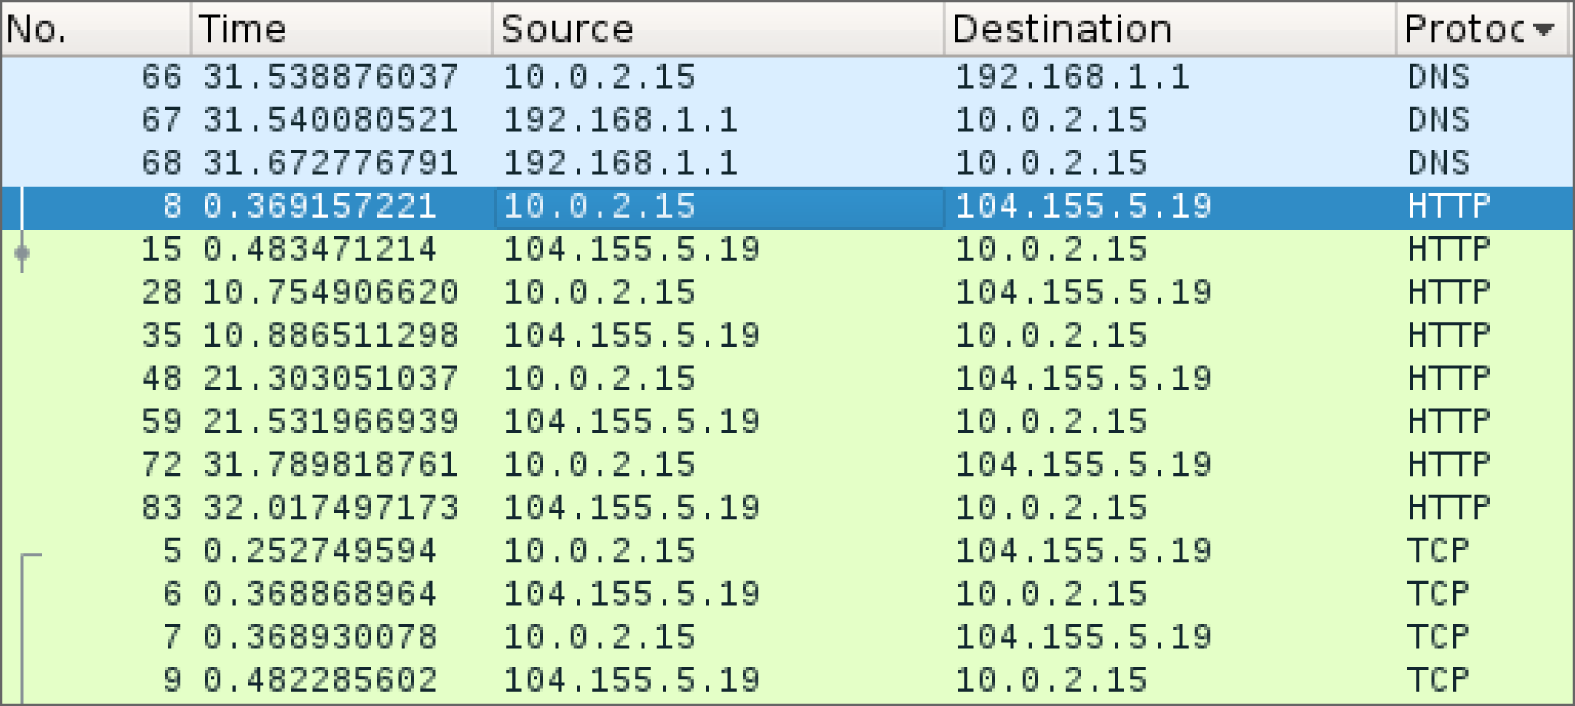
FIGURE 12.5 Beaconing in Wireshark
Unexpected Traffic
Unexpected traffic on a network can take many forms: scans and probes, irregular peer-to-peer traffic between systems that aren't expected to communicate directly, spikes in network traffic, or more direct attack traffic. Unexpected traffic can be detected by behavior-based detection capabilities built into IDSs and IPSs, by traffic-monitoring systems, or manually by observing traffic between systems. Understanding what traffic is expected and what traffic is unexpected relies on three major techniques:
- Baselines, or anomaly-based detection, which requires knowledge of what normal traffic is. Baselines are typically gathered during normal network operations. Once baseline data is gathered, monitoring systems can be set to alarm when the baselines are exceeded by a given threshold or when network behavior deviates from the baseline behaviors that were documented.
- Heuristics, or behavior-based detection, using network security devices and defined rules for scans, sweeps, attack traffic, and other network issues.
- Protocol analysis, which uses a protocol analyzer to capture packets and check for problems. Protocol analyzers can help find unexpected traffic, like VPN traffic in a network where no VPN traffic is expected, or IPv6 tunnels running from a production IPv4 network. They can also help identify when common protocols are being sent over an uncommon port, possibly indicating an attacker setting up an alternate service port.
Not all unexpected traffic is malicious, but it is important to ensure that you have appropriate systems and methods in place to detect anomalies and unexpected behaviors and that you can identify when unexpected traffic is occurring so that you can respond appropriately.
Figure 12.6 shows an IDS detection based on unexpected traffic between a local host (Iodine) and a system in Russia. This detection was flagged as a potential malware download based on its behavior.

FIGURE 12.6 Unexpected network traffic shown in flows
Detecting Scans and Probes
Scans, sweeps, and probes are typically not significant threats to infrastructure by themselves, but they are often a precursor to more focused attacks. Detecting scans and probes is often quite simple: network scans are often easily detectable due to the behaviors they include, such as sequential testing of service ports, connecting to many IP addresses in a network, and repeated requests to services that may not be active. More stealthy scans and probes can be harder to detect among the general noise of a network, and detecting stealthy scans from multiple remote systems on a system connected to the Internet can be quite challenging.
Fortunately, most IDSs and IPSs, as well as other network security devices like firewalls and network security appliances, have built-in scan detection capabilities. Enabling these can result in a lot of noise, and in many cases there is little you can do about a scan. Many organizations choose to feed their scan detection data to a security information management tool to combine with data from attacks and other events, rather than responding to the scans and probes directly.
Detecting Denial-of-Service and Distributed Denial-of-Service Attacks
Denial-of-service (DoS) attacks can take many forms, but the goal remains the same: preventing access to a system or service. They can be conducted from a single system, or from many systems as part of a distributed denial-of-service (DDoS) attack. Detecting and preventing DoS attacks is an increasingly important part of a cybersecurity analyst's skillset.
DoS Attacks
DoS attacks typically include one or more of the following patterns of attack:
- Attempts to overwhelm a network or service through the sheer volume of requests or traffic
- Attacks on a specific service or system vulnerability to cause the system or service to fail
- Attacks on an intermediary system or network to prevent traffic from making it between two locations
Each of these types of attacks requires slightly different methods of detection. This means that your network, system, and service monitoring capabilities need to be set up to monitor for multiple types of attacks depending on which might target your infrastructure.
A DoS attack from a single system or network can typically be stopped by blocking that system or network using a firewall or other network security device. IPSs can also block known attack traffic, preventing a DoS attack from occurring. Single-system DoS attacks are not as likely as DDoS attacks unless the target suffers from a specific service or application vulnerability, or the target can be easily overwhelmed by a single remote system due to limited bandwidth or other resources.
Distributed Denial-of-Service Attacks
Distributed denial-of-service (DDoS) attacks come from many systems or networks at the same time. They can be harder to detect due to the traffic coming from many places, and that also makes them much harder to stop. Many DDoS attacks are composed of compromised systems in botnets, allowing attackers to send traffic from hundreds or thousands of systems.
Detecting DoS and DDoS Attacks
Since there are many flavors of DoS and DDoS attacks, building an effective DoS and DDoS detection capability usually involves multiple types of tools and monitoring systems. These often include the following:
- Performance monitoring using service performance monitoring tools
- Connection monitoring using local system or application logs
- Network bandwidth or system bandwidth monitoring
- Dedicated tools like IDS or IPSs with DoS and DDoS detection rules enabled
During incident response, the same command-line tools that you can use to analyze network traffic (like netstat) can help with troubleshooting on local servers, but a view from the network or service perspective will typically provide a broader view of the issue.
Detecting Other Network Attacks
Other network-based attacks can be detected using the same techniques outlined earlier:
- Use an IDS or IPS
- Monitor flows, SNMP, and other network information for suspect behaviors
- Feed logs from firewalls, routers, switches, and other network devices to a central log analysis and monitoring system
- Use a SIEM device to review and automatically alarm them about problem traffic
Detecting and Finding Rogue Devices
Rogue devices are devices that are connected to a network that should not be, either by policy or because they have been added by an attacker. Finding rogue devices can be challenging—many networks have hundreds or thousands of devices, and device management may not be consistent across the network.
There are a number of common methods for identifying rogue devices:
- Valid MAC Address Checking Uses MAC address information provided to network devices to validate the hardware address presented by the device to a list of known devices.
- MAC Address Vendor Information Checking Vendors of network equipment use a vendor prefix for their devices. This means that many devices can be identified based on their manufacturer.
- Network Scanning Performed using a tool like nmap to identify new devices.
- Site Surveys Involve physically reviewing the devices at a site either by manual verification or by checking wireless networks on-site.
- Traffic Analysis Used to identify irregular or unexpected behavior.
Wired and wireless networks face slightly different threats from rogue devices, and you need to be aware of those differences when responding to potential incidents.
Wired Rogues
Most wired rogues rely on open or unauthenticated networks to connect. Open networks without access controls like port security, which checks for trusted MAC addresses, or network access control (NAC) technology are easy targets for wired rogue devices. A wired rogue device typically means that one of two likely scenarios has occurred:
- An employee or other trusted member of the organization has connected a device, either without permission or without following the process required to connect a device.
- An attacker has connected a device to the network.
The first scenario may be a simple mistake, but the second implies that an attacker has had physical access to your network! In either case, rogue devices connected to a wired network should be responded to quickly so that they can be removed or otherwise handled appropriately.
Wireless Rogues
Wireless rogues can create additional challenges because they can't always easily be tracked to a specific physical location. That means that tracking down a rogue may involve using signal strength measures and mapping the area where the rogue is to attempt to locate it. Fortunately, if the wireless rogue is plugged into your network, using a port scan with operating system identification turned on can often help locate the device. In Figure 12.7, a common consumer router was scanned after it was connected to a network. In this example, nmap cannot immediately identify the device, but it is obvious that it is not a typical desktop system since it shows the router as potentially being a VoIP phone, firewall, or other embedded device.

FIGURE 12.7 nmap scan of a potential rogue system
Investigating Host-Related Issues
Security issues for servers and workstations can be challenging to identify. Modern malware is extremely good at remaining hidden. Fortunately, system monitoring tools can help identify unexpected behaviors by checking for host-related issues. That means system monitoring is useful for both security and day-to-day system health purposes.
System Resources
The most basic monitoring for most servers and workstations is resource monitoring. Utilization information for system resources like CPU, memory, disk, and network can provide valuable details about the state of the system, its workloads, and whether a problem exists.
Processor Monitoring
Understanding what processes are consuming CPU time, how much CPU utilization is occurring, and when the processes are running can be useful for incident detection and response. Sudden spikes, or increased processor consumption in CPU usage on a system with otherwise consistent usage levels, may indicate new software or a process that was not previously active. Consistently high levels of CPU usage can also point to a DoS condition. Used alone, CPU load information typically will not tell the whole story, but it should be part of your monitoring efforts.
Memory Monitoring
Most operating system level memory monitoring is focused on memory utilization or memory consumption, rather than what is being stored in memory. That means your visibility into memory usage is likely to focus on consumption and process identification. Most protective measures for memory-based attacks occur as part of an operating system's built-in memory management or when code is compiled.
Most organizations set memory monitoring levels for alarms and notification based on typical system memory usage and an “emergency” level when a system or application is approaching an out-of-memory condition. This can be identified by tracking memory usage during normal and peak usage and then setting monitoring thresholds, or levels where alarms or alerts will occur, based on that data.
Memory Leaks
Memory leaks are a frequent culprit in system crashes and outages. A memory leak occurs when a program doesn't release memory after it is no longer needed. Over time, an application with a memory leak will consume more and more memory until the application fails or the operating system runs out of available memory. This can cause an application or system crash.
Memory monitoring can help prevent memory leaks from resulting in a crash by sounding the alarm when memory utilization increases, but it can't stop a memory leak. If there is no patch for the issue, the only recourse for an application or service with a memory leak is to periodically restart the service or the system it runs on.
Drive Capacity Monitoring
Drive capacity monitoring typically focuses on specific capacity levels and is intended to prevent the drive or volume from filling up, causing an outage. Tools to monitor drive capacity consumption are available for all major operating systems, as well as centralized monitoring and management systems like System Center Operations Manager (SCOM) for Windows or Nagios for Linux. Microsoft Endpoint Configuration Manager can also provide information about disk usage, but it is not a real-time reporting mechanism. Disk monitoring in real time can help prevent outages and issues more easily than a daily report since disks can fill up quickly.
Filesystem Changes and Anomalies
Monitoring in real time for filesystem changes can help to catch attacks as they are occurring. Tools like the open source Wazuh security platform provide file integrity monitoring that keeps an eye on files, permissions, ownership, and file attributes and then sends alerts based on that monitoring.
Open source tools like Tripwire (Tripwire is available as both a commercial and an open source tool) and Advanced Intrusion Detection Environment (AIDE) as well as a wide variety of commercial products offer this type of functionality. The trade-off for most products is noise level due to filesystem changes that are part of normal operations versus catching unexpected changes.
Manual verification of files using known good checksums is also part of many incident responders practice. Sites like the National Software Reference Library (NSRL) collect digital signatures to allow verification against known checksums: www.nist.gov/itl/ssd/software-quality-group/national-software-reference-library-nsrl.
System Resource Monitoring Tools
Windows provides built-in resource and performance monitoring tools. Resource Monitor, or resmon, is the Windows resource monitor and provides easy visibility into the CPU, memory, disk, and network utilization for a system. In addition to utilization, its network monitoring capability shows processes with network activity, which TCP connections are open, and what services are associated with open ports on the system. Figure 12.8 shows the Resource Monitor overview screen for a sample Windows 10 system.
Performance Monitor, or perfmon, provides much more detailed data, with counters ranging from energy usage to disk and network activity. It also supports collection from remote systems, allowing a broader view of system activity. For detailed data collection, perfmon is a better solution, whereas resmon is useful for checking the basic usage measures for a machine quickly. Figure 12.9 shows perfmon configured with a disk and processor monitor. This data can be combined into user- or system-defined reports.
The Sysinternals suite for Windows provides extensive monitoring capabilities beyond the built-in set of tools. You can download the Sysinternals tools at technet.microsoft.com/en-us/sysinternals/, or you can run them live at the Windows command prompt or from File Explorer by entering https://live.sysinternals.com/toolname, replacing toolname with the name of the tool you want to use.

FIGURE 12.8 The Windows Resource Monitor view of system resources
Linux has a number of built-in tools that can be used to check CPU, disk, and memory usage. They include the following:
psprovides information about CPU and memory utilization, the time that a process was started, and how long it has run, as well as the command that started each process.topprovides CPU utilization under CPU stats and also shows memory usage as well as other details about running processes.topalso provides interaction via hotkeys, including allowing quick identification oftopconsumers by enteringA.dfdisplays a report of the system's disk usage, with various flags providing additional detail or formatting.windicates which accounts are logged in. Although this isn't directly resource related, it can be useful when determining who may be running a process.

FIGURE 12.9 The Windows Performance Monitor view of system usage
Many other Linux tools are available, including graphical tools; however, almost all Linux distributions will include ps, top, and df, making them a good starting point when checking the state of a system.
Malware, Malicious Processes, and Unauthorized Software
Unauthorized software and malware is a major cause of system issues. Software issues can range from application and driver incompatibilities to unauthorized software that sends network traffic, resulting in issues for other systems on the network.
Detecting malware, malicious processes, and unauthorized software typically relies on one of four major methods:
- Central management tools like Microsoft Endpoint Configuration Manager, which can manage software installation and report on installed software.
- Antivirus and antimalware tools, which are designed to detect potentially harmful software and files.
- Software and file blacklisting, which uses a list of disallowed software and files and prohibits its installation. This differs from antivirus and antimalware by potentially providing a broader list of prohibited files than only malicious or similar files.
- Application whitelisting, which allows only permitted files and applications on a system. In a fully whitelisted environment, no files that are not previously permitted are allowed on a system.
Most managed environments will use more than one of these techniques to manage the software and applications that are present on workstations, servers, and mobile devices.
Abnormal OS Process Behavior
Abnormal behavior observed in operating system processes can be an indicator of a rootkit or other malware that has exploited an operating system component. For Windows systems, a handful of built-in tools are most commonly associated with attacks like these, including cmd.exe, at.exe and schtasks.exe, wmic.exe, powershell.exe, net.exe, reg.exe, and sc.exe, and similar useful tools.
Tools like Metasploit have built-in capabilities to inject attack tools into running legitimate processes. Finding these processes requires tools that can observe the modified behavior or check the running process against known good process fingerprints.
Another common technique is to name rogue processes with similar names to legitimate operating system components or applications, or use DLL execution via rundll32.exe to run as services via svchost.
Unauthorized Access, Changes, and Privileges
Unauthorized access to systems and devices, as well as use of privileges that result in unexpected changes, are a major cause for alarm. Unfortunately, the number and variety of systems, as well as the complexity of the user and permissions models in use in many organizations, can make monitoring for unauthorized activity challenging.
The good news is that monitoring for unauthorized access, changes, and privileges uses many of the same set of techniques and technologies we have already discussed. Table 12.1 lists some of the possible methods for detection for each of these types of unauthorized use.
TABLE 12.1 Unauthorized use and detection mechanisms
| Unauthorized use type | Data logged | Location of data | Analysis tools |
| Unauthorized access | Authentication User creation |
Authentication logs User creation logs |
Central management suite SIM/SIEM |
| Unauthorized changes | File creation Settings changes |
System logs Application logs Monitoring tools |
Central management suite SIM/SIEM File and directory integrity checking tools (Tripwire) |
| Unauthorized privilege use | Privilege use attempts Privilege escalation |
Security event logs Application logs |
SIM/SIEM Log analysis tools |
Unauthorized privileges can be harder to track, particularly if they are not centrally managed and audited. Fortunately, tools like Sysinternals's AccessChk can help by validating the access that a specific user or group has to objects like files, registry keys, and services. On the other hand, while the audit system in Linux can help detect uses of privileges, checking for specific permissions will typically require you to write a script to check the specific privileges you are concerned about.
Registry Changes or Anomalies
The Windows registry is a favorite location for attackers who want to maintain access to Windows systems. Using run keys, the Windows Startup folder, and similar techniques is a common persistence technique.
Registry run keys can be found in
HKEY_LOCAL_MACHINESoftwareMicrosoftWindowsCurrentVersionRunHKEY_CURRENT_USERSoftwareMicrosoftWindowsCurrentVersionRunHKEY_LOCAL_MACHINESoftwareMicrosoftWindowsCurrentVersionRunOnceHKEY_CURRENT_USERSoftwareMicrosoftWindowsCurrentVersionRunOnce
That means that monitoring the Windows registry for changes can be an important part of incident response. For systems with infrequent changes like servers, protecting the registry can be relatively easily done through the use of application whitelisting. In cases where registry monitoring tools are not an option, lockdown tools can be used that prohibit registry changes. When changes are required, the tools can be turned off or set into a mode that allows changes during patching windows, and then turned back on for daily operations. For workstations where changes may be made more frequently, more in-depth control choices like an agent-based tool may be required to prevent massive numbers of false positives.
Unauthorized Scheduled Tasks
Scheduled tasks, or cron jobs in Linux, are also a popular method for attackers to maintain persistent access to systems. Checking for unexpected scheduled tasks (or cron jobs) is a common part of incident response processes.
To check scheduled tasks in Windows, you can access the Task Scheduler via Start ➢ Windows Administrative Tools ➢ Task Scheduler. Figure 12.10 shows the detail you can access via the graphical Task Scheduler interface, including when the task ran, when it was created, and other information.

FIGURE 12.10 The Windows Task Scheduler showing scheduled tasks and creation times
You can detect unexpected scheduled tasks in Linux by checking cron. You can check crontab itself by using cat /etc/crontab, but you may also want to check /etc/cron for anything stashed there. Listing cron jobs is easy as well; use the crontab -l command to do so. You should pay particular attention to jobs running as root or equivalent users, and using the -u root flag in your crontab list command will do that.
Investigating Service and Application-Related Issues
Investigating application and service issues requires information about what services and applications are running, how they are expected to behave, as well as self-reported and system-reported information about the services. In many organizations, active service monitoring will also be used to determine if the service is working properly.
Application- and service-related events like incorrect behavior, unexpected log messages or errors, new users or processes, and file changes are all common signs of a possibly compromised service. Fortunately, many of the tools you need to investigate these problems are already built into Windows and Linux systems.
Application and Service Monitoring
Monitoring applications and services is critical to an organization's operations and can also provide important security insight by showing where unexpected behavior is occurring or where applications and services are being abused.
Application and service monitoring can be categorized into a few common monitoring areas:
- Up/down—is the service running?
- Performance—does it respond quickly and as expected?
- Transactional logging—information about the function of the service is captured, such as what actions users take or what actions are performed.
- Application or service logging—logs about the function or status of the service.
Each of these areas provides part of the puzzle for visibility into an application's or service's status, performance, and behavior. During an investigation, you will often need to identify behavior that does not match what the service typically logs.
Application Logs
Application logs can provide a treasure trove of information, but they also require knowledge of what the application's log format is and what those logs will contain. While many Linux logs end up in /var/log, Windows application logs can end up gathered by the Windows logging infrastructure or in an application specific directory or file.
Part of a security professional's work is to ensure that appropriate logging is set up before an incident occurs so that logs will be available and will be protected from modification or deletion by an attacker. Sending critical application logs to a central log collection and/or analysis service is a common part of that strategy.
Application and Service Anomaly Detection
Anomalous activity from services and applications can be relatively common. A variety of non-security-related problems can result in issues, such as
- Application or service-specific errors, including authentication errors, service dependency issues, and permissions issues
- Applications or services that don't start on boot, either because of a specific error or, in the case of services, because the service is disabled
- Service failures, which are often caused by updates, patches, or other changes
Service and application failure troubleshooting typically starts with an attempt to start, or restart, the service. If that is not successful, a review of the service's log message or error messages can provide the information needed to resolve the problem.
Anomalies in services and applications due to security issues may be able to be detected using the same monitoring techniques; however, additional tools can be useful to ensure that the service and its constituent files and applications are not compromised. In addition to common service and log monitoring tools, you might choose to deploy additional protection such as the following:
- Antimalware and antivirus tools
- File integrity checking tools
- Whitelisting tools
Windows Service Status
Windows service status can be checked either via the Services administrative tool (services.msc) or by using command-line tools like sc, the Service Controller application, which accepts command-line flags that set the start type for service, specify the error level it should set if it fails during boot, and provide details of the service. PowerShell also provides service interaction scriptlets like Start-Service to interact with services on local and remote Windows hosts.
Linux Service Status
Linux services can be checked on most systems by using the service command. service [servicename] status will return the status of many, but not all, Linux services. You can try the command to list the state of all services by running
service –-status-allLinux systems that use init.d can be checked by running a command like
/etc/init.d/servicename statusLinux service restart processes vary depending on the distribution. Check your distribution to verify how it expects services to be restarted.
Application Error Monitoring
Most Windows applications log to the Windows Application log (although some maintain their own dedicated log files as well). To check for application errors, you can view the Application log via the Windows Event Viewer. You can also centralize these logs using SCOM.
Many Linux applications provide useful details in the /var/log directory or in a specific application log location. Using the tail command, these logs can be monitored while the application is tested. Much like Windows, some Linux applications store their files in an application-specific location, so you may have to check the application's documentation to track down all the data the application provides.
Application Behavior Analysis
Applications that have been compromised or that have been successfully attacked can suddenly start to behave in ways that aren't typical: outbound communications may occur, the application may make database or other resource requests that are not typically part of its behavior, or new files or user accounts may be created. Understanding typical application behavior requires a combination of
- Documentation of the application's normal behavior, such as what systems it should connect to and how those connections should be made
- Logging, to provide a view of normal operations
- Heuristic (behavioral) analysis using antimalware tools and other security-monitoring systems to flag when behaviors deviate from the norm
Application and Service Issue Response and Restoration
There are many reasons that applications and services encounter issues, ranging from incorrect credentials or rights, bad patches, and component versions to software flaws and actual attacks. Detecting issues with applications relies on many of the same techniques used for network and system issues, with the addition of application-specific monitoring tools and service-monitoring software.
When an application or service encounters an issue, it will often report an error. That means it is possible to handle errors and exceptions automatically by creating scripts or automated service restarts when the error is thrown.
Application monitoring services can also be scripted to take action when a service or server is offline. This requires that the monitoring system have rights to restart the appropriate system or service, and if the monitoring system is not correct about the outage, it can disrupt service. Automated responses should be carefully tested to ensure that they do not cause disruption rather than fix it.
Detecting Attacks on Applications
Attacks on applications can take a number of forms, ranging from web application attacks to malware that targets executable files. Focusing on the behaviors that indicate attacks can be one of the most important tools in your arsenal. Detecting the behaviors listed here as they happen, or before they result from an attack, is preferable, but being able to perform an analysis of why they have happened is often necessary too.
- Anomalous activity, or activity that does not match the application's typical behavior, is often the first indicator of an attack or compromise. Log analysis, behavior baselines, and filesystem integrity checking can all help detect unexpected behavior. User and administrator awareness training can also help make sure you hear about applications that are behaving in abnormal ways.
- Introduction of new accounts, particularly those with administrative rights, are often a sign of compromise. Application account creation is not always logged in a central location, making it important to find ways to track both account creation and privileges granted to accounts. Administrative controls that match a change management workflow and approvals to administrative account creation, paired with technical controls, can provide a stronger line of defense.
- Unexpected output can take many forms, from improper output or garbled data to errors and other signs of an underlying application issue. Unexpected output can also be challenging to detect using centralized methods for user-level applications. Server-based applications that provide file- or API-level output are often easier to check for errors based on validity checkers (if they exist!). This is another type of application error where user and administrator training can help identify problems.
- Unexpected outbound communication, like beaconing, outbound file transfers, and attacks, are common types of application exploit indicators. Using network monitoring software as well as a capable and well-tuned intrusion detection or prevention system monitoring outbound traffic is critical to detecting these problems.
- Service interruption can indicate a simple application problem that requires a service or server restart but can also indicate a security issue like a DoS attack or a compromised application. Monitoring tools should monitor application or service status as well as user experience to capture both views of how a service is working.
- Memory overflows may result in operating system errors and crashes, making crash dump reporting important. Monitoring for memory overflow errors can be a challenge due to limitations in memory handling for operating systems and applications, so your first warning may be an application crash or system reboot. Logging reboots and service restarts can help but may not detect a properly executed attack.
Summary
Incident response requires visibility into networks, systems, services, and applications. Gathering and centralizing information from each component of your organization's infrastructure and systems can allow you to more easily detect, respond to, or even prevent incidents. The same information can also help you detect indicators of compromise early, potentially allowing you to stop intrusions before they become significant breaches.
Network monitoring is often done via router-based monitoring, which relies on network flows, SNMP, and RMON, all common means of gathering information. Flows provide summary data about traffic, protocols, and endpoints; SNMP is used to gather device information; and RMON uses probes to gather statistical, historical, and event-based data. In addition, organizations employ active monitoring using ping and performance monitoring tools like iPerf to gather data by sending traffic. Passive monitoring relies on capturing information about the network and its performance as traffic travels through network devices. Passive monitoring doesn't add traffic to the network and acts after the fact, rather than providing real-time information, making it more useful for analysis than prevention of issues.
Network monitoring tools like PRTG, SolarWinds, and Cacti centralize multiple types of network data and provide both central visibility and detailed drill-down analysis capabilities. They are important to incident response and event management because they allow both easy visibility and the ability to look at data from multiple data sources in a single place, potentially allowing you to detect problems like link failure, beaconing, and unexpected traffic identified more easily. Attacks and probes can be detected using monitoring tools and sometimes may be identified and then prevented by network security devices.
Monitoring hosts requires visibility into resources, applications, and logs. Host resource monitoring typically focuses on processor, memory, and disk utilization, whereas applications are often managed using central management tools like Microsoft Endpoint Configuration Manager. Log monitoring relies on an understanding of what is logged and which issues are important to review.
Service and application issues are often detected by monitoring for service anomalies like errors, failures, or changes in service behavior. Security professionals look for anomalous activity, new and unexpected account creation, unexpected outputs or outbound communication, service interruptions, and memory overflow issues.
Exam Essentials
Know how network incidents start. Understanding how network bandwidth is consumed is an important part of detecting and analyzing events. Flows, SNMP, active, and passive monitoring all provide a view of network health and usage. Network monitoring tools like PRTG, Nagios, Cacti, and SolarWinds help to make large volumes of data from diverse devices accessible and centrally visible. Common network issues include bandwidth consumption, link failure, beaconing, and unexpected traffic.
Explain why network attacks and probes require specific responses. Scans and probes can be difficult to detect but can indicate interest by attackers or security issues that allow them to succeed. Denial-of-service attacks can be detected and techniques exist to limit their impact, including network security devices and DDoS mitigation services. Rogue devices, or devices that are not expected to be on a network, can be either wired or wireless. Wired rogues can be limited by using network admission technology, whereas wireless rogues require a monitoring and detection plan.
Be able to describe some host issues and how to detect them. Monitoring system resource usage, including CPU, memory, and disk space, can help to identify host issues. Monitoring tools like resmon and perfmon for Windows and ps, top, df, and w for Linux provide insight into the current state of a system's resources. Unauthorized software and malware can be detected by purpose-designed tools or can be controlled using whitelists, blacklists, and central management tools like Microsoft Endpoint Configuration Manager. Unauthorized access, changes, and privilege use can indicate a compromise, intentional, or inadvertent misuse. System and application logs as well as file integrity monitoring applications can help to catch issues as they occur or with investigation after the fact.
Name some causes of service and application issues and how to detect them. Monitoring applications relies on active monitoring of the application or service status, logging, and behavior analysis. Service anomalies can be detected by checking for errors or active monitoring but may not provide a direct indication of security issues. Successful attacks on applications are often indicated by new accounts, unexpected communications or output, service interruptions, or other anomalous activity.
Lab Exercises
Activity 12.1: Identify a Network Scan
In this lab you will use Wireshark to identify a network scan of a Linux system.
Part 1: Boot a Kali Linux system and a target system and set up the exercise.
- Start your Kali Linux virtual machine and the Metasploitable virtual machine; log into both.
- Open a terminal window and Wireshark on the Kali Linux system (Wireshark can be found in the Applications menu under option 09 Sniffing & Spoofing).
- Determine the IP address of the target system. From the command prompt on the Metasploitable system, enter
ifconfig -aand record its IP address. - Start the Wireshark capture. Select the eth0 interface and then choose Capture ➢ Start.
Part 2: Perform a network scan and visit the web server.
- From the terminal, execute the following command:
nmap -p 1-65535 [ip address of the Metasploitable machine]. - Record one of the ports listed as open.
- Start the IceWeasel browser in Kali and navigate to the IP address of the Metasploitable system.
Part 3: Identify scan traffic.
- Stop the Wireshark capture. Click the red square stop button at the top left of the Wireshark screen.
- Review the traffic you captured. Search for the port you found by entering
tcp.port==[port you identified]in the Filter box. - What traffic was sent? If you rerun this scan with other TCP connection options like
-sSor-ST, does this change? - Review traffic for port 80. You should see both the scan and a visit from the Kali Linux web browser. How do these differ?
Activity 12.2: Write a Service Issue Response Plan
Write an identification and response plan for services that an organization you are familiar with relies on. Your response plan should presume that a service issue or outage has been reported but that the cause is not known. Ensure that you cover key elements discussed in this chapter, including
- How you would identify potential issues using the application and system logs
- How you would monitor the service for problems
- What types of issues you would look for
- What the organization's response should be
Once you have completed your plan, walk through it using an example issue. Ensure that your plan would address the issue and that you would be able to provide a complete report to your organization's management about the issue.
Activity 12.3: Security Tools
Match each of the following tools to the correct description.
| Flows | A Linux command that displays processes, memory utilization, and other details about running programs |
| Resmon | Traffic sent to a command and control system by a PC that is part of a botnet |
| iPerf | A Windows tool that monitors memory, CPU, and disk usage |
| PRTG | A protocol for collecting information like status and performance about devices on a network |
| Beaconing | A set of packets passing from a source system to a destination in a given time interval |
| SNMP | A network management and monitoring tool that provides central visibility into flows and SNMP data for an entire network |
top |
A Windows tool that monitors a wide range of devices and services, including energy, USB, and disk usage |
| Perfmon | A tool for testing the maximum available bandwidth for a network |
Review Questions
- Which of the following Linux commands will show you how much disk space is in use?
topdflsofps
- What Windows tool provides detailed information including information about USB host controllers, memory usage, and disk transfers?
- statmon
- resmon
- perfmon
- winmon
- What type of network information should you capture to be able to provide a report about how much traffic systems in your network sent to remote systems?
- Syslog data
- WMI data
- Resmon data
- Flow data
- Which of the following technologies is best suited to prevent wired rogue devices from connecting to a network?
- NAC
- PRTG
- Port security
- NTP
- As part of her job, Danielle sets an alarm to notify her team via email if her Windows server uses 80 percent of its memory and to send a text message if it reaches 90 percent utilization. What is this setting called?
- A monitoring threshold
- A preset notification level
- Page monitoring
- Perfmon calibration
- Chris wants to use an active monitoring approach to test his network. Which of the following techniques is appropriate?
- Collecting NetFlow data
- Using a protocol analyzer
- Pinging remote systems
- Enabling SNMP
- What term describes a system sending heartbeat traffic to a botnet command and control server?
- Beaconing
- Zombie ping
- CNCstatus
- CNClog
- Cameron wants to be able to detect a denial-of-service attack against his web server. Which of the following tools should he avoid?
- Log analysis
- Flow monitoring
- iPerf
- IPS
- What can the MAC address of a rogue device tell you?
- Its operating system version
- The TTL of the device
- What type of rogue it is
- The manufacturer of the device
- How can Jim most effectively locate a wireless rogue access point that is causing complaints from employees in his building?
- Nmap
- Signal strength and triangulation
- Connecting to the rogue AP
- NAC
- Which of the following tools does not provide real-time drive capacity monitoring for Windows?
- Microsoft Endpoint Configuration Manager
- Resmon
- SCOM
- Perfmon
- What three options are most likely to be used to handle a memory leak?
- Memory management, patching, and buffer overflow prevention
- Patching, service restarts, and system reboots
- Service restarts, memory monitoring, and stack smashing prevention
- System reboots, memory management, and logging
- Sayed is planning to prohibit a variety of files, including games, from being installed on the Windows workstations he manages. What technology is his best option to prevent known, unwanted files from being installed or copied to machines?
- Blacklisting
- Microsoft Endpoint Configuration Manager
- SCOM
- Whitelisting
- While Susan is monitoring a router via network flows, she sees a sudden drop in network traffic levels to zero, and the traffic chart shows a flat line. What has likely happened?
- The sampling rate is set incorrectly.
- The router is using SNMP.
- The monitored link failed.
- A DDoS attack is occurring.
- What are SNMP alert messages called?
- SNMP launches
- SNMP traps
- SNMP bolts
- SNMP packets
- Which of the following options is not a valid way to check the status of a service in Windows?
- Use
scat the command line - Use
service ––statusat the command line - Use
services.msc - Query service status via PowerShell
- Use
- Avik has been asked to identify unexpected traffic on her organization's network. Which of the following is not a technique she should use?
- Protocol analysis
- Heuristics
- Baselining
- Beaconing
- Sofia suspects that a system in her datacenter may be sending beaconing traffic to a remote system. Which of the following is not a useful tool to help verify her suspicions?
- Flows
- A protocol analyzer
- SNMP
- An IDS or IPS
- Alex wants to prohibit software that is not expressly allowed by his organization's desktop management team from being installed on workstations. What type of tool should he use?
- Whitelisting
- Heuristic
- Blacklisting
- Signature comparison
- Juan wants to see a list of processes along with their CPU utilization in an interactive format. What built-in Linux tool should he use?
dftoptailcpugrep