
Chapter 9. Monitoring
This chapter is about using a variety of tools to monitor and understand important events in the life cycle of your Cassandra cluster. We’ll look at some simple ways to see what’s going on, such as changing the logging levels and understanding the output.
But Cassandra also features built-in support for Java Management Extensions (JMX), which offers a rich way to monitor your Cassandra nodes and their underlying Java environment. With just a little integration work, we can see the health of the database and ongoing events, and even interact with it remotely to tune certain values. JMX is an important part of Cassandra, and we’ll spend some time to make sure we know how it works and what exactly Cassandra makes available for monitoring and management with JMX, and we’ll even write our own custom MBean to expose a new Cassandra feature. Let’s get started!
Logging
The simplest way to get a picture of what’s happening in your database is to just change the logging level to make the output more verbose. This is great for development and for learning what Cassandra is doing under the hood.
Cassandra uses Log4J for its logging utility. By default, the
Cassandra server log level is set at INFO, which doesn’t give
you much detail about what work Cassandra is doing at any given time. It
just outputs basic status updates, such as the following:
 INFO 08:49:17,614 Saved Token found: 94408749511599155261361719888434486550
 INFO 08:49:17,614 Saved ClusterName found: Test Cluster
 INFO 08:49:17,620 Starting up server gossip
 INFO 08:49:17,655 Binding thrift service to morpheus/192.168.1.5:9160
 INFO 08:49:17,659 Cassandra starting up...
When you start Cassandra in a terminal, you keep this output running
in the terminal window by passing the program the -f flag (to
keep output visible in the foreground of the terminal window). But
Cassandra is also writing these logs to physical files for you to examine
later.
By changing the logging level to DEBUG, we can see much
more clearly what activity the server is working on, instead of seeing
only these stage updates.
To change the logging level, open the file <cassandra-home>/conf/log4j-server.properties and find the line that looks like this:
log4j.rootLogger=INFO,stdout,R
Change this line so it looks like this:
log4j.rootLogger=DEBUG,stdout,RNote
Of course, in production you’ll want to tune the logging level
back up to WARN or ERROR, as the verbose
output will slow things down considerably.
Now we can see a lot more activity as Cassandra does its work:
 INFO 09:41:54,936 Completed flushing /var/lib/cassandra/data/system/
LocationInfo-8-Data.db
DEBUG 09:41:54,942 Checking to see if compaction of LocationInfo would be useful
DEBUG 09:41:54,942 discard completed log segments for CommitLogContext(file='/var/
lib/cassandra/commitlog/CommitLog-1277397714697.log',...
 INFO 09:41:54,943 Compacting [org.apache.cassandra.io.SSTableReader(path='/var/
lib/cassandra
DEBUG 09:41:54,943 Marking replay position 121 on commit log CommitLogSegment(/var/
lib/cassandra/commitlog/CommitLog-1277397714697.log)...
DEBUG 09:41:54,943 index size for bloom filter calc for file
  : /var/lib/cassandra/data/system/LocationInfo-5-Data.db   : 256
DEBUG 09:41:54,944 index size for bloom filter calc for file
  : /var/lib/cassandra/data/system/LocationInfo-6-Data.db   : 512
DEBUG 09:41:54,944 index size for bloom filter calc for file
  : /var/lib/cassandra/data/system/LocationInfo-7-Data.db   : 768
 INFO 09:41:54,985 Log replay complete
 INFO 09:41:55,009 Saved Token found: 94408749511599155261361719888434486550
 INFO 09:41:55,010 Saved ClusterName found: Test Cluster
 INFO 09:41:55,016 Starting up server gossip
 INFO 09:41:55,048 Binding thrift service to morpheus/192.168.1.5:9160
 INFO 09:41:55,051 Cassandra starting up...
DEBUG 09:41:55,112 Marking /var/lib/cassandra/data/system/LocationInfo-5-Data.db
compacted
//...
DEBUG 09:41:55,117 Estimating compactions for Super1
DEBUG 09:41:55,117 Estimating compactions for Standard2
DEBUG 09:41:55,117 Estimating compactions for Super2
DEBUG 09:41:55,118 Estimating compactions for Standard1
DEBUG 09:41:55,118 Estimating compactions for StandardByUUID1
DEBUG 09:41:55,118 Estimating compactions for LocationInfo
DEBUG 09:41:55,118 Estimating compactions for HintsColumnFamily
DEBUG 09:41:55,118 Checking to see if compaction of Super1 would be useful
DEBUG 09:41:55,119 Checking to see if compaction of Standard2 would be useful
DEBUG 09:41:55,119 Checking to see if compaction of Super2 would be useful
//...
DEBUG 09:41:56,023 GC for ParNew: 1 ms, 14643776 reclaimed leaving 80756296 used;
max is 1177812992
DEBUG 09:41:56,035 attempting to connect to lucky/192.168.1.2
DEBUG 09:41:57,025 Disseminating load info ...
This allows you to see exactly what Cassandra is doing and when, which is very helpful in troubleshooting. But it’s also helpful in simply understanding what Cassandra does to maintain itself.
If you want to change the location of the logs directory, just find the following entry in the same log4j.properties file and chose a different filename:
log4j.appender.R.File=/var/log/cassandra/system.log
There’s not a different entry for Windows; on Windows systems this will automatically resolve to C:\varlogcassandrasystem.log.
Note
If you don’t see any logfiles in this location, make sure that you are the owner of the directories, or at least that proper read and write permissions are set. Cassandra won’t tell you if it can’t write the log; it just won’t. Same for the datafiles.
Note that this is the location for the log of the activity of the database, and not for Cassandra’s internal datafiles. Those are stored in /var/lib/cassandra.
Tailing
You don’t need to start Cassandra using the foreground switch in
order to see the rolling log. You
can also simply start it without the -f option and then
tail the logs. Tailing is not specific to Cassandra; it’s a small
program available in Linux distributions to see new values printed to a
console as they are appended to a file.
To tail the logs, start Cassandra like this:
>bin/cassandra
Then open a second console, enter the tail command,
and pass it the location of the particular file you want to tail, like
this:
>tail -f /var/log/cassandra/system.log
The -f option means “follow,” and as Cassandra
outputs information to the physical logfile, tail will
output it to the screen. To stop tailing, just type Ctrl-C.
You can do the same thing if you’re using Windows, but Windows doesn’t include a tail program natively. So to achieve this, you’ll need to download and install Cygwin, which is a Bash shell emulator. Cygwin allows you to have a Linux-style interface and use a variety of Linux tools on Windows. You can get Cygwin for free from http://www.cygwin.com.
Then you can start Cassandra regularly and tail the logfile using this command:
eben@lucky~$ tail -f C:\var\log\cassandra\system.log
This will show the output in the console in the same way as if it were foregrounded.
General Tips
Following along
Once you’re running the server with debug logging enabled, you can see a lot more happening that can help during debugging. For example, here we can see the output when writing and then reading a simple value to the database:
DEBUG 12:55:09,778 insert
DEBUG 12:55:09,779 insert writing local key mycol
DEBUG 12:55:36,387 get
DEBUG 12:55:36,390 weakreadlocal reading SliceByNamesReadCommand(
  table='Keyspace1', key='mycol',
  columnParent='QueryPath(columnFamilyName='Standard1',
  superColumnName='null', columnName='null')',
  columns=[6b6579393939,])
That’s the server output generated by executing this command in the CLI:
cassandra> set Keyspace1.Standard1['mycol']['key999']='value999'
Value inserted.
cassandra> get Keyspace1.Standard1['mycol']['key999']
=> (column=6b6579393939, value=value999, timestamp=1277409309778000
Notice what’s happened here. We’ve inserted a value in the
column family named Standard1. When we perform a
get request, the column key key999 is
translated to 6b6579393939, because the
Standard1 column family is defined as using
BytesType as a CompareWith value.
However, if we use the Standard2 column family,
we’ll see the key column name on the get request as we
typed it because that column family is defined as using a
CompareWith of UTF-8. So again we’ll do a
set and then a get request for the same
value. The CLI output is shown here:
cassandra> set Keyspace1.Standard2['mycol']['key888']='value888'
Value inserted.
cassandra> get Keyspace1.Standard2['mycol']['key888']
=> (column=key888, value=value888, timestamp=1277409950795000)
The server log records this query as follows:
DEBUG 13:06:03,291 get
DEBUG 13:06:03,292 weakreadlocal reading SliceByNamesReadCommand(
  table='Keyspace1', key='mycol',
  columnParent='QueryPath(columnFamilyName='Standard2',
  superColumnName='null', columnName='null')',
  columns=[key888,])
This should give you enough information to follow along with what the server’s doing as you work.
Warning signs
There are a few things to look out for as you run Cassandra. For example, if you see something like this in the logs with no further update, there’s something wrong with the nodes in your ring:
DEBUG 12:39:56,312 attempting to connect to mywinbox/192.168.1.3
It’s OK to attempt to connect, but then it should actually connect. It’s possible for this to happen when you mix Windows and Linux boxes in a Cassandra cluster, which is definitely not recommended. If your Linux and Windows boxes can see each other, share resources such as printers, read and write files between them, view web pages the other is serving, and so forth, this might give you the impression that this should work. Don’t be tempted to mix and match in a production environment.
Overview of JMX and MBeans
In this section, we explore how Cassandra makes use of Java Management Extensions (JMX) to enable remote management of your servers. JMX started as Java Specification Request (JSR) 160 and has been a core part of Java since version 5.0.
Note
You can read more about the JMX implementation in Java by examining the java.lang.management package.
JMX is a Java API that provides management of applications in two key ways. First, JMX allows you to understand your application’s health and overall performance in terms of memory, threads, and CPU usage—things that are generally applicable to any Java application. Second, JMX allows you to work with specific aspects of your application that you have instrumented.
Instrumentation refers to putting a wrapper around application code that provides hooks from the application to the JVM in order to allow the JVM to gather data that external tools can use. Such tools include monitoring agents, data analysis tools, profilers, and more. JMX allows you not only to view such data but also, if the application enables it, to manage your application at runtime by updating values.
JMX is commonly used for a variety of application control operations, including:
Low available memory detection, including the size of each graduation space on the heap
Thread information such as deadlock detection, peak number of threads, and current live threads
Verbose classloader tracing
Log level control
General information such as application uptime and the active classpath
Many popular Java applications are instrumented using JMX, including the JVM itself, HP Open View, Oracle WebLogic Server, the Glassfish application server, and Cassandra. In these applications, JMX is simply one way of managing the container; JBoss Application Server, on the other hand, uses JMX as the primary way of interacting with the container.
For example, the WebLogic server provides a very wide range of activities via JMX. You can, for example, monitor the number of available JDBC connections in a pool or see the number of stateless session beans loaded in the container in a given state. Not only can you monitor these things, but you can use a graphical console that ships with the Sun (now Oracle) JDK to change their values. Want to increase the size of the pool of message-driven beans? A JMX-enabled container could allow you to manage your resources in this way.
A depiction of the JMX architecture is shown in Figure 9-1.

The JMX architecture is simple. The JVM collects information from the underlying operating system. The JVM itself is instrumented, so many of its features are exposed for management as described earlier. An instrumented Java application (such as Cassandra) runs on top of this, also exposing some of its features as manageable objects. The JDK includes an MBean server that makes the instrumented features available over a remote protocol to a JMX Management Application. The JVM also offers management capabilities to Simple Network Monitoring Protocol (SNMP) agents and works in a similar manner.
But within a given application, you can manage only what the application developers have made available for you to manage. Luckily, the Cassandra developers have instrumented large parts of the database, making management via JMX fairly straightforward.
This instrumentation of a Java application is performed by wrapping the application code that you want JMX to hook into with managed beans.
MBeans
A managed bean, or MBean, is a special type of Java bean that represents a single manageable resource inside the JVM. MBeans interact with an MBean server to make their functions remotely available.
The jconsole tool ships with the standard Java
Development Kit. It provides a graphical user interface client for
working with MBeans and can be used for local or remote management. A
view of JConsole is shown in Figure 9-2.

In this figure, you can see the two kinds of views into your application that JMX offers: the general view about threads, memory, and CPU that every application will have, and a more detailed view that exposes the peak thread count value. You can see that many other instrumented aspects of the application are also available.
Note
JConsole is popular because it’s easy to use and ships with the JDK. But this is only one possible JMX client. The JBoss Application Server web console, for example, is itself a JMX client of the JBoss server.
There are many aspects of an application or the JVM that can be
instrumented but that may be
disabled. Thread Contention is one example of a potentially useful MBean
that is turned off by default in the JVM. These aspects can be very
useful for debugging, so if you see an MBean that you think might help
you hunt down a problem, go ahead and enable it. But keep in mind that
nothing comes for free, and it’s a good idea to read the JavaDoc on the
MBean you want to enable in order to understand the potential impact on
performance. ThreadCPUTime is another example of
a useful, but expensive, MBean.
Some simple values in the application are exposed as
attributes. An example of this is Threading
> PeakThreadCount, which just reports the value that the MBean
has stored for the greatest number of threads the application used at a
single point in time. You can refresh to see the most recent value, but
that’s pretty much all you can do with it. Because such a value is
maintained internally in the JVM, it doesn’t make sense to set it
externally (it’s derived from actual events, and not
configurable).
But other MBeans are configurable. They make operations available
to the JMX agent that let you get and set values. You can tell whether
the MBean will let you set a value by looking at the value for
writable. If it’s false, you will see a label indicating
the read-only value; if it’s true, you will see a set of one or more
fields to add your new value and a button to update it. An example of
this is the java.util.logging.Logger bean, as
shown in .
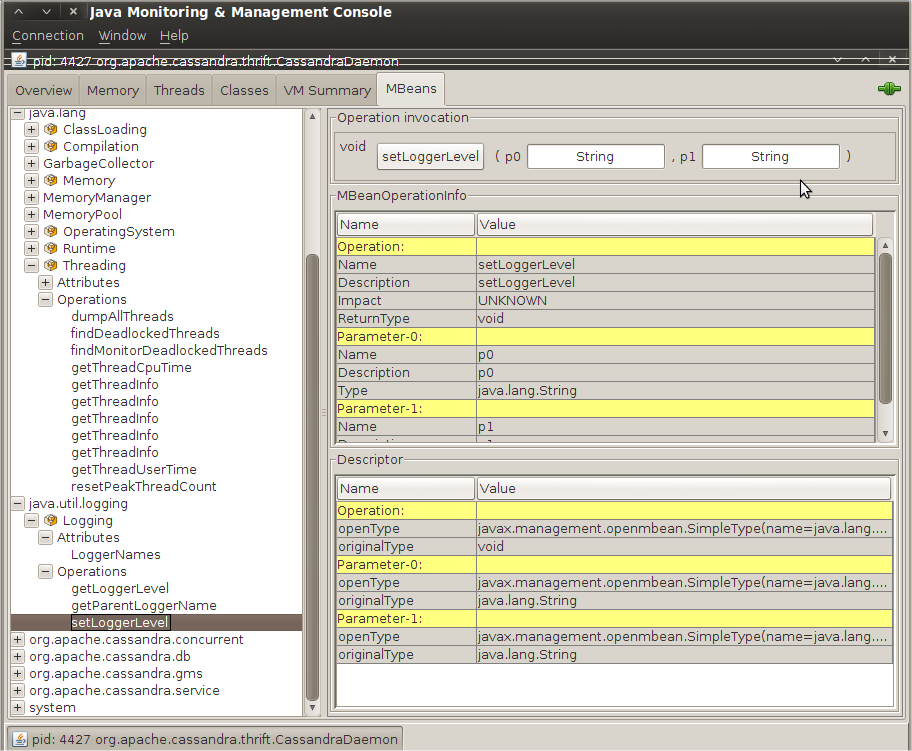
Note that the parameter names are not available to the JMX agent;
they’re just labeled as p0, p1, etc. That’s
because the Java compiler “forgot” the parameter names during
compilation. So in order to know what parameters to set, you’ll need to
look at the JavaDoc for the particular
MBean you’re working with. In the case of
java.util.logging.Logger, this class implements
an interface called java.util.logging.LoggingMXBean, which wraps it for
instrumentation. To find out what the right parameters are, we
examine the JavaDoc for this class and see that p0 is the
name of the logger you want to change, and p1 is the
logging level you want to set that logger to.
Note
If it’s not obvious, setting the logging level for
java.util.logging won’t help you much if that’s
not what your application is using for logging. It’s just used here as
a general example because it’s easy to understand and serves as a
gentle introduction. But Cassandra does not use that logging
package.
Some MBeans return an attribute value of
javax.management.openmbean.CompositeDataSupport.
That means that these are not simple values that can be displayed in a
single field, such as LoadedClassCount, but are
instead multivalued. One example is Memory >
HeapMemoryUsage, which offers several data points and
therefore has its own view.
Another type of MBean operation is one that doesn’t simply show a
value or allow you to set a value, but instead lets you execute some
useful action. dumpAllThreads and
resetPeakThreadCount are two such operations.
Now we’ll quickly get set up to start monitoring and managing Cassandra specifically.
Integrating JMX
Enabling Cassandra to use JMX is easy, but there are a couple of dependencies. Go to http://mx4j.sourceforge.net and download version 3.0.1 of the library MX4J. You can probably use a newer version if one’s available, but this version is known to work.
After you’ve downloaded the library, unzip it and navigate to the lib directory. Copy two JARs from this directory: mx4j.jar and mx4j-tools.jar. Paste them into your <cassandra-home>/lib directory and restart Cassandra. Now other Cassandra nodes can connect via JMX to monitor its health and even to set values for the functions that are exposed as MBeans.
If you’ve downloaded Cassandra’s source code, just drop the two necessary JARs into the lib directory and rebuild the source. The next time you start Cassandra, you should see output similar to the following:
 INFO 13:37:28,473 Cassandra starting up...
DEBUG 13:37:28,474 Will try to load mx4j now, if it's in the classpath
 INFO 13:37:28,508 mx4j successfuly loaded
HttpAdaptor version 3.0.2 started on port 8081
Here, MX4J will act as our JMX server agent, and now we’re ready to start getting some benefit from JMX.
Interacting with Cassandra via JMX
Now that JMX is enabled, let’s connect to Cassandra on its JMX port. To do so, open a new terminal and type the following:
>jconsole
When you run jconsole, you’ll see a login screen
similar to that in Figure 9-4.

From here, you can simply double-click
on the value
org.apache.cassandra.thrift.CassandraDaemon under the
Local Process section if you’re monitoring a node on the same
machine. If you want to monitor a node on a different machine, check the
Remote Process radio button, then enter the host and port you want to
connect to. Cassandra JMX by default broadcasts on port 8080, so you can
enter a value like the one shown here and then hit
:
>lucky:8080
Note
If you have trouble with this, make sure that you don’t have something else running on port 8080, as that’s a popular port for tools such as Apache Tomcat.
Once you’ve connected to a server, the default view includes four major categories about your server’s state, which are updated constantly:
- Heap Memory Usage
This shows the total memory available to the Cassandra program, as well as how much it’s using right now.
- Threads
This is the number of live threads Cassandra is using.
- Classes
The number of classes that Cassandra has loaded. This number is relatively small for such a powerful program; Cassandra typically requires around 2,300 classes out of the box. Compare this to a program such as Oracle WebLogic, which typically loads around 24,000 classes.
- CPU Usage
This shows the percentage of the processor that the Cassandra program is currently using.
You can use the selector to adjust the time range shown in the charts.
If you want to see a more detailed view of how Cassandra is using the Java heap and nonheap memory, click the Memory tab. By changing the chart value in the drop-down, you can see in detail the graduations in which Cassandra is using its memory. You can also (try to) force a garbage collection if you think it’s necessary.
You can connect to more than one JMX agent at once. Just choose File > New Connection... and repeat the steps to connect to another running Cassandra node to view multiple servers at once.
Cassandra’s MBeans
Once you’ve connected with a JMX agent such as JConsole, you can manage Cassandra using the MBeans it exposes. To do so, click the MBeans tab. Other than the standard Java items available to every agent, there are several Cassandra packages that contain manageable beans, organized by their package names, which start with org.apache.cassandra. We won’t go into detail on all of them here, but there are several of interest that we’ll take a look at.
Many classes in Cassandra are exposed as MBeans, which means in practical terms that they implement a custom interface that describes the operations that need to be implemented and for which the JMX agent will provide hooks. The steps are basically the same for getting any MBean to work; I’ll use a single key class as an example. If you’d like to JMX-enable something that isn’t already enabled, modify the source code following this general outline and you’ll be in business.
For this example, we look at Cassandra’s StorageService
and how it uses MBeans. Here’s the partial definition of the
StorageServiceMBean class, with some operations
omitted for brevity:
public interface StorageServiceMBean
{
    public Set<String> getLiveNodes();

    public Set<String> getUnreachableNodes();

    public void forceTableFlush(String tableName, String... columnFamilies)
        throws IOException;

    public void removeToken(String token);

//...
}
As you can see by this MBean interface definition, there’s no magic
going on. This is just a regular interface defining the set of operations
that will be exposed to JMX that the StorageService
implementation must support. This typically means maintaining additional
metadata as the regular operations do their work.
The StorageService class implements this
interface and must do the work of directly supporting JMX. The consistency manager field has a
reference type of java.util.concurrent.ExecutorService,
but the actual implementation is of type
org.apache.cassandra.concurrent.JMXEnabledThreadPoolExecutor.
private ExecutorService consistencyManager_ =
  new JMXEnabledThreadPoolExecutor(DatabaseDescriptor.getConsistencyThreads(),
    DatabaseDescriptor.getConsistencyThreads(),
    StageManager.KEEPALIVE,
    TimeUnit.SECONDS,
    new LinkedBlockingQueue<Runnable>(),
    new NamedThreadFactory("CONSISTENCY-MANAGER"));
The JMXEnabledThreadPoolExecutor implements
the JMXEnabledThreadPoolExecutorMBean and, by
association,
org.apache.cassandra.concurrent.IExecutorMBean, so
that all the Cassandra classes that use thread pools can expose the same
operations to JMX. It’s in the
JMXEnabledThreadPoolExecutor that we see how
Cassandra becomes JMX-enabled.
The executor pool registers with the platform MBean server in its constructor, as shown here:
    public JMXEnabledThreadPoolExecutor(int corePoolSize,
        int maximumPoolSize,
        long keepAliveTime,
        TimeUnit unit,
        BlockingQueue<Runnable> workQueue,
        NamedThreadFactory threadFactory)
    {
        super(corePoolSize, maximumPoolSize, keepAliveTime, unit, workQueue,
threadFactory);
        super.prestartAllCoreThreads();

        MBeanServer mbs = ManagementFactory.getPlatformMBeanServer();
        mbeanName = "org.apache.cassandra.concurrent:type=" + threadFactory.id;
        try
        {
            mbs.registerMBean(this, new ObjectName(mbeanName));
        }
        catch (Exception e)
        {
            throw new RuntimeException(e);
        }
    }
The platform server here is simply the default one embedded in the JDK. The MBean is named and registered so that the MBean server knows to monitor it and make it manageable via the agent.
In order to do proper cleanup, when the
JMXEnabledThreadPoolExecutor is shut down, the class will
also unregister itself from the MBean server:
private void unregisterMBean()
{
  try
     {
     ManagementFactory.getPlatformMBeanServer().unregisterMBean
(new ObjectName(mbeanName));
     }
  catch (Exception e)
     {
     throw new RuntimeException(e);
  }
}
Likewise, the StorageService class itself registers and
unregisters with the MBean server
for the JMX properties that it maintains locally. So this
implementation does all of the work that it is intended to do, and then
has implementations of the methods that are only necessary for talking to
the MBean server. For example, here is the StorageService
implementation of the of the getUnreachableNodes
operation:
public Set<String> getUnreachableNodes()
{
  return stringify(Gossiper.instance.getUnreachableMembers());
}
The Gossiper class is a Singleton that
maintains lists of IP addresses of the nodes it has sent and received heartbeat messages from, so when
you call the getUnreachableNodes operation in the JMX agent, it
calls the MBean method in StorageService,
which delegates the call to the Gossiper, which
returns the set of unreachable IP addresses, wrapped in a new set so it
can’t be modified directly by the caller:
/* unreachable member set */
private Set<InetAddress> unreachableEndpoints_ =
    new ConcurrentSkipListSet<InetAddress>(inetcomparator);
//...
public Set<InetAddress> getUnreachableMembers()
{
    return new HashSet<InetAddress>(unreachableEndpoints_);
}
So when we open it up in the JMX agent JConsole, we see, happily,
that we have no unreachable nodes because the set is empty. If there were
unreachable nodes, their IP addresses would appear in the
Value field, as shown in Figure 9-5.

In the following sections, we see what features are available for monitoring and management in this way via JMX, by package.
org.apache.cassandra.concurrent
This package houses Cassandra’s threading and streaming functionality. As such, it is the home of the Staged Event-Driven Architecture (SEDA) classes, the gossiper, the balancers, and the classes that flush data in memtables.
Most of these MBeans allow you to view only attributes. If you are suspicious of data writing problems or unbalanced node problems in your Cassandra ring, start here.
Because of the SEDA architecture, each stage in Cassandra is exposed as its own MBean. This means you’re able to quickly determine exactly how many objects are in a given stage at a given time. The stages include:
Anti-Entropy Stage
Migration Stage
Response Stage
Row Mutation Stage (for deletes and updates)
Row Read Stage
Stream Stage
For each of these stages you can see the counts for active, completed, and pending tasks. Some of the stages, such as for reading and writing data, maintain their own thread pools, and the MBeans allow you to see the pool size. All of the stage objects expose only attributes and don’t allow you to perform any operations.
org.apache.cassandra.db
These are the Cassandra classes related to the core database itself that are exposed as MBeans. They include Caches, Column Family Stores, the Commit Log, and the Compaction Manager.
You can view information about a variety of caches that Cassandra maintains—including the caches for column family key and row hints—for location information of keys, rows, and migrations. The cache information contains attributes for the cache’s current size, capacity, number of cache requests, cache hits, and recent cache activity.
Column Family Stores is another set of MBeans, but these give you
a richer variety of attribute values, and also allow you to perform some
operations. These give you a view into your memtables, SSTables, and
Bloom filter usage. You can use the operations provided to force a flush
of the memtables, initiate a major compaction by calling the
forceMajorCompaction method of the
CompactionManager class, or invalidate a row
cache.
One useful set of statistics here relates to reading and writing
data, included in the ColumnFamilyStores > system >
Schema bean:
- Total Read Count
This is the number of reads Cassandra has performed, available from the
ReadCountattribute.- Recent Read Latency
You get this number (in microseconds) from the
RecentReadLatencyMicrosattribute. You can also see theTotalReadLatencyMicros; the total reads multiplied by the read latency gives you that number.
These statistics come in very handy if you are concerned that performance is degrading. But they also are great for showing how fast Cassandra can be. For example, on my eight-core machine, I’ve recorded write latency at 92 microseconds for simple values in a small database.
This set of MBeans also makes data regarding the Compaction Manager available, including the total bytes that are in the process of being compacted and the total bytes that have been compacted.
org.apache.cassandra.gms
This package has one MBean with three operations: you can dump arrival times or get and set the conviction threshold, which by default is 8.
org.apache.cassandra.service
The service package offers two beans:
StorageService and
StreamingService. Because these classes are
central to Cassandra’s operations, they expose the greatest number of
operations and give you considerable external control. Let’s take a
moment to survey some of the key elements.
StorageService
Because Cassandra is a database, it’s essentially a very
sophisticated storage program; therefore, one of the first places
you’ll want to look when you encounter problems is the
StorageService MBean. This allows you to
inspect your OperationMode, which reports
normal if everything is going smoothly (other possible
states are leaving, joining, decommissioned, and
client).
You can also view the current set of live nodes, as well as the
set of unreachable nodes in the cluster. If any nodes are unreachable,
Cassandra will tell you their IP addresses in the
UnreachableNodes attribute. But there are many other
standard maintenance operations
that this bean affords you, and understanding the operations available
here is important to keeping your cluster in good health. I encourage
you to check out the bean for yourself, of course, and here I
highlight some of the key maintenance operations.
If you want to change Cassandra’s log level at runtime without
interrupting service (as we saw earlier in the general example), you
can invoke the setLog4jLevel(String classQualifier, String
level) method. For example, say that you have set
Cassandra’s log level to debug because you’re troubleshooting an
issue. You can use some of the methods described here to try to help
fix your problem, then you might want to change the log level to
something less trying on the system. To do this, navigate to the
StorageService MBean in JConsole. We’ll change
the value for a particularly chatty class: the
LoadDisseminator. The first parameter to this
operation is the name of the class you want to set the log level for,
and the second parameter is the level you want to set it to. Enter
org.apache.cassandra.service.LoadDisseminator
and INFO, and click the button labeled
setLog4jLevel. You should see the following
output in your logs (assuming your level was already debug):
DEBUG 17:17:30,515 Disseminating load info ...
 INFO 17:17:42,001 set log level to INFO for classes under
'org.apache.cassandra.service.LoadDisseminator'
(if the level doesn't look like 'INFO' then log4j couldn't parse 'INFO')
As you can see from this output, Cassandra was logging a load
info statement because the logger was set to debug. After invoking the
setLog4jLevel operation, we get the
INFO output and no more debug level statements.
To get an understanding of each node’s load, you can use the
getLoadMap() method, which will return to you a Java Map
with keys of IP addresses with values of their corresponding
loads.
If you’re looking for a certain key, you can use the
getNaturalEndpoints(String table, byte[] key)
operation. Pass it the table name and the key for which you want to
find the endpoint value, and it will return a list of IP addresses
that are responsible for storing this key.
You can also use the
getRangeToEndpointMap operation to get a map
of range to end points describing your ring topology.
If you wish to decommission a server, you can also do that with
this MBean. Invoke the decommission()
operation, and the current node’s data will automatically transfer to
another machine and take this node out of service.
If you’re feeling brave, you can invoke the truncate operation for a given column family in a given keyspace. If all of the nodes are available, this operation will delete all data from the column family but leave its definition intact.
A good idea for general maintenance is to use the
loadBalance() operation if you discover
through other MBeans that your nodes have become very unbalanced. This
can happen from time to time, where some nodes have an inordinate
share of the data. This operation will cause the current node to
unload its data onto one of its neighboring nodes, and then it will
bootstrap to receive the data of the node in the ring burdened with
the most data.
StreamingService
The
org.cassandra.streaming.StreamingServiceMBean
defines the following interface:
public interface StreamingServiceMBean
{
    public Set<InetAddress> getStreamDestinations();

    public List<String> getOutgoingFiles(String host) throws IOException;

    public Set<InetAddress> getStreamSources();

    public List<String> getIncomingFiles(String host) throws IOException;

    public String getStatus();
}
There are two basic ideas here: a stream source and a stream destination. Each node can stream its data to another node in order to perform load balancing, and this class supports these operations. The MBean methods give you a necessary view into the data that is moving between nodes in the cluster.
The getStatus operation is not an
enumeration with some set list of possible statuses. It rather returns
a string in the form of ReceivingFrom: [node] SendingTo:
[node].
So in conjunction with the Storage-Service MBean,
if you’re concerned that a node is not receiving data as it should, or
that a node is unbalanced or even down, these two services working
together can give you very rich insight into exactly what’s happening
in your cluster during a snapshot in time.
Custom Cassandra MBeans
Let’s quickly write a very simple MBean so that you can do this kind of work yourself if there’s a new feature you’d like to JMX-enable. There’s nothing to it.
First, we get the source code and create our MBean interface next to the Cassandra source file it wraps. Our MBean will return the current version of the Cassandra API, which is not currently available in Cassandra. Our MBean looks like this:
package org.apache.cassandra.thrift;

public interface CassandraServerMBean {
  public String getVersion();
}
Now we need to open up the source of CassandraServer.java and make it implement our MBean interface and hook into the JMX server. Finally, we’ll actually implement the method. Thrift generates a version number that is accessible from the CLI, so we’ll just reuse that. Our new CassandraServer.java class looks like this:
package org.apache.cassandra.thrift;

import javax.management.MBeanServer;
import javax.management.ObjectName;

import org.apache.cassandra.auth.AllowAllAuthenticator;
import org.apache.cassandra.concurrent.StageManager;

//rest of imports...

public class CassandraServer implements Cassandra.Iface, CassandraServerMBean
{
    public static final String MBEAN_OBJECT_NAME =
       "org.apache.cassandra.service:type=CassandraService";

    public CassandraServer()
    {
        storageService = StorageService.instance;

        final MBeanServer mbs = ManagementFactory.getPlatformMBeanServer();
        try
        {
            mbs.registerMBean(this, new ObjectName(MBEAN_OBJECT_NAME));
        }
        catch (Exception e)
        {
            throw new RuntimeException(e);
        }
    }


//rest of server implementation...

//our mbean hook method
  public String getVersion() {
    String version = null;
    try {
      version = describe_version();
    } catch(TException e) {
      logger.warn("Cassandra server version unavailable: ", e.getMessage());
      version = "unavailable";
    }
    return version;
  }
}
So we have implemented the interface and connected the Cassandra
server with the management platform. Now all we need to do is open a
terminal, navigate to our <cassandra-home>
directory using the $ ant command, and start the server.
Then, run jconsole and connect to your server instance. You
should see your attribute available, as shown in Figure 9-6.

Here, version 8.1.0 is the API version information generated as a Thrift constant; it doesn’t necessarily correspond to the release version.
Note
If you are modifying the source and are unsure about what you’ve
changed, you can always use Subversion to check the changes in your
local repository against what you checked out. Use the svn
diff command to see the changes between the two files and dump
the result to a new file:
eben@morpheus:~$ svn diff
/home/eben/cassandra/dist/trunk-svn-1/src/java/org/apache/cassandra/thrift/
CassandraServer.java
/home/eben/cassandra/dist/trunk-svn-2/src/java/org/apache/cassandra/thrift/
CassandraServer.java
>> /home/eben/CassandraServer.patch
Runtime Analysis Tools
We don’t need to go into too much more detail about JMX in general here, but to understand Cassandra and manage it, it’s good to know what features are exposed with JMX. It’s also useful to know what tools Java makes available out of the box to detect and spot the source of a memory leak, analyze a hung process, and so on. Because Cassandra is a Java application, and because it is relatively young, there are no third-party tools specific to Cassandra at this point.
Note
If you are debugging and you’re not sure what commands have been executed against Cassandra with the CLI, look in your home directory for a hidden file called .cassandra.history. This acts like your Bash shell history, listing the commands in a plain-text file in the order Cassandra executed them. Nice!
Heap Analysis with JMX and JHAT
As you’re debugging your Cassandra application, it’s often useful to understand what’s happening in your heap. If you’re working off of the trunk or are otherwise unsure of your Cassandra build, there are some native Java tools available to you.
Cassandra can use a lot of memory, and garbage collection and major compactions can have a big impact on performance. One helpful program here is called Java Heap Analysis Tool (JHAT). JHAT uses the HPROF binary format to create web pages that allow you to browse all the objects in the heap and see all the references to and from heap objects. You can combine this tool, which ships with the JDK, with some data made available through JMX.
To gain a better understanding of our heap, we’ll use the
com.sun.management.HotSpotDiagnostic bean. It has
an operation called dumpHeap. Because that’s the name of
the operation in the MBean, that’s the label on the button in the JMX
agent. This bean allows you to specify a filename where you want to dump
the heap to; then you click the button and it writes the heap
information into the file you specified. But the dumpHeap
operation writes the heap’s current state to a file that’s encoded in
the HPROF binary format for heap and CPU profiling. So we can’t read it
in a text file and will need to use JHAT to view the data.
To get a heap dump, run JConsole and navigate to the
com.sun.management.HotSpotDiagnostic bean, expand
the Operations tree, and click the dumpHeap operation.
Enter a relative or absolute path naming the file you want to write the
heap dump to, as shown in Figure 9-7.

Open a new terminal and start up jconsole.
You should see a pop-up box indicating that the method was successfully
invoked.
You can also get a heap dump file on a running process without the
graphical interface using the jmap tool that ships with the
JDK. First, get your Cassandra instance’s process ID. To get the process
IDs on a Linux system for programs, use the ps command and
look for ‘java’. Or, if you have many Java processes running, you can
find Cassandra more specifically by grepping for the Cassandra
daemon.
Note
You can find Cassandra’s process ID on a Linux system by opening
a terminal and using the ps command as follows:
$ ps -ef | grep 'CassandraDaemon'
Once you have the Cassandra process ID, we can use it to specify
the heap we want to get a snapshot of with the jmap tool.
This is useful for finding out what’s going on in a hung process,
locating the source of a memory leak, and so on.
eben@morpheus:~$ jmap -dump:live,format=b,file=/home/eben/jmapdump.bin 4427
Dumping heap to /home/eben/jmapdump.bin ...
Heap dump file created
Now that we have captured our heap data, let’s use JHAT to check it out. To run JHAT, open a terminal and type something like the following, replacing my heap dump file location with yours:
$jhat /home/eben/jmapdump.bin
This command will run for a moment and then output something like the following:
Chasing references, expect 63 dots..............................................
.................
Eliminating duplicate references................................................
...............
Snapshot resolved.
Started HTTP server on port 7000
Server is ready.
Now that the server is started, you can open a browser to
http://localhost:7000 to view the file. The heap dump file is
also portable, so you can move it to another box after you generate it
and view it there in JHAT.
Note
JHAT will run for a moment and then launch a web server (there’s
a small HTTP server built into the JDK since version 6) on port 7000,
so you might need to close JConsole or some other program to ensure
that port can be used, because it’s not configurable. To make sure
it’s open, type >netstat -o -a on Windows
or >netstat -o -a | less on Linux.
For more information on how to use JHAT, consult http://java.sun.com/javase/6/docs/technotes/tools/share/jhat.html
or just type jhat -h for help options.
The generated website offers a variety of options, including limiting your view to only:
All classes, including Java platform classes
All classes, excluding Java platform classes
All members of the rootset
Instance counts for all classes
Heap histogram, showing all classes with the number of instances that have been created and their total size
Classes awaiting finalizer execution
If there’s a problem with Cassandra, an hprof file will be created, as we can see in the following output:
DEBUG 16:13:17,640 Disseminating load info ...
java.lang.OutOfMemoryError: Java heap space
Dumping heap to java_pid21279.hprof ...
Heap dump file created [2766589 bytes in 0.032 secs]
ERROR 16:13:34,369 Fatal exception in thread Thread[pool-1-thread-1,5,main]
java.lang.OutOfMemoryError: Java heap space
 at org.apache.thrift.protocol.TBinaryProtocol.readStringBody(TBinaryProtocol
.java:296)
 at org.apache.thrift.protocol.TBinaryProtocol.readMessageBegin(TBinaryProtocol
.java:203)
 at org.apache.cassandra.thrift.Cassandra$Processor.process(Cassandra.java:1113)
The file will be created in <cassandra-home>, and you can open it like this:
$ jhat java_pid21279.hprof
The file will be analyzed, the server will be created, and you can open a browser to see what the state of your objects were at the time of the crash.
Alternatively, you can create your own custom view by executing a query of the heap data in an HTML form. Object Query Language (OQL) is a simple SQL-like syntax for querying the heap dump file to find only objects that meet certain specified properties. The query in Figure 9-8 allows us to filter on only objects that are in Cassandra’s org.apache.cassandra.db package.
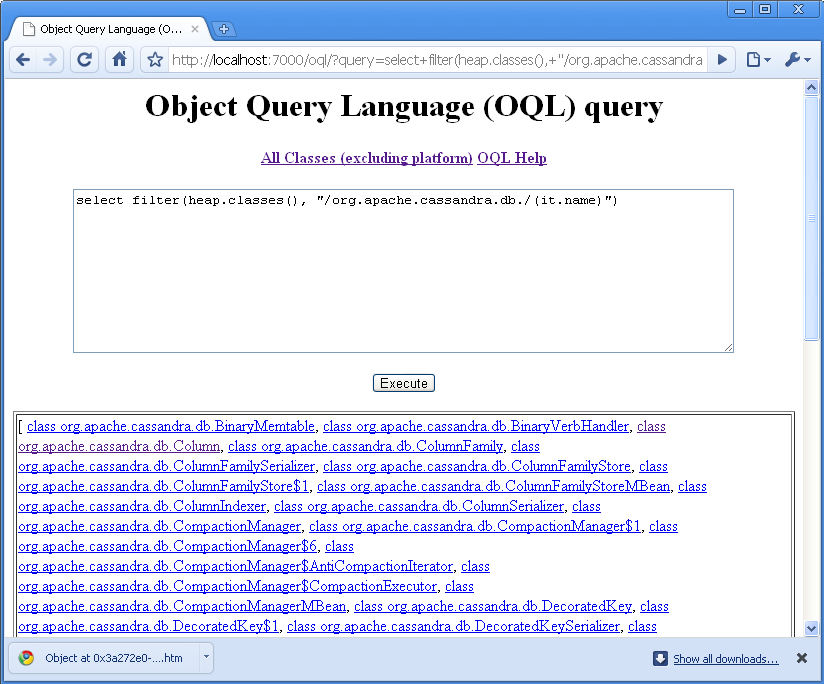
Once the query result returns, you can click on the class name to see additional detail about it.
You can execute queries about more specific properties of objects as well. For example, you may want to filter for only objects that have a string longer than 200 characters. Using OQL, you could issue a statement such as this:
select s from java.lang.String s where s.count >= 200
Note
More detail on the Object Query Language is beyond the scope of this book, but it’s not hard to use. There are a few examples included with the tool, and its syntax is very similar to SQL. There are also some good blogs describing how to use it; in particular, check out A. Sundararajan’s blog at http://blogs.sun.com/sundararajan/entry/querying_java_heap_with_oql.
In this case, we can use the results of the query to see the classpath information held in a string:
Object at 0x3a272e0

instance of -ea -Xdebug
-Xrunjdwp:transport=dt_socket,server=y,address=8888,suspend=n
-Xms128m -Xmx1G -XX:TargetSurvivorRatio=90 -XX:+AggressiveOpts
-XX:+UseParNewGC -XX:+UseConcMarkSweepGC -XX:+CMSParallelRemarkEnabled
-XX:+HeapDumpOnOutOfMemoryError
-XX:SurvivorRatio=128 -XX:MaxTenuringThreshold=0
-Dcom.sun.management.jmxremote.port=8080
-Dcom.sun.management.jmxremote.ssl=false
-Dcom.sun.management.jmxremote.authenticate=false -Dcassandra
-Dstorage-config=/opt/apache-cassandra-0.6.2/0.6.2-source/conf
-Dcassandra-foreground=yes (24 bytes)
This is a roundabout way to see your classpath switches, but it does give you an idea of how JMap and JHAT can help you find interesting information about your runtime state.
Detecting Thread Problems
If you are seeing slowness or uncontrollable growth in the JConsole, you might want to inspect the current thread behavior. Cassandra makes heavy use of thread pools and the Java concurrency libraries, so understanding their state can be important to debugging efforts.
In the console, click the Threads tab. The window on the left will show you a list of threads and pools, and you can click any of them to see a stack. This view will also show you their current state. If you see any threads in a stuck state, that’s a sign that your server is not releasing resources as it should, and you will start to see performance bottlenecks around this thread. If many stuck threads begin to queue up in a stuck state, your server will eventually crash. If you’re seeing unusual growth in heap usage where garbage collection is not reclaiming space, you might have an issue with stuck threads, and you can check this area of the console to determine thread state.
Note
In Java, a “stuck” thread is a thread that the application has transitioned to the “stuck” state following a timeout period; that is, the application has decided that after a certain amount of time during which work is not being completed, the thread will never complete its work. This can prevent it from getting returned to the thread pool, which means fewer threads will be available for new work, which means performance will start crumbling.
Finally, you can click the Detect Deadlock button if you’re concerned that you might have internal deadlocked threads.
Health Check
There are a few basic things that you’ll want to look for to ensure that nodes in your cluster are healthy:
Check the MBean for
org.apache.cassandra.concurrent.ROW_MUTATION_STAGE. You’re looking to see that the completed task counts are increasing, which means that writes (inserts, updates, and deletes) are coming through and are completing successfully.Check the MBean for
org.apache.cassandra.concurrent.ROW_READ_STAGE. For this, you’re also ensuring that the completed task counts are increasing, which means that read operations are coming through and are completing successfully.Make sure for both of these MBeans that the number in the
PendingTasksattribute is not growing too much. Even if it’s not a very low number, it should be relatively stable. A growing set of pending tasks means that Cassandra is having trouble keeping up with the load. As is usual with databases, once this problem starts, it will only continue in a downward spiral. Three things that can improve this situation are a decreased load, scaling up (adding more hardware), or scaling out (adding another node and rebalancing).As usual, check the logs to make sure that nothing is reporting at
ERRORlevel.
Summary
In this chapter we looked at ways you can monitor and manage your Cassandra cluster. In particular, we went into some detail on JMX and learned the rich variety of operations Cassandra makes available to the MBean server. We saw how to use JConsole to view what’s happening in your Cassandra cluster, and we performed basic maintenance tasks. Using just a little Java code, we saw how you could easily use MBeans yourself to JMX-enable a new aspect of the source code if you wish.
We also gained some insight into how to use tools that come with the Java Development Kit to help us understand the runtime object graph within Cassandra. Using JMap and the Java Heap Analysis Tool, we took a snapshot of the program’s memory and then queried it using Object Query Language to find objects with properties we might be concerned about.
There are a variety of other operations monitoring tools that are more robust, but this will get you started. Your organization might use one already that you can hook into, such as OpenNMS (see http://www.opennms.org), which has JMX hooks. Nagios, for example, is open source, free, and rather straightforward. It also has the advantage of readily connecting to JMX, and it’s what they use at Mahalo to monitor their Cassandra ring.
Note
There’s an article on Mahalo about how to integrate Nagios with JMX. See http://www.mahalo.com/how-to-monitor-cassandra-with-nagios.
You should now be ready to perform routine maintenance, understand your Cassandra cluster better, and know how to perform some general and fine-grained tuning tasks to keep Cassandra healthy.