
Chapter 2
Using the Interface
IN THIS CHAPTER
![]() Using the designer
Using the designer
![]() Exploring Solution Explorer
Exploring Solution Explorer
![]() Coding with Code View
Coding with Code View
![]() Using the Tools menu
Using the Tools menu
![]() Working with the debugger
Working with the debugger
Integrated Development Environments, or IDEs, are the Swiss army knife of the programmer’s toolkit. IDEs provide a mechanism for storing program code, organizing and building it, and looking at finished products with design editors. IDEs make things happen and, in the bargain, cut hours from a task.
Visual Studio is impressive; it is massive. It would be tough to cover all Visual Studio features in a single book, much less a single chapter. In fact, you’re unlikely to ever use all the Visual Studio features.
Rather than try to cover everything, this chapter gives you the chance to experience only the features of Visual Studio that you’ll realistically use every day. Of course, continuing to explore the IDE and discovering new stuff is important — don’t just stop with the content of this chapter. It provides only a brief overview of some of the astonishing features in the tool. You can discover more about the IDE at https://docs.microsoft.com/visualstudio/get-started/visual-studio-ide.
 You don’t have to type the source code for this chapter manually. In fact, using the downloadable source is a lot easier. You can find the source for this chapter in the
 CSAIO4D2EBK04CH02 folder of the downloadable source. See the Introduction for details on how to find these source files.
Designing in the Designer
One thing that is integrated into an IDE is a way to edit files graphically, sometimes called a Graphic Development Environment or designer. Visual Studio allows you to graphically edit many different types of code bases and provides adjunct tools for the further management of said code bases. In short, the designer is the drag-and-drop element of the Visual Studio world. It isn't always the best way to develop a program, but it sure can help sometimes.
For each major type of project that Visual Studio maintains (except console applications and application elements without a visual interface, such as services), there is a designer. The designer handles the What You See Is What You Get portion of the experience and usually the behind-the-scenes markup code. In addition to the designers that Microsoft provides, you can also create your own custom editors and designers using the material found at https://docs.microsoft.com/visualstudio/extensibility/creating-custom-editors-and-designers as a starting point. Custom editors and designers enable you to work with application code in new ways and to support languages other than those that Visual Studio supports natively.
The problem is that because of the necessities of the software development world, different designers all work a little differently. A significant difference exists between HTML and XAML, for example, so the web designer and the WPF Designer don't look or act the same. Visual Studio gives you several visual designers to help develop applications, including these commonly used designers:
- Class designer
- Data View
- Web Forms
- Universal Windows Platform (UWP) application
- Windows Forms
- Windows Presentation Foundation (WPF)
Universal Windows Platform (UWP) application
Microsoft is getting into the run-anywhere game late — very late, but it’s doing it with style. This type of application relies on the Windows Runtime (WinRT) to provide services across a multitude of devices that include your desktop, smartphone, Xbox, and other platforms. Book 5, Chapter 5 offers a good overview of this new method of creating Windows applications, but you should view this method more as an adjunct to what you have done in the past, rather than a complete replacement, because it’s simply not practical to throw out your entire existing code base for software that is less capable. Because UWP applications run everywhere, they can’t access the full potential of a desktop machine. It’s more like writing a 32-bit application with serious limits, rather than a robust 64-bit application that can take on heavy tasks such as machine learning and serious database management. Each application type has a place in your developer Toolbox.
Much of the setup for a UWP application is the same as for any other project you’ve created so far in the book. However, there are a few differences, such as the need to select a target version of Windows for your app and also select the minimum acceptable version of Windows. You also have to configure your system for Developer Mode, which is covered in Book 5, Chapter 5. The initial display that you see also differs from other application-creation processes in that it gives you a series of steps to follow, as shown in Figure 2-1.

FIGURE 2-1: Creating a UWP application is a process that Visual Studio helps with.
The core of the user interface design experience is a language called Extensible Application Markup Language (XAML, pronounced zammel), which (unsurprisingly) is an XML-derived domain-specific markup language for the creation of user interfaces. In the designer, shown in Figure 2-2, the design is in the top frame and the underlying code is in the bottom frame.

FIGURE 2-2: UWP applications rely on the use of pages to display information.
In addition, you design the application using pages. Each page is designed to work with displays of various sizes and you see the pages listed in a Document Outline pane, as shown in Figure 2-2. The actual page size is controlled using the drop-down list above the graphical design area. The default is the 13.5” Surface Book (3000 x 2000) 200% Scale. However, you can also choose other devices, such as 5” Phone (1920 x 1080) 300% Scale. Each of these options helps you see how your design will look on a specific device.
There are a few small but significant features in the UWP Designer that should be pointed out. You can see them all in Figure 2-2.
On the left side of the bar at the bottom of the designer is the Zoom field. The options in this field let you do things like configure the designer to zoom to fit the current selection. This is invaluable for working on an application that is bigger than your screen, or for examining details.
Next to the Zoom field are a series of buttons that make working with the designer easier. Here are the buttons in order of appearance:
- Refresh: Ensures that the design area shows any changes to the XAML and vice versa.
- Show Snap Grid: Toggles the snap grid. Using the snap grid helps you place controls more accurately and with less effort.
- Snapping to Gridlines: Determines how controls are placed on the form. Using gridline snapping means that controls automatically appear on specific boundaries, which makes placing the controls even easier. However, you also have a little less flexibility in placing controls precisely as you’d like them.
- Toggle Artboard Background: Controls the background shown behind the form you’re creating. The default is a gray background like the one shown in Figure 2-1. You can also choose a black background that makes form features pop out better but can also be harder on the eyes.
- Snapping to Snaplines: Controls use of the lines (snaplines) that appear when you place controls on the form that show how one control aligns with another. Using snaplines makes it easier for you to align the controls and gives your form a more pleasing appearance. However, snapping to the snaplines can also make it harder to place controls precisely where you want them.
- Control Display Options: You can choose to display all the controls in the Toolbox (the default) or just the controls that apply to a particular platform. Using the Only Display Platform Controls option can improve the stability of the development environment and keep your eyes from going just a bit nuts trying to figure out what is what in the design area.
At the left side of the dividing line between the Design and XAML frames is a little double-arrow icon. Clicking this icon changes whatever is in the bottom frame to be in the top frame, and vice versa.
On the right side of the same dividing line are three buttons that determine the kind of split you have — a vertical split, a horizontal split (which is the default), or no split (so that the designer or Code Editor take the full space). Some people like the code. Some people like the designer. Some people prefer a mixture of the two. You determine how you want to use the tools.
Windows Presentation Foundation (WPF)
Windows Presentation Foundation is covered in some depth in Book 5, but for now you should know that it is the current focus of Microsoft’s Windows desktop development experience. Yes, you still see a lot of Windows Forms development, but newer applications rely on either WPF or UWP. Book 5 talks all about WPF, so you can read more about it there. Figure 2-3 shows the WPF Designer, which has a striking similarity to the UWP Designer shown in Figure 2-2.

FIGURE 2-3: The WPF Designer.
When creating a WPF application, you decide which version of the .NET Framework to use: .NET Core 3.1, .NET 5.0, or .NET 6.0. The framework version determines the features available to your application and somewhat controls its appearance. Figure 2-3 shows what you see when working with .NET 6.0. Notice that you see a window, not pages, as when working with the UWP Designer. You also don’t select a device size.
You can click the design in the designer and move things around, if you want, or use the designer to select things and edit the properties in the Properties panel (covered in the upcoming section “Paneling the Studio”). Additionally, if you change something in the code area, you’ll see the change in the design. It’s a good system. The following list contains some button differences between the WPF Designer and the UWP Designer:
- Effects (fx): Toggles user interface effects. Turning the effects off does make the user interface a little less interesting but also conserves processing power for more productive uses.
- Disable Project Code: Enables or disables use of XAML code to display form content. Sometimes the XAML that appears in the bottom window in Figure 2-3 has errors in it. You can disable the project code to allow for fixing these errors without crashing the designer.
Windows Forms
The main difference between the Windows Forms Designer and the WPF Designer is the lack of a code panel in Windows Forms. Although there is code backing up Windows Forms, you don’t get to edit it directly. The Windows Forms Designer performs this task for you and places the code in a special designer file, such as Form1.Designer.cs for a default project.
The topic of Windows Forms isn’t covered in any detail in this book (there are a few projects, such as the network status example in Book 3, Chapter 4 and the image example in Book 3, Chapter 5). Even though it’s still an active development platform, most developers are moving to WPF instead, so it pays to spend more time working with an environment that developers use for new projects. WPF performs the same programming duties as Windows Forms but is the newer technology. The Windows Forms Designer is shown in Figure 2-4.
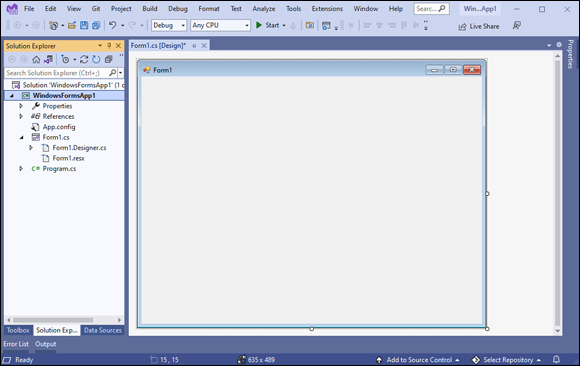
FIGURE 2-4: The Windows Forms Designer.
Data View
Data View is usually used with the Server Explorer and is part of an in-studio representation of SQL Management Studio. You can view and edit data tables in SQL Server (and other) database management systems right inside Visual Studio. An example is shown in Figure 2-5; in this case, you see the Show Table Data view of the Address (Person) table of the AdventureWorks2012 database.
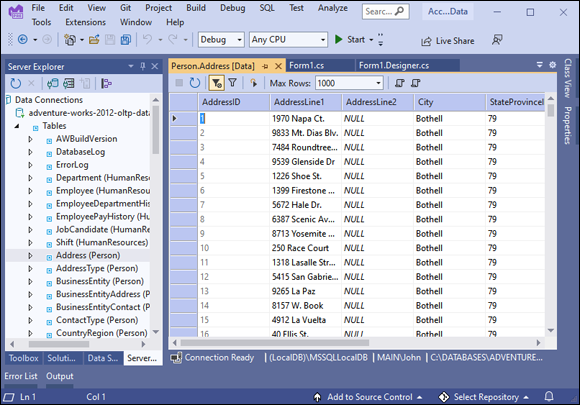
FIGURE 2-5: When you use Data View, who needs SQL Management Studio?
There is a remarkable amount of power here, and there just isn’t enough space to cover it all. Again, this isn’t a database book, so you may want to read the MSDN entries for the Data Connections feature of Server Explorer for more details.
Paneling the Studio
To be as flexible as it needs to, Visual Studio has a large collection of modular windows that are called panels (or sometimes panes, depending on whom you talk with). These panels do everything that isn't involved with directly editing a design or code. They manage files, manage objects, show feedback, show properties, do all sorts of stuff.
Visual Studio has more than 30 panels. You normally access them using either the View menu, such as View⇒ Solution Explorer to see the Solution Explorer pane, or the Debug/Windows menu, such as Debug⇒ Windows⇒ Breakpoints to see the Breakpoints pane. There isn’t room to discuss them all here, so the chapter covers only the five you use most often.
Solution Explorer
Solution Explorer (see Figure 2-6) manages solutions, projects, and files. Even though solutions consist mostly of files and folders, managing a solution is a somewhat more complex operation than it seems at first blush.

FIGURE 2-6: The explorer of solutions.
Solutions
For solutions themselves, Solution Explorer provides a number of important tools (accessible by right clicking the solution entry), including the following:
- Solution Management: Allows you to build, rebuild, or clean a solution. In addition, you can perform analysis that shows how your application runs.
- Configuration Manager: Provides a useful interface for what is basically a settings file in the solution itself. You can specify whether Release or Debug compilation is desired for your build here, if you want all debugging information stored with your file. You can tell the compiler whether you want the software built for 32-bit systems or 64-bit systems too. You can also reach Configuration Manager from the Build menu.
- Manage and Restore NuGet Packages: Lets you add new packages to your solution to extend the functionality that Visual Studio supplies. You can also restore existing packages to the solution as needed.
- Add Projects: Displays dialog boxes that you can use to add new projects to the existing solution.
- Project Dependencies: Choosing Set Startup Projects displays a dialog box that shows how your projects are interrelated and describes the way in which your projects depend on each other. It has a tab for the build order, too. When you’re getting weird “referenced member not available in object” errors, check here first. Your solution needs to contain more than one project for this command to be available on the Project menu.
- Create Git Repository: Gives you the means to store your code online. This feature ensures that losing your local machine doesn’t result in losing your code as well. You can also use an online repository to share your code with others.
- Property Pages: Determines which project should start on debug and where source files are kept, among other things.
Projects
Projects are the individual compiled units and are divided by type. You can find more about projects in Chapter 1 of this minibook. Solution Explorer brings to projects the capability to add and remove files, make references and services, set up a class diagram, open the representative Windows Explorer folder, and set properties. All this information is saved in the Project file. The Project file is just an XML file. There are a few key characteristics of the file:
- It includes a PropertyGroup for each build type. This is because you can set different properties for each type of executable.
- It contains an ItemGroup that has all the references in it, including required Framework versions, and another set of ItemGroups that have the project load details.
- The file includes the import of the project general details and the Target collections. You can actually edit the file manually to make a custom build environment.
You likely won't modify your Project file, but it's important that you know it can be done, and that Microsoft has inline comments. They expect the file to get changed.
Files
Files are a lot less exciting. They are pretty much exactly what you expect. They host the source code of the program being developed. Solution Explorer manages the files in the project basically the way Windows Explorer does. Solution Explorer lists the files and folders and allows them to be opened in the designer or the Code Editor.
 Solution Explorer also knows what files to show. If the file isn’t in the project, but happens to be sitting in the folder for the project, it won’t show in the Explorer. If you can’t find a file, try clicking the Show All Files button in the gray button bar at the top of the Explorer. The hidden files will show up grayed out but still won’t compile into the project. You can add them to the project if you want.
Properties
The Properties panel (see Figure 2-7) is a simple, flexible tool that allows you to update those endless lists of details about everything in development projects. The panel is basically a window with a two-column-wide data grid. It reads properties in key/value pairs and allows for easy view and edit.

FIGURE 2-7: Modifying object properties.
You can find details about everything in your application here. If you click nearly anything in Visual Studio and press F4 to bring up the Properties panel (refer to Figure 2-7), you will get properties. Try it with these fun selections:
- Files in Solution Explorer
- Database connections
- A text box in a WPF project
- An XML tree node
- An item in Class View
If there is any metadata about something, the properties are in the Properties panel. It’s a great tool.
The Toolbox
One of the great misunderstood tools is the Toolbox (see Figure 2-8). On the surface, the Toolbox seems so simple. The design-time controls for a given file type are available to drag and drop. Still, there is one important thing you need to remember about the Toolbox: It displays only controls that are appropriate to the file in focus. So if you’re running a Windows Form in the designer, you won’t see a database table available to drop. Keep in mind that the Toolbox is context sensitive. It works only when it has a file to work on.
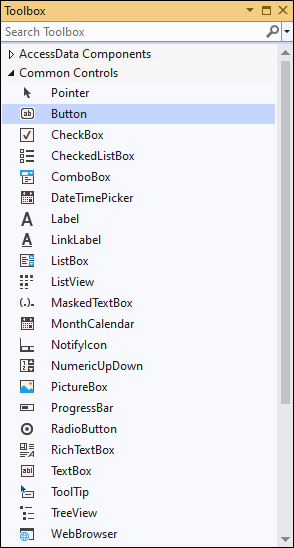
FIGURE 2-8: The Toolbox, with tools.
There is one other interesting property of the Toolbox: It can be used to store text clippings, which can be useful for demonstrations and presentations. It is also handy for storing often-used pieces of code. To do so, follow these steps:
Open a code file.
Anything will do,
.csfile,.xamlfile, whatever.- Highlight a piece of code.
Make sure the Toolbox is open and then drag the selected code to the General section of the TextBox.
The copied code becomes a tool.
- Open up another blank code file.
Drag the new tool into the code.
The copied code now appears in the code file.
Server Explorer
Server Explorer (see Figure 2-9) enables developers to access important services on the local or a remote machine. These could be anything from the Microsoft Passport to Microsoft Message Queue (MSMQ) but generally include two types of services:
- Managed services
- Database connections

FIGURE 2-9: Server Explorer.
Managed services
Managed services include services such as the Event Logs and MSMQ, which you need to look at to test parts of your application. Internet Information Services, for example, is a managed service that shows up in the list. To get a server into Server Explorer, follow these steps:
- Right-click Servers.
- Click the Add Server button.
- Type the machine name or IP number of the server you want to add.
- If you want to use different credentials than you used to log on (for a different account, for instance), click Connect Using a Different User Name and enter the new credentials.
- Click OK.
Play around with the services you see. There are a lot of features in this panel that this book doesn't cover.
Data connections
Above the Services in Figure 2-9 are the data connections. These are data connections that have been made on previous projects, which Visual Studio keeps around in case you need them for any other projects. Although keeping these connections around seems like a bit of a security risk, it sure as heck is convenient.
The goal is to reduce the dependency on SQL Management Console (the old method for managing the database for developers), and it does a darn good job. The key issue is access to the data model (table names and columns) and stored procedures; developing a program without access to the database is tough. In a new connection, these database objects are given default folders:
- Database diagrams
- Tables
- Views
- Stored Procedures
- Functions
- Types
- Synonyms
- Assemblies
The key thing you should try is to open a Stored Procedure (you can do this by double-clicking it in the Data Sources panel — which is available in a solution that has data connections). When you do so, you can easily edit SQL code, with indenting and colorization, right in Visual Studio. Use this. It’s really neat.
Class View
The last of the five main panels is Class View. As discussed in Books 1 and 2, everything in the .NET Framework is an object. The classes that make up the framework — all derivatives of Object — are viewable in a tree view. The Class View is the home for that tree view (see Figure 2-10).
From the Class View, you can look at all the members of a class and access the inline documentation, which gives you an overview of the framework and custom classes that make up your project.
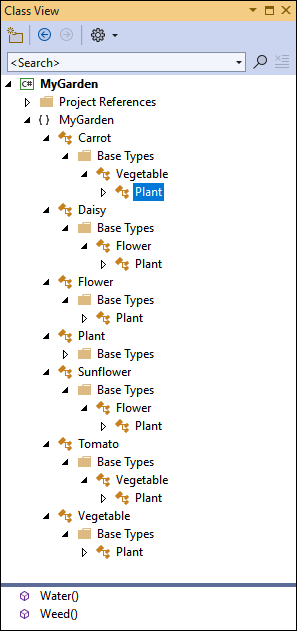
FIGURE 2-10: A view with Class.
Coding in the Code Editor
There is a lot to the Code Editor in Visual Studio. This is where you spend most of your time. Code Editor has two primary tools:
- The Editor itself: The first is the screen on which you edit the code — the Code Editor.
- Auxiliary windows: The second are the little auxiliary windows that do a lot of useful things that don’t directly relate to the code.
Exercising the Code Editor
The Code Editor is where you edit code. It doesn’t matter what type of code; all of it is edited here. You use the Code Editor to create class libraries, and it provides a smart interface for ensuring your class libraries have a good chance of working. If you are in XML, it works like an XML editor (such as the lower half of the view in Figure 2-2, shown previously).
You can get to a code file in the Code Editor a few ways. The most common way is to double-click on a source code file in Solution Explorer, and it will open in Code Editor.
If you are viewing something in the designer, you can get to the code-behind related to the file in question by any of three methods:
- Click the View Code button in Solution Explorer after highlighting a file in the list.
- Right-click the design surface and select View Code.
- Double-click a control in the designer to generate an event for that control and be moved to Code View.
You’ll find yourself using all three over time. Note that you can get directly to the code-behind files by clicking the little triangle next to a designer file and then double-clicking the code files nested within. (This feature works with auto-generated files, but won’t open the code-behind associated with the auto-generated file.)
Autocompleting with IntelliSense
IntelliSense (sometimes also called AutoComplete, IntelliCode, or other names just to confuse you) is Microsoft’s autocompletion feature, and it’s a prominent part of the Code Editor. You find IntelliSense whether you want to or not. In Code View, click inside a class and press Ctrl+spacebar. Everything you are allowed to type there shows up in a big list.
The nice thing is, IntelliSense is context-sensitive. Type Console and press the dot (.). All available members of the Console class appear. IntelliSense keeps you honest and prevents having to remember the two-million-odd members of the .NET Framework on a day-by-day basis.
IntelliSense helps with method signatures, too. Continue the line you started earlier by adding WriteLine — in other words, type (Console.WriteLine) — and then check out the IntelliSense. It will tell you all the overloads for the member in question. Use the up and down arrows to move between these members. It's slick.
Outlining
Visual Studio will auto-outline your code for you. Notice the little box with a minus sign (–) next to every namespace, class, and method in the Code Editor. Those are close-up sections of the code for readability. It might not seem like much now, but when you have 2,200 lines of code in there, you will be glad.
You can create your own outlining, too. Preceding a section that you want to outline, type #region on a new line. At the end of the section, type #endregion. This newly defined section — regardless of whether it’s at an existing outline point — will get a new outline mark. If a comment is added after a region statement, it will show in the collapsed outline.
You can expand or collapse a region by clicking the + sign or the - sign next to the #region entry. Collapse a region to focus your time on the code that requires change. Expand a region to make the hidden code appear again so you can work on it.
Exploring the auxiliary windows
A number of windows affect text input and output in order to solve certain problems. As a group, they don't really have a name, so some developers call them auxiliary windows. Here are a few of them:
- The Output window: You use the Output window regularly for two things:
Build logging: Every time you build, the Output window tracks all the linking and compiling that go on under the sheets and shows any errors that might come up.
You can use errors listed in the Output window to navigate the code. The buttons in the Output box assist with getting around the code based on the messages in the window.
- Debug statements: The second use of the Output window is as a means of seeing debug statements. If you use a
Debug.Write()statement in your code, the Output window is where it will go. Additionally, if you useConsole.Write(), but are running a Windows Forms application, for instance, the text will go to the Output window.
The Immediate window: This window does exactly what one would expect it to do: take action immediately. In debug mode, you can use the Immediate window to send commands to the program as it is running, to change the state, or evaluate operations. Try the following to see how the Immediate window works:
- Open any executable project.
Put a breakpoint somewhere in the code by clicking in the gray bar running down the side of Code View.
A red dot appears.
Choose Debug ⇒ Start Debugging or press F5.
The program should stop at the spot you selected.
Select the Immediate window.
If you don't see the Immediate window displayed by default, choose Debug ⇒ Windows ⇒ Immediate or press Ctrl+D,I.
Type ? this.
See the IntelliSense menu?
Type a . (dot).
You see a listing of all the things you can do with the
thisobject (which may be nothing if you’re not in a class) at the particular point you’re at in the code. The?command means to print whatever the object contains.
That's what the Immediate window is for. You can do more than print values, too. You can change variable values and modify the execution of your program. It is a powerful part of your debugging Toolbox.
The Breakpoints window: If you’re still running the last example, you can display the Breakpoints window by pressing Ctrl+D,B. The Breakpoints window appears, and any breakpoints you add will be in it (see Figure 2-11).
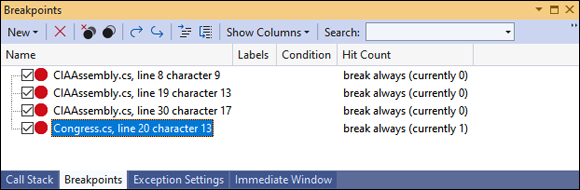
FIGURE 2-11: The Breakpoints window.
What’s cool here is that you can right-click any breakpoint and completely alter the properties of that breakpoint by choosing Settings from the context menu. Try it — the important options are described in this list:
- Location: Specifies the location of the line of code that should host the breakpoint. This is convenient if you have filters set and you find you need to shift a line back.
- Condition: You can teach the breakpoint to stop at this line only if a certain variable is a specific value.
- Hit Count: Stop here only after the xth time it is hit.
- Filter: It’s similar to Condition, except that you can use system values such as
MachineName,ProcessName,ProcessId,ThreadName, andThreadId. It's useful for multiprocessor development, among other things. - Actions (not shown): You can do more than just stop on a breakpoint — instead, you can do something like print a value to the Output window, or even run a test script.
- The Task List window: While coding, have you ever wanted to tell the developer working after you that something still needs to be done? To make this happen, create a comment and start it with
//TODO:. Adding a TODO comment makes it appear as a task in the Task List window (found on the View menu). Double-clicking the task in the Task List takes you to the line where the task was set, so you don’t have to search for it.
Using the Tools of the Trade
Any overview chapter always has topics that just don’t fit in any category. This chapter presents a double handful of tools that you want to know about.
The Tools menu
The Tools menu provides you with access to interesting tools that you can use for a variety of purposes. The following list doesn’t include every Tools menu entry, but it does contain those commonly found in the Community edition of Visual Studio.
- Get Tools and Features: Displays the Visual Studio Installer, where you find new features to add to Visual Studio, plus any Microsoft-supplied updates for the base product.
- Connect to Database: See the “Server Explorer” section, earlier in this chapter.
- Connect to Server: Discussed in the “Server Explorer” section.
- SQL Server (only when SQL Server is installed): Provides a menu containing tasks that you perform specifically with SQL Server, rather than any other data source.
- Code Snippets Manager: Code snippets make it possible to reuse bits of code in your application. See
https://docs.microsoft.com/en-us/visualstudio/ide/code-snippetsfor additional details. - Choose Toolbox Items: This tool helps you manage the items in the Toolbox. You can add or remove a variety of components, including .NET, WPF, COM, and Silverlight.
- NuGet Package Manager: Manages Visual Studio Add-ins. Add, remove, enable, and disable.
- Create GUID: Creates a Globally Unique ID (GUID), one of those 25-character codes that are supposed to be unique over the next 2,500 years or something.
- External Tools: Enables you to add separate EXE files to the Tools menu, such as Notepad, NUnit, or other tools, that add functionality to Visual Studio.
- Command Line: Displays a Windows command-prompt window or a PowerShell window in which you can interact with your application, Visual Studio, C#, or other tools. Both windows open in the current project’s folder, so you don’t have to look for it on the drive.
- Import and Export Settings: Helps you move projects between development tools. You can store your current settings in a file in the
Users<User Name>AppDataLocalMicrosoftVisualStudio<Version Number>Settingsdirectory or change current settings to another batch of settings. You can share settings with other developers. - Customize: Enables you to alter the look and feel of Visual Studio's menus and toolbars, including which toolbars are visible and the commands that they contain.
- Options: Alters the way Visual Studio works. Options are covered in some depth in Chapter 3 of this minibook. Set Visual Studio up to look and work the way you like.
Building
Previous chapters of this book discuss the basics of building a project. A few other options in the Build menu deserve at least a small explanation, including the following:
- Rebuild: This checks all the references throughout the project. It then removes any existing compiled files and compiles the project from scratch. It’s useful if your development computer has changed configuration since your last build.
- Clean: This actually deletes not only the EXEs and DLLs created as part of your project (but not your code files), but also all DLLs that were copied into your project by references that were set to that mode.
- Batch Build: This enables you to build release and debug versions (for instance), or 32 and 64 bit (as another example) at the same time.
- Configuration Manager: Use this to set the order and mode in which you build your projects. The most common configurations are DEBUG (for code in progress) and RELEASE (for finished code).
Using the Debugger as an Aid to Learning
You might be surprised to discover how many professional developers learn new techniques, which is by looking at other people’s code. It might seem like cheating, but it’s actually the smart way to do things because someone else has already done all the hard work. Of course, trying to figure out how a particularly subtle programming technique works could consume days if you just look at the code. It’s much easier to determine how the code works when seeing it in action, which is precisely why the debugger is an aid to learning. By running the code and stepping through it a bit at a time, you not only discover new programming techniques but also develop a better sense of precisely how C# works.
The example in this section relies on the cribbage application you first discover in Book 3, Chapter 5. However, the techniques work with any code, and you shouldn’t feel the need to work through any particular example. The following sections fill in the details for you.
Stepping through code
The first step in working with the debugger as an aid to learning is to set one or more breakpoints in the code. For example, you might want to see how the CribbageBoard_ method works for the Cribbage application. To perform this task, you simply click the gray stripe that runs along the left side of the Code Editor. The breakpoint appears with a red dot in the left margin and the piece of code highlighted (normally in red as well).Paint()
The next step is to start the debugger by pressing F5 or choosing Debug ⇒ Start Debugging. You stop at the first breakpoint that the application encounters, which may not be the first breakpoint you set or the first breakpoint in the code. In fact, it’s often revealing to see where you do end up because the location of a breakpoint tells you how the application starts, including what tasks it must perform and in what order it performs them.
Stepping through the code comes next. You see where the instruction pointer moves as the application executes code. You have three options for stepping through code:
- Step Into: Executes the next line of code. When the code is a method call, the instruction pointer goes to that method so that you see the internal workings of that method. Of course, you must have the method’s source code in order to see how it works.
- Step Over: Executes the next line of code without entering any method calls. The content of a method call still executes, but you see the result of the method call, rather than how the method call actually works. The method call becomes a black box.
- Step Out: Moves to the next level up (after completing execution of the current method) and then executes the next line of the caller’s code. If you have seen what you want to see inside a method call, clicking this button will move out of the method so that you can see the next line of code in the next level of the application (unless you’re already at the top level of the application).
Going to a particular code location
When the application is running, you may not want to single step through every line of code. Yes, you want to stop at a certain breakpoint, but then you decide that you don’t really want to stay there and execute the code line by line. In this case, you can hover the mouse next to the line of code that you do want to stop at next. You see a green right-pointing arrow like the one shown in Figure 2-12.
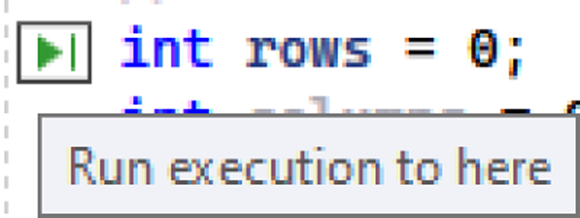
FIGURE 2-12: Executing to a line of code.
When you click the right-pointing arrow, the code from the existing instruction pointer location to the location you point to will execute. You see the results of the execution, but not the individual steps. In some cases, this technique will help you get past problematic pieces of code where timing prevents you from truly seeing how the code executes.
Watching application data
Understanding how data changes over time is an essential part of learning with the debugger. You have access to a number of windows to help you do this. For example, you can include Debug and Trace statements in your code and then view their output in the Output window. To include Debug and Trace statements, you must add using System.Diagnostics; to the top of your application code. Use Debug statements when you want to output values only for debug releases of your application. Use Trace statements when you want to output values for both debug and release versions of your application.
Whenever you execute an application, the Locals window shown in Figure 2-13 contains a list of the local (rather than the global) variables. The local variables are those that are set in the current method and are likely the variables you use most often in well-designed code.

FIGURE 2-13: Use the Locals window to see local variable values.
The right-pointing arrow next to a variable entry tells you that you can drill down to find more information. In fact, in some situations, you can drill down quite a few levels before you finally reach the end. Some objects are really complex. Viewing the content of objects helps you understand them better and often provides insights into how to better use them to create robust applications.
If a particular variable doesn't appear in the Locals window or you want to view a particular object element in more detail as the code executes, you can use the Watch window, shown in Figure 2-14, instead. You type the variable you want to watch in the window. As the code executes, you see the value change. The Watch window also allows entry of expressions such as radius * 2 or employee == null.

FIGURE 2-14: Use the Watch window to create custom variable views.
Viewing application internals
Learning to right-click in Visual Studio is a valuable aid in learning. Whenever you see anything that looks interesting, right-click it. The context menu tells you the sorts of things you can do with the object. For example, you might right-click a class and choose one of the detail view entries for it in the context menu. The internal view options you use most are
- Peek Definition: Shows the definition for the requested object in a small window within the current code window. The definition tells you more about the object.
- Go To Definition: Opens the file containing the definition for the requested object. This approach may take you away from your application, but you get more details about the object and its associated objects.
- Go To Implementation: Takes you to the location where the code implements the object, thereby making it usable within the application. A definition describes the object, while an implementation makes it a usable, real object.
- Find All References: Shows every location in the code where the object is used so that you can find every reference to it. Finding where an object is used helps you understand better how to use it for your own needs.