7
Service Mesh Observability
Distributed systems built using microservice architecture are complex and unpredictable. Irrespective of how diligent you have been in writing code, failures, meltdowns, memory leaks, and so on are highly likely to happen. The best strategy to handle such an incident is to proactively observe systems to identify any failures or situations that might lead to failures or any other adverse behavior.
Observing systems help you understand system behavior and the underlying causes behind faults so that you can confidently troubleshoot issues and analyze the effects of potential fixes. In this chapter, you will read about why observability is important, how to collect telemetry information from Istio, the different types of metrics available and how to fetch them via APIs, and how to enable distributed tracing. We will do so by discussing the following topics:
- Understanding observability
- Metric scraping using Prometheus
- Customizing Istio metrics
- Visualizing telemetry using Grafana
- Implementing distributed tracing
Without further delay, let’s start with understanding observability.
Important note
The technical prerequisites for this chapter are the same as the previous chapters.
Understanding observability
The concept of observability was originally introduced as part of control theory, which deals with the control of self-regulated dynamic systems. Control theory is an abstract concept and has interdisciplinary applications; it basically provides a model governing the application of system inputs to drive a system to a desired state while maximizing its stability and performance.

Figure 7.1 – Observability in control theory
The observability of a system is a measure of how well we can understand the internal state of that system, based on the signals and observation of its external outputs. It is then used by controllers to apply compensating control to the system to drive it to the desired state. A system is considered observable if it emits signals, which the controller can use to determine the system’s status.
In the world of IT, systems are software systems, and controllers are operators who are other software systems or sometimes human operators, such as site reliability engineers (SREs), who rely on measurements provided by observable systems. If you want your software systems to be resilient and self-regulated, then it is important that all parts of your software systems are also observable.
Another concept to remember is telemetry data, which is the data transmitted by systems used for the observability of the systems. Usually, they are logs, event traces, and metrics:
- Logs: These are information emitted by software systems in verbose format. Logs are usually the data emitted by an application and are premeditated at the time an application is designed. Logs are used heavily by developers to troubleshoot code by correlating logs with the code blocks emitting them. Logs can be structured, meaning that all log entries follow a specific pattern that makes it easier for observability systems to ingest and comprehend them. Logs can also be unstructured, which unfortunately is the case for the majority of the logs. Istio generates a full record of each request, including source and destination metadata.
- Traces: In distributed systems or applications, tracing is the means of finding how a request or an activity was processed and executed across multiple components. Traces are made up of spans that describe execution/software processing within a system. Multiple spans are then put together to provide a trace of a request being executed. Traces describe the relationship between various systems and how they partnered together to complete a task. For tracing to work in distributed systems, it is important to share a context between all systems, and those contexts are usually in the form of correlation IDs or something similar, which all participating systems can understand and honor. Istio generates distributed trace spans for each service, providing details of request flows and interdependency between various services.
- Metrics: These are numeric measurements of an internal value over a specific period. Metrics are used to aggregate large volumes of data over an interval of time, which are then used as key performance indicators for the system being observed – for example, CPU consumption percentage over a period of time or the number of requests processed per hour or every second. Istio generates metric data for latency, errors, traffic, and saturation, which are called the four golden signals of monitoring. Latency is the time it takes to service a request. Traffic is the measure of requests being handled by a system – for example, requests per second. The metric for traffic is further broken down into categories corresponding to traffic types. Error refers to the rate of request failures – for example, how many requests have the 500 response code. Saturation shows how many system resources, such as memory, CPU, network, and storage, are utilized by your system. Istio generates the metric data for both data and control planes.
All this telemetry data is used in conjunction to provide the observability of systems. There are various types of open source and commercial software available for observing software systems; Istio includes various tools out of the box, which we briefly discussed in Chapter 2. Prometheus and Grafana are shipped out of the box with Istio; in the next section, we will install Prometheus and Grafana and configure them to collect Istio’s metrics data.
Metric scraping using Prometheus
Prometheus is open source system monitoring software, which stores all metric information along with the timestamps of when they were recorded. What differentiates Prometheus from other monitoring software is its powerful multidimensional data model and a powerful query language called PromQL. It works by collecting data from various targets and then analyzing and crunching it to produce metrics. Systems can also implement HTTP endpoints that provide metrics data; these endpoints are then called by Prometheus to collect metrics data from the applications. The process of gathering metrics data from various HTTP endpoints is also called scraping.
As illustrated in the following figure, the Istio control plane and data plane components expose endpoints that emit metrics, and Prometheus is configured to scrape these endpoints to collect metrics data and store it in a time series database:

Figure 7.2 – Metric scraping using Prometheus
We will describe the process in detail in the following sections.
Installing Prometheus
Istio already provides a sample installation file available in /sample/addons/ prometheus.yaml, which is good enough as a starting point. We have modified the file slightly to cater to applications that support strict mTLS mode only:
% kubectl apply -f Chapter7/01-prometheus.yaml
serviceaccount/prometheus created
configmap/prometheus created
clusterrole.rbac.authorization.k8s.io/prometheus created
clusterrolebinding.rbac.authorization.k8s.io/prometheus created
service/prometheus created
deployment.apps/prometheus created
The changes in our file, 01-prometheus.yaml, in comparison to the out-of-the-box file, are that we have provisioned Istio certificates for Prometheus by injecting a sidecar and configuring it to write the certificate to a shared volume, which is then mounted onto the Prometheus container. The sidecar is just for mounting and managing the certificates and doesn’t intercept any inbound and outbound requests. You will find the changes in Chapter7/01-prometheus.yaml .
You can check what has been installed in the istio-system namespace:
% kubectl get po -n istio-system
NAME                       READY   STATUS    RESTARTS   AGE
istio-egressgateway-7d75d6f46f-28r59   1/1     Running   0          48d
istio-ingressgateway-5df7fcddf-7qdx9   1/1     Running   0          48d
istiod-56fd889679-ltxg5                1/1     Running   0          48d
prometheus-7b8b9dd44c-sp5pc            2/2     Running   0          16s
Now, we will look at how we can deploy the sample application.
Deploying a sample application
Let’s deploy the sockshop application with istio-injection enabled.
Modify sockshop/devops/deploy/kubernetes/manifests/00-sock-shop-ns.yaml with the following code:
apiVersion: v1
kind: Namespace
metadata:
  labels:
    istio-injection: enabled
  name: sock-shop
Then, deploy the sockshop application:
% kubectl apply -f sockshop/devops/deploy/kubernetes/manifests/
Finally, we will configure an Ingress gateway:
% kubectl apply -f Chapter7/sockshop-IstioServices.yaml
Now, make some calls from the browser to send traffic to the frontend service as you’ve been doing in the previous chapters. We will then check some metrics scraped by Prometheus to access the dashboard, using the following commands:
% istioctl dashboard prometheus
http://localhost:9090
From the dashboard, we will first check that Prometheus is scraping the metrics. We can do so by clicking on Status | Targets on the Prometheus dashboard:

Figure 7.3 – The Prometheus configuration
You will see all targets from which Prometheus is scraping the metrics.
On the dashboard, we will fire up a query to get a total request between the istio- Ingress gateway and the frontend service, using the following code:
istio_requests_total{destination_service="front-end.sock-shop.svc.cluster.local",response_code="200",source_app="istio-ingressgateway",namespace="sock-shop"}
Figure 7.4 – PromQL
In the preceding screenshot, the name of the metric is istio_requests_total, and the fields in curly brackets are known as metric dimensions. Using the PromQL string, we are specifying that we want the istio_requests_total metric whose dimensions are destination_service, response_code, source_app, and namespace to match the front-end.sock-shop.svc.cluster.local, 200, istio-ingressgateway, and sock-shop values respectively.
In response, we receive a metric count of 51 and other dimensions as part of the metric.
Let’s make another query to check how many requests to the catalog service have been generated from the frontend service, using the following code:
istio_requests_total{destination_service="catalogue.sock-shop.svc.cluster.local",source_workload="front-end",reporter="source",response_code="200"}Note in the query how we have provided reporter = "source", which means we want metrics reported by the frontend Pod.

Figure 7.5 – PromQL istio_request_total from the frontend to the catalog
If you change reporter = "destination", you will see similar metrics but reported by the catalog Pod.

Figure 7.6 – PromQL istio_request_total from the frontend to the catalogue, reported by the catalog sidecar
Let’s also check the database connection between the catalog service and the MySQL catalog database, using the following query:
istio_tcp_connections_opened_total{destination_canonical_service="catalogue-db",source_workload="catalogue", source_workload_namespace="sock-shop}
Figure 7.7 – PromQL TCP connections between catalogue and catalogue-db
The metric data shows that the catalog service made seven TCP connections.
So far, we have used default metric configuration. In the next section, we will read about how these metrics are configured and how to customize them by adding new metrics.
Customizing Istio metrics
Istio provides flexibility to observe metrics other than what comes out of the box. This provides flexibility to observe application-specific metrics. With that in mind, let’s begin by looking at the /stats/prometheus endpoint exposed by the sidecar:
% kubectl exec front-end-6c768c478-82sqw -n sock-shop -c istio-proxy -- curl -sS 'localhost:15000/stats/prometheus' | grep istio_requests_total
The following screenshot shows sample data returned by this endpoint, which is also scraped by Prometheus and is the same data you saw using the dashboard in the previous section:
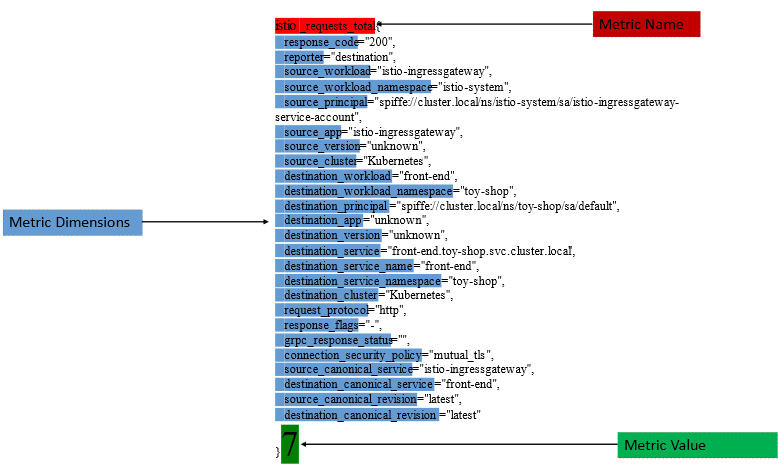
Figure 7.8 – Istio metric, dimensions, and value
The metric is organized in the following structure:
- Metric name: This is the name of the metric exported by Istio. Out-of-the-box Istio generates many metric details, which can be found at https://istio.io/latest/docs/reference/config/metrics/#metrics.
- Metric dimensions: These are the various fields that are part of a metric. These fields are called dimensions in the context of Prometheus and labels in the context of an Istio metric. Details about standard label parts of Istio metrics are available at https://istio.io/latest/docs/reference/config/metrics/#labels.
- Metric value: This is the value of the metric and can be a counter, gauge, or histogram.
- A counter is used to track the occurrence of an event. Counters are continuously increasing values exposed as time series. Some examples of metrics with counter-type values are request counts, bytes received, and TCP connections.
- A gauge is a snapshot of a measurement at a single point in time. It is used to measure metrics such as CPU consumption and memory consumption.
- As the name suggests, histograms are used for measuring observations spread over a period. They are also the most complex metric to measure.
The telemetry component of Istio is implemented by the proxy-wasm plugin. We will read more about this in Chapter 9, but for now, just understand it as a means to build extensions for Envoy. You can find these filters using the following command:
% kubectl get EnvoyFilters -A
NAMESPACE      NAME                               AGE
istio-system   stats-filter-1.16                  28h
istio-system   tcp-stats-filter-1.16              28h
The filters run WebAssembly at different points of request execution and collect various metrics. Using the same technique, you can easily customize Istio metrics by adding/removing new dimensions. You can also add new metrics or override any existing metrics. We will discuss how to achieve this in the following sections.
Adding dimensions to the Istio metric
The istio_request_total metric doesn’t have any dimensions for a request path – that is, we cannot count how many requests we are receiving for individual request paths. We will configure an EnvoyFilter to include request.url_path in the request_total metric. Please note that istio_ is a prefix added by Prometheus; the actual metric name in the context of Istio is request_total.
We will discuss EnvoyFilter in Chapter 9, so if you want to jump to that chapter to understand the various ways of extending Istio, please do so; alternatively, you can also read about this filter at https://istio.io/latest/docs/reference/config/networking/envoy-filter/#EnvoyFilter-PatchContext.
In the following configuration, we have created an EnvoyFilter that is applied to frontend Pods, using the condition in workloadSelector, in the following code block:
apiVersion: networking.istio.io/v1alpha3
kind: EnvoyFilter
metadata:
  name: custom-metrics
  namespace: sock-shop
spec:
  workloadSelector:
    labels:
      name: front-end
Next, we apply configPatch to HTTP_FILTER for inbound traffic flow to the sidecar. Other options are SIDECAR_OUTBOUND and GATEWAY. The patch is applied to HTTP connection manager filters and, in particular, the istio.stats subfilter; this is the filter we discussed in the previous section and is responsible for Istio telemetry:
configPatches:
  - applyTo: HTTP_FILTER
    match:
      context: SIDECAR_INBOUND
      listener:
        filterChain:
          filter:
            name: envoy.filters.network.http_connection_manager
            subFilter:
              name: istio.stats
      proxy:
        proxyVersion: ^1.16.*
Note that the proxy version, which is 1.16, must match the Istio version you have installed.
Next, we will replace the configuration of the istio.stats filter with the following:
patch:
      operation: REPLACE
      value:
        name: istio.stats
        typed_config:
          '@type': type.googleapis.com/udpa.type.v1.TypedStruct
          type_url: type.googleapis.com/envoy.extensions.filters.http.wasm.v3.Wasm
          value:
            config:
              configuration:
                '@type': type.googleapis.com/google.protobuf.StringValue
                value: |
                  {
                    "debug": "false",
                    "stat_prefix": "istio",
                    "metrics": [
                      {
                        "name": "requests_total",
                        "dimensions": {
                          "request.url_path": "request.url_path"
                        }
                      }
                    ]
                  }
In this configuration, we are modifying the metrics field by adding a new dimension called request.url.path with the same value as the request.url.path attribute of Envoy. To remove any existing dimension – for example, response_flag – please use the following configuration:
"metrics": [
                      {
                        "name": "requests_total",
                        "dimensions": {
                          "request.url_path": "request.url_path"
                        },
                        "tags_to_remove": [
                          "response_flags"
                        ]
                      }
Then, apply the configuration:
% kubectl apply -f Chapter7/01-custom-metrics.yaml
envoyfilter.networking.istio.io/custom-metrics created
By default, Istio will not include the newly added request.url.path dimension for Prometheus; the following annotations need to be applied to include request.url_path:
spec:
  template:
    metadata:
      annotations:
        sidecar.istio.io/extraStatTags: request.url_path
Apply the changes to the frontend deployment:
% kubectl patch Deployment/front-end -n sock-shop --type=merge --patch-file Chapter7/01-sockshopfrontenddeployment_patch.yaml
You will now be able to see the new dimension added to the istio_requests_total metrics:

Figure 7.9 – The new metric dimension
You can add any Envoy attributes as a dimension to the metric, and you can find the full list of available attributes at https://www.envoyproxy.io/docs/envoy/latest/intro/arch_overview/advanced/attributes.
Creating a new Istio metric
You can also create a new Istio metric using EnvoyFilter, similar to what you used to create custom metrics.
In the following example, we have created new metrics using definitions and also added another dimension:
              configuration:
                '@type': type.googleapis.com/google.protobuf.StringValue
                value: |
                  {
                    "debug": "false",
                    "stat_prefix": "istio",
                    "definitions": [
                      {
                        "name": "request_total_bymethod",
                        "type": "COUNTER",
                        "value": "1"
                      }
                    ],
                    "metrics": [
                      {
                        "name": "request_total_bymethod",
                        "dimensions": {
                          "request.method": "request.method"
                        }
                      }
                    ]
                  }
Next, apply the changes:
% kubectl apply -f Chapter7/02-new-metric.yaml
envoyfilter.networking.istio.io/request-total-bymethod configured
We must also annotate the frontend Pod with sidecar.istio.io/statsInclusionPrefixes so that the request_total_bymethod metric is included for Prometheus:
% kubectl patch Deployment/front-end -n sock-shop --type=merge --patch-file Chapter7/02-sockshopfrontenddeployment_patch.yaml
deployment.apps/front-end patched
It would be a good idea to restart the frontend Pod to make sure that the annotation is applied. After applying the changes, you can scrape the Prometheus endpoint using the following code:
% kubectl exec front-end-58755f99b4-v59cd -n sock-shop -c istio-proxy -- curl -sS 'localhost:15000/stats/prometheus' | grep request_total_bymethod
# TYPE istio_request_total_bymethod counter
istio_request_total_bymethod{request_method="GET"} 137
Also, using the Prometheus dashboard, check that the new metric is available:

Figure 7.10 – New metrics
With this, you should now be able to create a new Istio metric with dimensions, as well as updating dimensions for any existing metrics. In the next section, we will look at Grafana, which is yet another powerful observability utility.
Visualizing telemetry using Grafana
Grafana is open source software used for the visualization of telemetry data. It provides an easy-to-use and interactive option for visualizing observability metrics. Grafana also helps to unify telemetry data from various systems in a centralized place, providing a unified view of observability across all your systems.
Istio installation provides sample manifests for Grafana, located in samples/addons. Install Grafana using the following commands:
% kubectl apply -f samples/addons/grafana.yaml
serviceaccount/grafana created
configmap/grafana created
service/grafana created
deployment.apps/grafana created
configmap/istio-grafana-dashboards created
configmap/istio-services-grafana-dashboards created
Once you have installed Grafana, you can open the Grafana dashboard using the following commands:
% istioctl dashboard grafana
http://localhost:3000
This should open the Grafana dashboard, as shown in the following screenshot:

Figure 7.11 – Grafana dashboard
Grafana already includes the following dashboards for Istio:
- Istio Control Plane Dashboard: This provides charts showing resource consumption by Istio’s control plane components. It also provides metrics on the interaction between the control plane and the data plane, including xDS push, errors during configuration sync, and conflicts in the configuration between the data plane and the control plane.
- Istio Mesh Dashboard: This provides a summary view of the mesh. The dashboard provides a summary view of requests, errors, gateways, and policies, as well as details about services and their associated latency during request processing.
- Istio Performance Dashboard: This provides charts that show the resource utilization of Istio components.
- Istio Service and Workload Dashboards: This provides metrics about the request-response for each service and workload. Using this dashboard, you can find more granular details about how services and workloads are behaving. You can search for a metric based on various dimensions, as discussed in the Metric scraping using Prometheus section.

Figure 7.12 – Istio Service Dashboard
Another powerful feature of Grafana is alerting, where you can create alerts based on certain kinds of events. In the following example, we will create one such alert:
- Create an alert when response_code is not equal to 200, based on the istio_request_total metric in the last 10 minutes.

Figure 7.13 – Creating alerts in Grafana
- Configure an alert to be raised when the count of a request with a ~=200 response code is more than 3 in the past 10 minutes; this is also called the threshold. We will also configure the frequency of evaluation for this alert and the threshold for firing the alert. In the following example, we have set the alert to be evaluated every minute but fired after 5 minutes. By adjusting these parameters, we can prevent the alert from being fired too soon or too late.

Figure 7.14 – Configuring the threshold to raise an alert

Figure 7.15 – Adding details about the alert
- After configuring the name of the rule, you configure labels, which are a way to associate alerts with notification policies:

Figure 7.16 – Alert notifications

Figure 7.17 – Configure contact points
- And finally, you create a notification policy, which specifies the contact points that will be notified about the alert.

Figure 7.18 – Configuring a notification policy
You finally have your alert configured. Now, go ahead and disable the catalog service in sockshop.com, make a few requests from the website, and you will see the following alert fired in Grafana:

Figure 7.19 – Alerts raised due to a failure caused by catalog service outage
In this section, we saw an example of how we can use Grafana to visualize various metrics produced by Istio. Grafana provides comprehensive tooling to visualize data, which helps in uncovering new opportunities as well as unearthing any issues occurring within your system.
Implementing distributed tracing
Distributed tracing helps you understand the journey of a request through various IT systems. In the context of microservices, distributed tracing helps you understand the flow of requests through various microservices, helps you to diagnose any issues a request might be encountering, and helps you quickly diagnose any failure or performance issues.
In Istio, you can enable distributed tracing without needing to make any changes in application code, provided your application forwards all tracing headers to upstream services. Istio supports integrations with various distributed tracing systems; Jaeger is one such supported system, which is also provided as an add-on with Istio. Istio distributed tracing is built upon Envoy, where tracing information is sent directly to the tracing backend from Envoy. The tracing information comprises x-request-id, x-b3-trace-id, x-b3-span-id, x-b3-parent-spanid, x-b3-sampled, x-b3-flags, and b3. These custom headers are created by Envoy for every request that flows through Envoy. Envoy forwards these headers to the associated application container in the Pod. The application container then needs to ensure that these headers are not truncated and, rather, forwarded to any upstream services in the mesh. The proxied application then needs to propagate these headers in all outbound requests from the application.
You can read more about headers at https://www.envoyproxy.io/docs/envoy/latest/intro/arch_overview/observability/tracing.
In the following section, we will learn how to install Jaeger and enable distributed tracing for the sockshop example.
Enabling distributed tracing with Jaeger
Jaeger is open source distributed tracing software, originally developed by Uber Technologies and later donated to CNCF. Jaeger is used to monitor and troubleshoot microservices-based systems. It is used primarily for the following:
- Distributed context propagation and transaction monitoring
- Microservice dependency analysis and troubleshooting
- Understanding bottlenecks in distributed architectures
Yuri Shkuro, the creator of Jaeger, published a book called Mastering Distributor Tracing (https://www.shkuro.com/books/2019-mastering-distributed-tracing) that explains many aspects of Jaeger design and operations. You can read more about Jaeger at https://www.jaegertracing.io/.
Next, we will install and configure Jaeger in Istio.
The Kubernetes manifest file for deploying Jaeger is already available in samples/addons/jaeger.yaml:
% kubectl apply -f samples/addons/jaeger.yaml
deployment.apps/jaeger created
service/tracing created
service/zipkin created
service/jaeger-collector created
This code block installs Jaeger in the istio-system namespace. You can open the dashboard using the following command:
$ istioctl dashboard jaeger
Unfortunately, the sockshop application wasn’t designed to propagate the headers, so for this scenario, we will make use of the bookinfo application as an example with Istio. But before that, we will deploy the httpbin application to understand the Zipkin tracing headers injected by Istio:
% kubectl apply -f Chapter7/01-httpbin-deployment.yaml
Let’s make a request to httpbin and check the response headers:
% curl -H "Host:httpbin.com"  http://a858beb9fccb444f48185da8fce35019-1967243973.us-east-1.elb.amazonaws.com/headers
{
  "headers": {
    "Accept": "*/*",
    "Host": "httpbin.com",
    "User-Agent": "curl/7.79.1",
    "X-B3-Parentspanid": "5c0572d9e4ed5415",
    "X-B3-Sampled": "1",
    "X-B3-Spanid": "743b39197aaca61f",
    "X-B3-Traceid": "73665fec31eb46795c0572d9e4ed5415",
    "X-Envoy-Attempt-Count": "1",
    "X-Envoy-Internal": "true",
    "X-Forwarded-Client-Cert": "By=spiffe://cluster.local/ns/Chapter7/sa/default;Hash=5c4dfe997d5ae7c853efb8b81624f1ae5e4472f1cabeb36a7cec38c9a4807832;Subject="";URI=spiffe://cluster.local/ns/istio-system/sa/istio-ingressgateway-service-account"
  }
}
In the response, note the headers injected by Istio – x-b3-parentspanid, x-b3-sampled, x-b3-spanid, and x-b3-traceid. These headers are also called B3 headers, which are used for trace context propagation across a service boundary:
- x-b3-sampled: This denotes whether a request should be traced or not. A value of 1 means yes and 0 means prohibited.
- x-b3-traceid: This is 8 or 16 bytes in length, indicating the overall ID of the trace.
- x-b3-parentspanid: This is 8 bytes in length and represents the position of the parent operation in the trace tree. Every span will have a parent span unless it is the root itself.
- x-b3-spanid: This is 8 bytes in length and represents the position of the current operation in the trace tree.
In the response from httpbin, the request is traversed to the Ingress gateway and then to httpbin. The B3 headers were injected by Istio as soon as the request arrived at the Ingress gateway. The span ID generated by the Ingress gateway is 5c0572d9e4ed5415, which is a parent of the httpbin span that has a span ID of 743b39197aaca61f. Both the Ingress gateway and httpbin spans will have the same trace ID because they are part of the same trace. As the Ingress gateway is the root span, it will have no parentspanid. In this example, there are only two hops and, thus, two spans. If there were more, they all would have generated the B3 headers because the value of x-b3-sampled is 1.
You can find out more about these headers at https://www.envoyproxy.io/docs/envoy/latest/configuration/http/http_conn_man/headers.html.
Now that you are familiar with x-b3 headers injected by Istio, let’s deploy the sample bookinfo application and configure the Ingress. If you have not created a Chapter7 namespace, then please do so with Istio injection enabled:
% kubectl apply -f samples/bookinfo/platform/kube/bookinfo.ya
ml -n Chapter7
% kubectl apply -f Chapter7/bookinfo-gateway.yaml
Note that Chapter7/bookinfo-gateway.yaml configures bookshop.com as the host; we did it so that it can run along with sock-shop.com. Once the Ingress configuration is deployed, you can access bookinfo using the external IP of the istio-ingress gateway service. Please use /productpage as the URI. Go ahead and make some requests to the bookinfo app, after which you can check the Jaeger dashboard and select productpage.Chapter7 as the service. Once you have selected the service, you can click on Find Traces, which will then show a detailed view of the latest traces for the service:

Figure 7.20 – The Jaeger dashboard
A trace in Jaeger is a representation of a request execution and is composed of multiple spans; the trace records the path taken and traversed by a request. A trace is made up of multiple spans; a span represents a unit of work and is used to track specific operations made by a request. The first span represents the root span, which is a request from start to finish; each subsequent span provides a more in-depth context of what has happened in that part of the request execution.
You can click on any of the traces on the dashboard. The following is an example of a trace with eight spans:

Figure 7.21 – Trace and spans in Jaeger
In the following screenshots, you can observe the following:
- The request took 78.69 milliseconds in istio-ingressgateway, which is also the root span. The request was then forwarded to the productpage upstream service at port 9080. If you look at the next child span, you will see that the time taken in istio-ingressgateway is 78.69 – 76.73 milliseconds = 1.96 milliseconds.

Figure 7.22 – The root span of BookInfo
- The request was then received by the productpage service at 867 microseconds in the overall processing timeline. It took 76.73 milliseconds to process the request.

Figure 7.23 – The request arriving on the product page
- The productpage service did some processing between 867 microseconds and 5.84 milliseconds, and after that, it invoked the details service at port 9080. It took 12.27 milliseconds to make the round trip to the details service.

Figure 7.24 – The request from the product page to the details service
- The request was then received by the details service after 7.14 milliseconds, and it took 1.61 milliseconds to process the request.

Figure 7.25 – The request arriving at the details service
I have not illustrated the rest of the spans, but I hope you get an idea of the benefits of doing this exercise. The example we just went through raises some intriguing observations:
- By comparing the start time of the third and fourth spans, it is clear that it took 1.3 milliseconds for the request to depart from the product page and arrive on the details page
- The details page took only 1.6 milliseconds to process the request, but it took 12.27 milliseconds for the product page to receive the request and send it to the details page, which highlights some inefficiencies in the product page implementation
You can explore further by clicking on the dropdown in the top-right corner of the dashboard.

Figure 7.26 – Other options to see the tracing details
The Trace Spans Table option is very useful in presenting a summarized view of the time taken by multiple spans to process requests:

Figure 7.27 – The trace span table in Jaeger
Tracing comes at the cost of performance, and it is not ideal to trace all requests because they will cause performance degradation. We installed Istio in a demo profile, which by default samples all requests. This can be controlled by the following configuration map:
% kubectl get cm/istio -n istio-system -o yaml
You can control the sampling rate by providing the correct value for sampling in tracing:
apiVersion: v1
data:
  mesh: |-
..
      tracing:
       sampling: 10
        zipkin:
          address: zipkin.istio-system:9411
    enablePrometheusMerge: true
..
kind: ConfigMap
This can also be controlled at the deployment level – for example, we can configure the product page to sample only 1% of the requests by adding the following to bookinfo.yaml:
  template:
    metadata:
      annotations:
        proxy.istio.io/config: |
          tracing:
            sampling: 1
            zipkin:
              address: zipkin.istio-system:9411
The entire configuration is available in Chapter7/bookinfo-samplingdemo.yaml.
In this section, we learned about how distributed tracing can be performed using Jaeger without making any changes in the application code, provided your application can forward x-b3 headers.
Summary
In this chapter, we read about how Istio makes systems observable by generating various telemetry data. Istio provides various metrics that can then be used by Istio operators to fine-tune and optimize a system. This is all achieved by Envoy, which generates various metrics that are then scraped by Prometheus.
Istio allows you to configure new metrics as well as add new dimensions to existing metrics. You learned how to use Prometheus to query various metrics using PromQL and build queries that can provide insight into your system, as well as business operations. We later installed Grafana to visualize the metrics collected by Prometheus, even though there are a number of out-of-the-box dashboards provided for Istio, and you can easily add new dashboards, configure alerts, and create policies on how these alerts should be distributed.
Finally, we installed Jaeger to perform distributed tracing to understand how a request is processed in a distributed system, and we did all this without needing to modify the application code. This chapter provides the foundational understanding of how Istio makes systems observable, resulting in systems that are not only healthy but also optimal.
In the next chapter, we will learn about the various issues you may face when operating Istio and how to troubleshoot them.